1
eurostat news
STATIONS 1983
ISBN-92-825-4537-7 (EN/FR)
Format A 4, 186 pages, price BFR 600
This annual publication presents, in its first part, the main operating statistics for the past year and gives an outline of the structure of the nuclear plant situation, with units on line as well as units under construction.
eurostat
eurostat news
NEWS ITEMS
Sixth statistical programme of the European Communities
1985-87 3 Eurostat Directory — Issue No 4, October 1984 4
Fisheries in the European Communities 4 Remote sensing and Community agriculture 7
The consumer price index 10 The calculation of purchasing power parities and
compari-sons in real values of aggregates of the national accounts 13
Eurostat — Europe and the world in figures 19
Parliamentary questions 24
Programme for publications for 1985 (yellow pages) II
PUBLICATIONS
Published 28 To be published 30 Periodicals 32
Editor: Mr Aristotelis Bouratsis, JMO B3/087A, Tel. 4301/2046 Secretariat and dissemination: JMO B3/092, Tel. 4301/2038
The opinions expressed in the signed articles are not necessarily those of Eurostat.
Reproduction of the contents of this publication is subject to acknow-ledgement of the source.
Statistical Office of the European Communities
a/kt*
Luxembourg: Office for Official Publications of the European Communities, 1985
Eurostat News
is also published in French and German DE ISSN 0378-505X
FR ISSN 0378-36OX
Sixth statistical programme
of the European Communities 1985-87
The Commission has approved a new statisti-cal programme (COM(84)364 final) which is being sent to the Economic and Social Committee.
Summary
The central aim of the new programme remains unchanged compared with the fifth statistical programme.1 It is to provide a
statistical service which will prove to be a basic and flexible instrument for the formu-lation, monitoring and administration of Community policies in most fields of priority according to the framework programmes drawn up annually by the Commission. The standards to be maintained or achieved are high. The statistical service of the European Community must in all essential aspects be on a par with that of its major trading partners.
Much progress has been made in setting up an extensive network of data banks. Some new data banks still remain to be developed but the emphasis in the coming years will be more on the following activities:
(i) Bringing the complete statistical service, i.e. statistical expertise as well as the statistics, closer to the user with increased attention to the linking and analysis of statistics from Various sources.
(ii) Concentrating intra-Community har-monization and standardization in those fields where closer comparisons are urgently required for policy needs.
1 COM(81) 327 final. See also Eurostat News No. 3—
1981.
(iii) Increased recognition in statistical work of the world context in which the Com-munity acts: the bringing closer together of Community and international stan-dards, statistics as an instrument of innovation, statistics of high technology, development of technical cooperation in statistics.
(iv) Better coordination of the input, throughput and output of statistical information from all sources in order to promote maximum use at minimum cost, while continuing the search for the elimi-nation or reduction of high-cost/ low-benefit statistics in order to release resources to cope with new demands.
Guidelines
The following guidelines were used in drawing up the programme:
(i) Elimination of unnecessary statistics; (ii) Maximizing the use of statistics already
available;
(iii) Rationalizing the flows of statistical information;
(iv) Ensuring the maximum cooperation of the Member States;
(v) Strengthening the links between Eurostat and other Commission services.
The programme consists of seven docu-ments:
Annex 1 — Directorate A:
Processing and dissemination of statisti-cal information.
Annex 2 — Directorate B:
General economic statistics.
Annex 3 — Directorate C:
Annex 4 — Directorate D (part.):
Energy.
Annex 5 — Directorate D (part.):
Industry and services.
Annex 6 — Directorate E (part.):
Demographic and social statistics.
Directorate E (part.):
Agricultural statistics.
Copies may be obtained from Marije Klin-kum, Bâtiment Jean Monnet, Office B3/029, Kirchberg/Luxembourg, tel. 4301-3105.
Eurostat Directory — Issue No 4, October 1984
Eurostat has prepared a new version (see Eurostat News No 1-1984) of a guide intended to help users of Eurostat statistics to contact officials who can help them find the statistics they need. This document is a kind of vade-mecum of the work of the Statistical Office.
The subject-matter areas are first divided according to directorates and then, within directorates, divisions and other
administra-tive units, and finally within these units by work areas. The names and telephone num-bers of the officials concerned are given for each work area so that the information source may be rapidly pinpointed.
The Directory is currently available in English, French and German. Copies can be obtained from Marije Klinkum, Bâtiment Jean Monnet, Office B3/029, Kirchberg/ Luxembourg, tel. 4301-3105.
Fisheries in the European Communities
This short survey shows the position of the European Community in the world, outlines the major developments in the last decade (which are largely due to the extension of economic zones that took place around the beginning of this period) and indicates the position that the enlarged Community (EUR 12, i.e. including the applicant States, Spain and Portugal) might be expected to hold.
The principal source of data has been the Eurostat Yearbook of fisheries (1984) to which the reader is referred for greater detail. In citing certain global figures in this survey the author, on his own responsibility, has been obliged to make a number of estimates.
Catches of fishery products
Although Denmark registers the largest total catch, only about 20% of this is destined for consumption (the rest being used for fish meal and oil production) and thus the United Kingdom and France (with a catch of about 770 000 tonnes) are the major contributors to the consumption market. Other sizeable con-tributions are made by the Netherlands (500 000 tonnes), Italy (480 000 tonnes) and the FR of Germany (310 000 tonnes). Of particular note is the Irish catch of 210 000 tonnes, more than double the mean annual catch for the period 1971-75.
Approximately 85% of the EUR 10 catch was taken from fishing grounds in the North-east Atlantic, 10% from the Mediterranean Sea, 1% from the North-west Atlantic, and lesser quantities from other such widespread parts of the world as the South-east Atlantic, North-east Pacific, the Indian Ocean and the Antarctic
Spain shows the greatest diversification in fishing grounds by operating not only in the North Atlantic and Mediterranean but by also making appreciable catches in the East-central and South-east Atlantic, that is off the West-African coasts.
Although the North-west Atlantic grounds make a relatively small contribution to the total Community catch they are extremely important for the distant-water fishing fleet and this region shows the greatest impact for the Community of the extension of economic zones that took place in the early to mid-1970s. In the period 1971-75 the annual catch on the traditional fishing grounds of the North-west Atlantic was 170 000 tonnes for EUR 10. In 1982 this had fallen to 70 000 tonnes due in part to the very limited access to American and Canadian grounds accorded to the Community. For the enlarged Com-munity, EUR 12 (that is including the applicant States Spain and Portugal), the decrease is even more acute, from 500 000 tonnes in 1971-75 to 110 000 tonnes in 1982.
Due to the extension of economic zones and more severe stock management measures the combined annual catch by EUR 10 of eight of the more important food fish (cod, haddock, whiting, saithe, sole, plaice, red fish and her-ring) dropped from 2.2 million tonnes in
1971-75 to 1.3 million tonnes in 1982. Some compensation for this shortfall was obtained by increased catches of other species. For example, the rapid development of the mack-erel fishery to the south and west of the British Isles resulted in increased catches for EUR 10 from 98 000 tonnes in 1971-75 to 490 000 tonnes in 1982. However, in most cases these increased catches were of species that were not generally acceptable as direct replacements of species for which shortfalls were recorded. The consequence of this will be noted in the section on international trade in fishery products.
Value of the catch
In 1982 the total value of fishery products at first sale was approximately 3 000 million ECU for EUR 10 and 4 800 ECU for EUR 12. For the Community as a whole this represented only 0.1% of the gross domestic product of market prices, with variations from 0.04% for Belgium to 0.7% for Portu-gal. However, it should be noted that this is a global figure which ignores the regional importance of the industry and the fact that much of the product is further processed before consumption, thereby adding to its value.
Foreign trade in fishery products
The extension of economic zones has been a major factor in the development of interna-tional trade in fishery products which has increased from an annual mean of 7.6 million tonnes in 1971-75 to 10.2 million tonnes in 1982, an increase of 34%. Countries having reduced access to fishing grounds where tra-ditional food species are found are obliged to seek supplies on the international market. Conversely countries now hawing preferential access to supplies of fish beyond the domestic demand seek export markets for the fish.
The Community has a very prominent pos-ition in the international trade in fishery products, particularly as regard imports. Overall, in 1982, EUR 10 was responsible for 39% by volume and 33% by value for imports and 24% by volume and 20% by value for exports. For certain individual products the Community is dominant: for example about 75% of the fish oil on the international market is imported to the Community. Similarly the world's two biggest importers of fish meal are the United Kingdom and the FR of Germany.
The increased trade is seen in the Community data. EUR 10 imports increased from 2.85 million tonnes in 1971-75 to 3.6 million tonnes in 1982. The corresponding data for EUR 12 are 3.2 and 4 million tonnes. The increase is even more marked with exports, where for EUR 10 they were 770 000 tonnes in 1971-75 and 2.26 million tonnes in 1982; for EUR 12 they were 960 000 tonnes and 2.54 million tonnes for the respective per-iods.
In 1982, only the Netherlands, Ireland and Denmark currently have exports of fishery products exceeding imports, both in value and volume. However, both EUR 10 and EUR 12 had overall deficits of 1.4 million tonnes (2 000 million ECU) and 1.5 million tonnes (2 350 million ECU). In terms of volume this is a distinct improvement over the situation in 1971-75 when for EUR 10 and EUR 12 the deficits were 2.0 and 2.2 million tonnes. How-ever, in value the situation is much less satis-factory since in 1971-75 the annual deficits were only 180 and 90 million ECU for EUR 10 and EUR 12 respectively. This situ-ation is readily explained by the Community increasing imports of the traditional and high-priced species for which catches have decreased and greatly increasing exports of, unfortunately, low-valued species for which catch exceeds domestic demand (e.g. mackerel).
Fishing fleet
about 140 and therefore the biggest in the Community) as observed in other countries: this is probably due to the facts that oceanic tuna fishing, in which a good proportion of the fleet operates, has not been subject to great changes in the severity of management measures in recent years and that where access has been restricted the vessels have been diverted to other waters (e.g. off the West-African coasts).
Employment in the fishing industry
This is another sector in which the statistics are generally incomplete, poorly harmonized and are often only estimates. However, there are probably in the order of 160 000
fisher-men in the Community (EUR 10). This is only about 0.1% of the working population or about one fiftieth of the number of agricul-tural workers. However, the importance of fisheries should not be judged on these global figures. Many communities, particularly in the underprivileged regions of the Com-munity, are heavily dependent on fisheries with few, if any, viable alternatives available. It has also been estimated that for every man at sea there are four or five men on land building and maintaining the vessels and equipment and processing the perishable product.
The available Spanish and Portuguese data suggest that, with the adhesion of those two countries, the number of fishermen will about double.
D. Cross
Remote sensing and Community agriculture
The European Commission is interested in possible applications of remote sensing in agriculture. The policies adopted might affect the various fields of study, provide the necess-ary guidelines and enable pilot projects to be launched and followed up. Directorate-Gen-eral VI (Agriculture) is responsible for coordi-nating the entire field of agricultural research while Directorate-General XII (Science, Re-search and Development) and the Joint Research Centre take charge of the theoretical aspects and, in particular, the processing of
the data obtained from sources such as radar, radióme try and satellites.
1. It would appear quite likely that, as a major world power, the Commission will one day have the use of a satellite network which will enable it to assess the agricultural resources of the other major powers or blocs, such as the United States, the Soviet Union, China and Brazil, etc. and make estimates on the basis of its own data. Information obtained in this way would enable the Com-mission to identify areas where there were likely to be surpluses and/or shortages as well as detecting agricultural disasters as they occur. The Commission would thus be in a position to forecast the probable volume of world trade in the basic agricultural products, such as cereals, sugars, groundnuts and soya.
questions concerning the environment, pol-lution, fisheries or the resources and potential of specific areas (including agricultural land) and barren regions. Various research projects are already underway in these fields involving climatology, cartography, water use, soil drainage, study of the Mediterranean regions, biomass and developments in mountainous areas (erosion).
3. In the case of regions concentrating exclusively on a single crop or a limited number of specific crops, remote sensing is already a source of valuable information. Techniques have been mastered for utilizing the results for specific real-time applications such as the production of an olive-growing register in Italy or the management of irri-gated arable areas in Mali and the Niger delta. In the medium term there are likely to be rapid developments in applications of this kind to include forestry registers, registers of areas under vines or fruit (such as citrus fruits) and water management in irrigated areas. The Community could process and develop the various programmes in this field through technical aid in collaboration with the countries associated under the Lome Con-vention, thereby contributing to the improve-ment of the basic agricultural statistics in certain countries.
4. Data obtained by remote sensing will one day come to play an important part in a European agrometeorological network cover-ing aspects such as temperature, humidity, advance warning for plant protection measures, local programmes for agricultural work, the possibility of second crops, etc. The collection and processing of meteorological data will improve advance warning of excep-tional climatic conditions. Ultimately, region-al forecasts will be made of probable average temperature or precipitation for the next 10, 20 or 30 days. This information will help the Commission in its work on harvest forecasts for the current year.
5. The Commission does in fact have monthly harvest forecasts for planning
pur-poses. For each Member State and for the main crops, harvest forecasts (area under cultivation multiplied by yield) are already drawn up on the basis of available survey results (in December, March, May or June depending on the Member State in question), expert opinions and meteorological data for the past month (temperature, precipitation) recorded at 120 Community measurement stations. It is quite possible that in due course remote sensing may be incorporated into the existing system with a view to improving these forecasts.
For this purpose, the information transmitted by satellite will need to be processed in such a way as to permit:
5.1 Definition of the major administrative regions of agricultural land (units of 50-100 000 km2) of relevance to the
Com-munity harvest under consideration.
5.2 Production of a growth calendar for crops as a function of the agricultural and climatic peculiarities of the above regions. The data must cover the wide variation in climate between the north and the south of the Community, the large number of strains used for the same crops and the actual methods of cultivation used.
5.3 Classification of crops (or groups of crops) permitting adequate precision in the calculation of areas under cultivation, e.g.:
(i) Grassland and pastureland;
(ii) Winter crops (wheat, barley, colza) or land freshly ploughed in November; (iii) Spring crops (barley, maize, fodder beet,
potatoes, sunflowers) or land cleared in March or April.
Certain localized programmes are underway to examine possible classifications for crops which can be detected by remote sensing (JRC-SCEES ground-truth tests in Ardèche.1)
1 JRC: Commission DG XII. SCEES: Service Central des
The results obtained hitherto are very modest, i.e. at present two or three groups of crops at best could be detectable.
5.4 Determination of yield indicators, which should be available by June or July at the latest, permitting a forecast to be made of the probable size of the harvest. This will require correlating the spectral response with the state of the crop (i.e. health, volume of harvest). 5.5 Completion of the data utilization phase and immediate centralization of results (for siting of processing centres) - Impils pro-gramme.
Experience in forecasting Community har-vests has shown that if increased efficiency is to be archieved the following data will need to be obtained by means of remote sensing under the Agritel programme:
(i) At the beginning of December, figures for the area under wheat and barley with a margin of error of less than 4%; (ii) At the beginning of May, figures for the
area under wheat and barley with a mar-gin of error less than 1%, and less than 3% for each spring crop;
(ili) At the beginning of August, figures for the yield with a margin of error of the order of 3%.
6. Obviously, certain Member States, which are in a better position for developing remote-sensing applications (e.g. France) will be able to obtain appreciable results even at the most detailed level, i.e. the small agricul-tural regions. In this way, remote sensing will contribute towards an improvement of Com-munity statistics as a whole and hence the planning which is our ultimate objective. With the ever increasing power of computers, in 5, 10 or 15 years, the fact that land in
Europe is divided up into relatively small lots will almost certainly pose less of a problem than the common presence of cloud cover over most of the agricultural regions of the Community, which will make effective obser-vation of agricultural phenomena on particu-lar dates two or three times a year somewhat difficult. Fortunately, by then all-weather radar will have come to fill some of the gaps in remote-sensing techniques.
Obviously, in agriculture remote sensing will for a long time continue to be a source of information which merely supplements the existing statistical programmes. Data on mag-netic tape will be supplied within two to eight days depending on the complexity of the user's request. In 1986, the ERBS (USA) and SPOT (France)1 satellites (the latter of which
will have a resolution of 10™) will provide new and regular data for the evaluation of areas and harvests with a reliability and accuracy which can be expected to be satisfactory.
At this stage, therefore, the Commission must define its requirements with a view to drawing up programmes which take account of the possibilities of remote sensing in all cases in which the total operating costs remain within reasonable budgetary limits. As regards the assessment of harvests, the crops to be studied must be identified, a sampling plan must be drawn up for the regions producing these crops (reliability and accuracy tests), a ground-level network of centres for the collec-tion of real informacollec-tion must be set up in order to produce the local reference classifi-cation and, finally, a satellite data acquisition programme must be defined in order to deter-mine priorities in the daily programmes for satellite observations.
R. Linguenheld
The consumer price index
A — Importance
Among the economic indicators which Euro stat publishes regularly, the consumer price index, also known under the names 'Retail price index' or 'Cost of living index', is one of the most important.
Its function is to measure the changes in the level of prices for all goods and services consumed by households.
The percentage change in the consumer price index is generally considered to be the rate of inflation.
This index is thus a tool of economic analysis and is used as a criterion for assessing the economic situation in countries.
Changes in consumer prices are always observed with great attention. This applies to both national and international comparisons. This was particularly true during the 10 years following the first oil crisis in 1973, when rises in the consumer price index were considerable and different in the various countries.
(a) In most of the countries the calculation and publication of up-to-date figures for this index is ordered by law. In general the consumer price index is published at most 20 days after the end of the month, and is thus rapid and up-to-date information. (b) It measures the average change in prices
of goods and services consumed by house holds, which constitutes for the majority of the population the bulk of its ex penditure.
(c) The information provided by this index can be understood by the general public. The concept of the 'household basket' for those articles which are part of everyday requirements is in current use and its price changes concern the whole population. . (d) While there are other indices which could
be used as an instrument for measuring the inflation (e.g. the price index for the GDP), the role of the consumer price index is uncontested, especially because it is available every month with only a short delay.
(e) No other index has such a universal character. Its applications are also uni versal: it is used in many countries for ad justing salaries, pensions, allowances and social assistance benefits as well as for adjusting prices in commercial and civil contracts.
(0 This index is used for the updating of purchasing power parities. These parities which are calculated on the base of an enquiry can be extrapolated with the help of the consumer price index during several years, thus avoiding expensive enquiries every year.
Β — Use of the CPI
The main factors favouring the use of the consumer price index as the general indicator of the development of purchasing power are;
C — Methods of calculation
least five years). The exceptions are France and the United Kingdom which use a Las peyres chain index with an annually changing 'basket' and weighting.
2. The base years of the national indices vary from country to country. To facilitate comparisons Eurostat has chosen the year 1975 as fixed reference year for the publi cation of all these indices.
From 1 January 1985 the reference year for publication will be 1980.
3. The coverage of the consumer price index differs according to each country.
Differences may concern:
(a) The index population (e.g. all households, certain professional categories, specific income-groups).
(b) Geographic zones (e.g. the whole country, only big cities, only the capital). (c) Concepts of expenditure (e.g. whether
expenditures for rents, health, etc. are included or excluded).
D — Comparability
Proper international comparison would re quire an index calculated according to uni form methods in all countries ; in spite of the efforts made in this field by different inter national organizations (UNO, ILO, OECD) this goal is not yet attained.
Within the Community certain Member States have been using for several years the ESA classification introduced by Eurostat (e.g. Belgium, Denmark, the Netherlands and Italy).
In addition the national indices can be used for extrapolating the absolute price level within the Community and that of non-EC countries. Eurostat (Division Β 3) has also developed a system in which the purchaing power parities are compared to the official exchange rates, a price level index.
E — Calculation of the EUR 10 index
For several years Eurostat has published for all its series of consumer price indices an index for the Community as a whole (EUR 10).
These EUR 10 indices are the arithmethic averages of the national indices weighted by the relative share of each country in the final consumption of households as obtained in the comparison in real values of the aggregates of the ESA for 1975. (1975 has been derived from the new 1980 results.)
F — The series published by Eurostat
Eurostat regularly publishes consumer price indices for the Member States and certain other countries, covering the overall index and detailed indices for eight main groups. In principle, the indices for the countries are reproduced as they are published by the countries, although studies into the compara bility of these price indices have shown that they are not entirely comparable.
The base year of the national indices varies from country to country but Eurostat trans formed the indices to one fixed reference year, which is at present 1975. This trans formation is a simple rebasing of each series independently.
The national indices converted to base 1975 are then used for the calculation of a Community index.
Canada, Japan, Switzerland, Austria, Nor way and Sweden.
This data are also published monthly in Eurostatistics, and annually in Basic statistics and in Eurostat review.
In 1983 Eurostat completed a programme with the assistance of the Member States to extend the number of detailed series of the consumer price index.
These series have been selected in accordance with the ESA classification; this is a classi fication of consumption by purpose and not by groups of products.
This means that Eurostat can now provide also monthly and annual figures for more than 20 detailed series (base 1975= 100). These series have recently been published in a publication entitled Consumer price indices 1976-1983.
The series are the following:
A — Consumer prices — general index. Β — Food (excl. drinks and meals out):
B.l Bread and cereals. B.2 Meat.
B.3 Dairy products, eggs, oils and fats.
B.4 Fruits, vegetables, potatoes.
C — Drinks (home consumption) and tobacco:
C.l Drinks (home consumption). C.2 Tobacco.
D — Clothing and footwear (incl. repairs): D.l Clothing (incl. repairs).
D.2 Footwear (incl. repairs). E — Rent, heating and lighting:
E.l Rents and water charges. F — Household goods and services:
F.l Furniture, floor coverings, house hold textiles.
F.2 Household appliances, utensils and services.
G — Transport and communications: G.l Private transport.
G.2 Public transport. G.3 Communications.
H— Recreation and education, etc.: H.l Recreational goods. H.2 Recreational services.
H.3 Books, newspapers and maga zines.
J — Other goods and services:
J.l Expenditure in hotels, pubs and restaurants.
Energy products.
The calculation of purchasing power parities
and comparisons in real values of aggregates
of the national counts
The meaning of purchasing power parities
For some time now it has been standard practice, not merely in the Community Member States, but throughout the world, to calculate purchasing parities in order to make comparisons in real values.
The need for this procedure became apparent once it was realized that international com-parisons of gross domestic product (GDP) and its components based on conversions into a common currency (the dollar at world level, and the ECU for the Community Member States) using exchange rates did not give an accurate indication of the volume of goods and services intended for ultimate consump-tion in the individual countries.
The reason is that the exchange rate does not necessarily reflect the actual purchasing power of a currency in the national territory, this rate being largely determined on the one hand by the supply of, and demand for, currency to make payment for goods and services traded between countries, and on the other hand by other factors such as flows of capital, whether or not a country belongs to a monetary system, speculation, and the politi-cal and economic situation of a country. The
comparison of data converted on the basis of exchange rates is therefore subject to major distortions, varying from one country or sector to another, hence there is an increasing tendency to use purchasing power parities as conversion rates.
These parities are calculated on the basis of the national accounts, since the aim is to compare GDP and its components, i.e.: (i) the final consumption of households; (ii) the public consumption of general
government and private adminis-trations;
gross capital formation;
the balance of exports and imports. (iii)
(iv)
Each of these uses is broken down into groups of homogenous products (or basic headings) resulting in a classification of approximately 300 basic headings for the whole of GDP. This classification serves a twofold purpose, in that it affords a basis on which to collect the prices needed for the calculation of the parities and also provides the expenditure figures to which the parities are applied.
The procedure for determining parities
The determination of purchasing power parities entails several stages, as described below.
The list of products and the collection of prices
the product on the market can be precisely identified.
There are two approaches which may be adopted when selecting the list of products. On the one hand it is possible to compile one overall list for all the countries (the multi lateral approach) which means that all the products must have a price in all the coun tries. This approach is feasible if the countries to be compared have a very similar pattern of consumption (Luxembourg and Belgium, for instance). It is then possible to work with very rigid definitions at the same time and main tain a significant degree of representative ness.
However, this is not usually the case, even within the Community, where patterns of consumption often differ very considerably between countries (Greece and Ireland, for instance). Given this situation, the use of one overall list for all the countries would create both practical and conceptual problems, for example, the products would not be on the market everywhere and the degree of representativeness would vary. There is known to be a negative correlation between prices and quantities and, if products were not equally representative, the results would be distorted since the selection of unrepresen tative products would cause the volumes of the countries to be underestimated.
One means of ensuring that products were representative might be to broaden the defi nitions, but there would then be a danger of not comparing the same products. In order to avoid these problems, it was decided to adopt, an approach entailing adherence to fairly strict definitions — that means that we work very often with identical products — while at the same time ensuring that the products are highly representative of the individual countries. This approach is called the binary approach because it favours those price collections — and therefore those price ratios — carried out between pairs of countries solely on the basis of representative products.
Proceeding in this way it may, of course, be that there is no common product for one or more pairs of countries and therefore no direct common link. In such instances, the link will be established indirectly by using the links for representative products existing between these countries and a third or fourth country. To take an example, if, say, 10 products have been selected within a basic heading in the classification, and a pair of countries (for example France and Ireland) do not have a common representative product. The link between France and Ireland will be made by using for instance the link Ireland/ United Kingdom and United Kingdom/ France or even Ireland/United Kingdom, United Kingdom/Belgium, Belgium/France.
Obviously, if this approach is adopted, the number of prices recorded, and accordingly the cost of the overall operation, will be reduced without impairing the quality of the results. It is, however, vital to ensure that all the countries are linked satisfactorily by refer ring to a table of price records drawn up in advance.
The price collection for final household consumption is carried out by the national statistical offices with some technical help from Eurostat. The number of price quo tations varies according to the nature of the product. For the public tariffs for instance, one quotation is sufficient, whereas in other fields, such as clothing and footwear, about 15 quotations distributed over the different types of shops are suitable.
For gross fixed capital formation which covers the equipment goods as well as construction and civil engineering, prices are provided by engineers and architects. (Concerning construction, the bills of quanti ties of about 20 works are evaluated.)
goods for use in industry or construction works — have a market price, this is not so in the case of public consumption by general government. The products of this aggregate are non-market products which are not sold at market prices, and their 'price levels' are compared by referring to the cost incurred to produce them. These largely comprise expenditure on civil servants' salaries and the purchase of goods and services.
Before the parities are going to be calculated, the prices are analysed in detail by Eurostat and some corrections are done. As the price surveys are carried out only in the capital cities, we must bear in mind that these prices have to be extrapolated to the national average and this is done with the spatial coefficients provided by the countries. Also, as the surveys for a given benchmark year takes place at different periods of the year (for the benchmark year 1985 they are evenly spread over the years 1984, 1985 and 1986), the annual average must be calculated by using the national price indices.
The calculation of parities and real values
Purchasing power parities between two currencies are merely the ratio between the amounts of national currency needed to purchase the same quantity of goods (for instance, a kilo of rice of a given quality) in the two countries concerned. They are there-fore calculated from the price ratios between one country and another for the selected products.
The parities are calculated on the basis of two sets of data, annual national average prices for the products in the 'shopping basket' and the expenditure figures for the about 300 basic headings.
There are two very distinct stages in the calculation, the first involving calculating the parities for the basic headings.
The method adopted for this is closely linked to the method of selecting the products, and ensures — for the various pairs of countries
— that only the prices of representative prod-ucts are included in the calculation. This calculation procedure entails constructing first a Laspeyres-type estimate by calculating the simple geometric mean of the price ratios of products which, among the common prod-ucts, are those which are most representative of the patterns of consumption in the refer-ence country (if only one product is selected, the Laspeyres-type estimate will obviously consist solely of the price ratio based on that product). A Paasche-type estimate is then made in the same way on the basis of typical products in the partner country (which may of course differ in number from those which were used to construct the Laspeyeres esti-mate). Finally, a Fisher-type estimate can be calculated as a simple geometric mean of the aforementioned Laspeyres and Paasche estimates.
The parity for the basic heading for a pair of countries will therefore not necessarily be deduced from the price ratios of all the prod-ucts nor from all thé available price ratios for these two countries — price ratios which may be partly inaccurate and lead to distorted results — but the parity will be calculated solely with reference to a minimum of price ratios for products which are equally repre-sentative in the two countries. If for a pair of countries there is no reliable price ratio avail-able for the direct calculation of the parity, this will be calculated indirectly using a third or even a fourth country as bridge country as has already been described.
The second stage in the calculation entails aggregating the parities obtained for the basic headings into parities for increasingly large groups of products until the parity for the individual aggregates and eventually that for GDP are obtained. This is done by referring to the" structure of the expenditure figures of GDP.
and expressing the parities for each country in relation to this average price rather than taking a group of countries as base.
A decision then has to be made on the cur rency unit in which the parities and real values obtained by applying these parities to the nominal expenditure figures are to be expressed. Instead of taking a given country as reference and expressing the parities for the other countries in terms of its currency, the Community, and therefore the ECU, was taken as reference.
Thus, the figures for a given country are expressed first of all in ECU and then in real terms, the unit in which these new figures are expressed being called the 'Purchasing power standard' (PPS). This is the 'real' ECU.
The extrapolation of parities
Parities are calculated on the basis of fullscale price surveys at fiveyearly intervals. However, since price trends — and therefore price levels — and exchange rates are not the same in all countries, parities have also to be estimated between the base years. The parities calculated for a base year are usually updated by reference to the price indices for the coun tries. The use of these indices means that parities are inconsistent in time because the
parities obtained for two base years by means of fullscale price surveys differ from those obtained by extrapolating the parities for one base year to the other using price indices. This inconsistency between calculated parities and parities extrapolated by means of indices is due to a number of factors, including the improvement in the basic data generated by price surveys, the revision of the data in the national accounts and the fact that national price indices are not an entirely appropriate yardstick for extrapolating parities. The criteria used in the construction of these temporal indices differ from those used in the construction of spatial indices, the two types of indices do not cover the same field and they are not sufficiently harmonized within the Community.
Some results
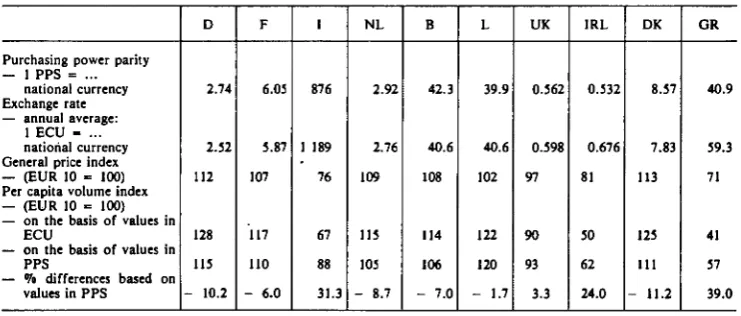
In order to give a clearer idea of the significance and importance of calculating purchasing power parities and real values, the principal results for 1980 are shown in the table below by way of example. These relate to the whole of GPD and, more particularly, per capita GDP, this being the most commonly used indicator of the standard of living, despite some reservations.
1980
Purchasing power parity 1 PPS = ...
national currency Exchange rate — annual average:
1 ECU ... national currency General price index — (EUR 10 » 100) Per capita volume index — (EUR 10 ■= 100) — on the basis of values in
ECU
— on the basis of values in PPS
— It differences based on values in PPS
D 2.74 2.32 112 128 113 10.2 F 6.05 5.87 107 117 110 6.0
I
876
1 189 76 67 88 31.3 NL 2.92 2.76 109 115 105 8.7
Β 42.3 40.6 108 114 106
7.0 L 39.9 40.6 102 122 120 1.7
UK 0.562 0.598 97 90 93 3.3 IRL 0.532 0.676 81 50 62 24.0 DK 8.57 7.83 113 125 U I 11.2
[image:18.459.52.423.431.589.2]In this table, the exchange rates and the parities for each country are expressed in relation to the ECU and PPS respectively. Thus, in 1980, for instance, it cost LIT 1189 to purchase one ECU on the basis of the exchange rate whereas, on the basis of parities, LIT 876 was sufficient to obtain the quantity of products equal to one PPS. The actual purchasing power of the lira is there-fore very much higher in this instance than its exchange rate suggests.
Exchange rates between, countries may be deduced from exchange rates for the ECU, and the same procedure can be adopted to obtain the parities between countries. Thus, for instance, DM 1, which at the official exchange rate was equal to LIT 472 in 1980, was worth only LIT 318 when expressed in terms of the purchasing power parity for that year. This also means that prices in Germany were generally 48% higher than in Italy. In other words, the exchange rate for the mark was overvalued in relation to that of the lira.
The ratio of the parity in PPS to the exchange rate in ECU makes it possible to calculate what is termed the price level index for a given country. This index measures the differ-ence between the price level in the country in question and the Community average and can also be used to make a direct comparison of price levels in the individual countries. This price level index also shows how much it costs to purchase the same quantity of goods in each of the countries (for instance, 71 ECU in Greece and 113 ECU in Denmark, i.e. 59% more in the latter) or the country in which it is possible to buy the largest quantity of goods and services for the sum of 100 ECU (this being Greece, which has the lowest price level of all the countries in the Community, almost 30% below the average).
The most significant indicator resulting from the calculation of parities is the index of per capita GDP which is undoubtedly the most commonly used indicator in international comparisons. This index expresses in the form
of rates the per capita GDP of each country in relation to average per capita GDP for all the countries in the Community, this being 7 500 ECU in 1980.
On the basis of values expressed in ECU, the 1980 per capita GDP of the Federal Republic of Germany was 28% above the Community average, i.e. 9 600 ECU. However, in terms of real values Germany's per capita GDP was only 15% above the Community average, i.e. 8 625 PPS.
The vast difference recorded between Greece and the Federal Republic of Germany in the indices in ECU (41 compared with 128) means that the ratio for per capita GDP is 1:3 + . On the other hand, in real values, this ratio is only 1:2 on the basis of the 1980 figures. (If all the components of GDP are analysed in this way the results for the various groups of products and aggregates maktng up GDP repay close study.)
It can therefore be said that indices based on figures in PPS considerably reduce the differ-ences between standards of living in the indi-vidual countries, and the more prosperous countries are shown to be less affluent than figures converted on the basis of exchange rates suggest, whereas the less prosperous countries are less poor than conventional methods of calculation, based on exchange rates, infer.
Comparisons in real values therefore change the sequence of the countries in terms of relative per capita GDP: in 1980 the per capita GDP of the Federal Republic of Ger-many expressed in ECU was far higher than that of the other countries but, in terms of PPS, Luxembourg was in first place for instance.
These brief remarks are demonstrating that the use of exchange rates causes the pros-perity of a country to be overestimated or underestimated and highlight the need for, and importance of, comparisons in real values, which are an invaluable and essential tool for economic analysis on a world-wide scale.
Prospects
Eurostat 's work on the international front
The SOEC's work on purchasing power par-ities is part of a worldwide International Comparison Project (ICP) carried out by the United Nations. The preliminary work was done in the 1950s at the University of Penn-sylvania, but it was not until 1970 that calcu-lations were made at regular intervals. The reference year for phase V of this project is 1985. It will cover some 80 countries com-prising several geographical areas, such as Europe (Eastern Europe and Western Europe), Latin America, Africa and the countries of East Asia. In addition to this subdivision by area, there are economic and political groupings such as the OECD coun-tries and the Community Member States. Eurostat has become increasingly involved in this project over the years and can now claim to play a leading role in the development of methodology, the compilation of lists and definition of products, as well as covering a large number of countries. Eurostat covers the 10 Member States, the two prospective members (Spain and Portugal), Austria, Israel and about 20 African countries, as well as providing technical assistance to many other countries.
The utilization of parities
Increasing use is being made of the parities both within Eurostat and in the other Com-mission departments.
Broadly speaking, it can be said that they are used in areas where comparisons used to be made between countries on the basis of data converted into ECU using exchange rates. The main purposes for which these parities are used are the national accounts (this is also the most logical area in which to use them since the parities are calculated on the basis of the national accounts) and, more particularly, the comparison of GDP for which the princi-pal results have just been analysed.
However, there is also an increasing tendency to use these parities for other purposes such as energy statistics (energy prices), social istics (earnings per hour), agricultural stat-istics (agricultural economic accounts, index of sectoral income, standard gross margins) or the weighting values of the EUR 10 indices, which are now expressed in PPS rather than in ECU. It should be stressed, nonetheless, that the figures in PPS are not used in place of the figures in ECU but arc published in conjunction with them.
When these parities are used particularly for purposes other than the national accounts, it has to be decided which rate should be applied. Should the overall rate of GDP be adopted or should specific rates existing for the 300 or so basic headings of GDP be selected according to the type of value to be converted or should, in some instances, specific rates, which are not obtained in the course of regular calculations of the parities but which would have to be calculated to meet specific requirements — as for agricultural income, for instance — be used?
Econ-omic and Financial Affairs, which uses them in Community-level economic forecasts and analyses, or in other sectors in which per capita GDP is used as a criterion for breaking down Community income and expenditure (Social Fund, ERDF, Community loans). The use of the parity in conjunction with the exchange rate as a conversion rate has encountered a number of obstacles since its inception. It is a relatively new statistical
instrument which has not always been prop-erly understood and interpreted in all quart-ers, with the result that it has met with some mistrust. The reservations which prevailed in some quarters are now disappearing and the usefulness of, and need for, the parities are becoming increasingly recognized.
Statisticians now have to make this tool even more reliable and effective.
M. De March
Eurostat — Europe and the world in figures
In the present unfavourable economic climate it is more important than ever that the de-cision-making process be based on rational arguments. This applies equally to politicians and the top decision-makers in the industrial sector. The monitoring of past fluctuations of key indicators such as exchange rates, the balance of payments, external trade and unemployment is an essential factor in the recognition of current or future trends. The general public has hitherto taken very little notice of the corresponding mass of data that is simply waiting to be used. Eurostat, for its part, gathers information on the econ-omic situation of the Member States and their trading partners. It does not collect these data itself; they are received from the statistical offices of the Member States and other national or international institutions such as central banks, the OECD, the IMF and the World Bank.
Eurostat harmonizes and aggregates these data wherever this is feasible and necessary. In the past the data were mainly issued in the form of printed publications, and this form of dissemination is still an important aspect of Eurostat's activities. There are approxi-mately 100 publications. These appear at various intervals and cover the following sectors:
(i) economic accounts, finance, balance of payments;
(ii) population and social indicators; (iii) industry and services;
(iv) agriculture and forestry, fisheries; (v) external trade.
In recent years an increasing proportion of the data on which these publications are based has been managed by means of the various computer systems at Eurostat's dis-posal. The creation of the national and inter-national data transmission networks (Euro-net, PSS, Transpac, etc.) has provided a new means of ensuring the availability of statist-ical data by giving the end user direct access to them. The advantages of such networks, compared with printed publications, are con-siderable. They greatly enhance the degree of detail, the data can relate to long periods of time 'and users can receive retroactive correc-tions; above all, however, they ensure that the data are absolutely up to date.
case. The data in three of these data bank systems are currently available to the general public.
Cronos contains 750 000 macroeconomic time-series covering every part of the econ omy. The data normally relate to the EC Member States and are also available, in many cases, for Japan, the United States, Spain and Portugal. The periodicity of these time-series is monthly, quarterly, half-yearly or yearly, depending on the statistical field covered.
It is a particular advantage of Cronos, in the model-building context, that many of the time-series stretch back over an extended period: certain series date back as far as 1950. The content of Cronos is broken down into 23 domains, and one or several domains extend over a specific part of the economy (e.g. economic accounts, balances of pay ments, industry, agriculture, social indicators, etc.).
It has also proved necessary, for the purposes of EC agreements with non-member countries (e.g. the Lome Convention), to ensure the availability of the most important statistical data in respect of the various countries con
cerned. Hence the presence in two domains of Cronos, for approximately 150 countries, of demographic statistics and data relating to the balance of payments, debt, production and external trade.
The following are a few typical queries that can be answered with the help of Cronos: (i) What is the monthly trend of the four
main economic indicators, i.e. consumer prices (inflation), the global or branch-related index of industrial pro duction, unemployment and the trade balance? (see Table 1.)
(ii) What is the significance of a specific branch of industry (on the basis of production, turnover and labour costs) in relation to the national econ omy or the same branch of industry in other countries?
(iii) What is the productive capacity of a specific branch of industry, considered from the standpoint of investment and external trade?
(iv) What is the state of penetration of the European market for textiles or for household products (ratio of imports to total consumption)? Month 7. 1983 8. 1983 9. 1983 10. 1983 11. 1983 12. 1983 1. 1984 2. 1984 3. 1984 4. 1984 5. 1984 6. 1984 7. 1984 8. 1984 9. 1984
Table 1 : Main economic indicators for the EC (EUR 10) Price index (change from previous year) 8.4 8.3 8.5 8.4 8.1 8.1 8.0 8.0 7.9 7.7 7.5 7.5 7.0 7.0 6.6 Unemployment rate (%) 10.0' 10.1' 10.4' 10.5' 10.6' 10.81 11.2' 11.2' 11.0' 10.7' 10.5' 10.4' 10.6' 10.7' 10.9' Production index (change from previous year) 1.1 3.1 2.2 2.6 5.2 5.7 5.4' 3.6' 3.3' 1.4' 3.3' - 0 . 3 ' 3.7' 4.3'
Trade balance (mio ECU)
- 1 428.4 - 2 801.3 - 1 486.4 - 649.2
70.1 - 1 182.6 - 4 652.6 - 1 307.9 - 1 598.8 - 3 060.1 - 2 364.0 - 3 447.7
Themes Sub-themes
1. General statistics (grey covers) (5 publications)
3.
1. General statistics
2. Regional general statistics 3. Third-country statistics
National accounts, finance and balance of payments
(violet covers) (17 publications)
Population and social conditions
(yellow covers) (14 publications)
Industry and services (blue covers) (22 publications)
Agriculture, forestry and fisheries (green covers) (17 publications) 1. 2. 3. 4. 5. 6. 7. 1. 2. 3. 4. 5. 6. 1. 2. 3. 1. 2. 3. National accounts Accounts of sectors Accounts of branches Money and finance
Regional accounts and finance Balance of payments
Prices Population Social conditions Education and training Employment
Social protection Wages and incomes Industry, general Energy
Iron and steel Agriculture, general
Agriculture, production and ba Agriculture, prices
6. Foreign trade, transport
(red covers) (17 publications)
9. Miscellaneous
(brown covers) (3 publications)
4. Agriculture, accounts 5. Agriculture, structure 6. Forestry
7. Fisheries 1. Nomenclature
2. Community trade, general 3. Transport
4. Trade with developing countries 1. Miscellaneous statistics
2. Miscellaneous information
Theme 1 — General statistics
(grey covers)
Sub-themes Titles Frequency
1. General statistics
2. Regional general statistics
1. EUROSTAT REVIEW (dark blue cover)
2. BASIC STATISTICS OF THE EURO PEAN COMMUNITY
3. EUROSTATISTICS — Date for short-term economic analysis
1. YEARBOOK OF REGIONAL STAT ISTICS
3. Third-country statistics 1. ACP — BASIC STATISTICS
A
A
M
A
Sub-themes Titles Frequency
1. National accounts
2. Accounts of sectors
3. Accounts of branches
4. Money and finance
5. Regional accounts and finance
6. Balances of payments I.
2.
3.
1.
2.
1.
1.
1.
NATIONAL ACCOUNTS ESA — Aggre gates
INTERNATIONAL COMPARISON OF GROSS DOMESTIC PRODUCT AND OF PURCHASING POWER — 1980
STUDIES OF NATIONAL ACCOUNTS
NATIONAL ACCOUNTS ESA tailed tables by sector
De-7. Prices
1.
t
2.
3.
4.
5.
6.
7.
1.
GENERAL GOVERNMENT ACCOUNTS AND STATISTICS
NATIONAL ACCOUNTS ESA — De tailed tables by branch
MONEY AND FINANCE
REGIONAL ACCOUNTS — The Com munity's financial participation in invest ments
REGIONAL ACCOUNTS ESA — De tailed tables by branch
BALANCES OF PAYMENTS — Geo graphical breakdown
BALANCES OF PAYMENTS — Quar terly data
BALANCES OF PAYMENTS OF THE EUROPEAN COMMUNITIES* INSTI TUTIONS
BALANCES OF PAYMENTS — Method ology of Ireland
BALANCES OF PAYMENTS — Method ology of the Netherlands
BALANCES OF PAYMENTS — Method ology of Italy
BALANCES OF PAYMENTS — Method ology of Greece
CONSUMER PRICE INDICES
A
n.p.
n.p.
A
Q
A
A
A
Q
n.p.
n.p.
n.p.
n.p.
Subthemes Titles Frequency 1. Population
2. Social conditions
3. Education and training 4. Employment
5. Social protection
6. Wages and incomes
I. DEMOGRAPHIC STATISTICS A
1. FAMILY BUDGETS: Comparable tables n.p. Netherlands/Belgium/Ireland/Denmark/
Spain
2. STANDARDIZATION OF OCCU n.p.
PATIONÀL INJURY STATISTICS
FROM FOUR COUNTRIES
1. EDUCATION AND TRAINING n.p.
1. EMPLOYMENT AND UNEMPLOY-
A
MENT
2. EMPLOYMENT AND UNEMPLOY n.p.
MENT — Statistical bulletin
3. UNEMPLOYMENT — Monthly bulletin M
4. LABOUR FORCE SAMPLE SURVEY A
5. STATISTICAL STUDIES OF EMPLOY n.p. MENT
1. SOCIAL PROTECTION (Receipts and A
expenditure) (Results by schemes)
1. EARNING IN INDUSTRY AND SER HY
VJCES
2. EARNING OF MANUAL WORKERS IN Β
AGRICULTURE 1984
3. STRUCTURE OF EARNINGS 1978/79 — n.p. Main results
4. EARNINGS DIFFERENTIALS IN THE n.p.
Subthemes Tides Frequency 1. Industry, general
2. Energy
3. Iron and steel
1. INDUSTRY STATISTICS YEARBOOK 2. STRUCTURE AND ACTIVITY OF IN
DUSTRY 1982
3. STRUCTURE AND ACTIVITY OF IN DUSTRY — Data by size of enterprise — 1981
A A
4.
5.
6.
7.
8.
9.
10.
1.
2.
3.
INDUSTRIAL PRODUCTION
EC NONMINERAL RAW MATERIALS BALANCE SHEETS
RAW MATERIALS SUPPLY BAL ANCES
INDUSTRIAL SHORTTERM TRENDS ANNUAL INVESTMENTS IN FDŒD ASSETS — 19751982
RETAIL SALES — INDEX NUMBERS STEEL CONSUMPTION BY BRANCH IN THE EC
ENERGY STATISTICS YEARBOOK OPERATION OF NUCLEAR POWER STATIONS
USEFUL ENERGY BALANCE
SHEETS
HY
Β
A
M
A
M
n.p.
A
A
n.p.
4. ANALYSIS OF ENERGY INPUTOUT s.i. PUT TABLES
5. COAL — Monthly bulletin M
6. ELECTRICAL ENERGY — Monthly M
bulletin
7. HYDROCARBONS — Monthly bulletin M
8. ELECTRICITY PRICES A
9. GAS PRICES A
1. IRON AND STEEL YEARBOOK A
(green covers)
Sub-themes Titles Frequency
1. Agriculture, general
2. Agriculture, production and balance
3. Agriculture, prices
5. Agriculture, structure
6. Forestry
7. Fisheries
1. YEARBOOK STATISTICS
OF AGRICULTURAL
1. FEED BALANCE SHEET 1973-84
2. ANIMAL PRODUCTION
3. CROP PRODUCTION
1. EC AGRICULTURAL PRICE INDICES (Output and input)
2. AGRICULTURAL PRICES 1973-84
3. AGRICULTURAL PRICES (microfiches)
4. AGRICULTURAL PRICES: Selected series from the Cronos data bank
5. CATALOGUE OF THE CHARACTER ISTICS OF AGRICULTURAL PRICE SERIES STORED IN CRONOS
4. Agriculture, accounts 1. ECONOMIC ACCOUNTS — CULTURE, FORESTRY
AGRI-1. SURVEY ON THE STRUCTURE OF AGRICULTURAL HOLDINGS 1983
2. SURVEY ON THE STRUCTURE OF AGRICULTURAL HOLDINGS 1979/80
3. STUDY ON THE RESULTS OF COM MUNITY SURVEY OF ORCHARD FRUIT TREES
4. SURVEY ON WINE
5. SURVEY ON WINE (microfiches)
1. FORESTRY STATISTICS
1. FISHERIES — STATISTICAL YEAR BOOK
A
Q
Q
HY
A
Q
Q
n.p.
B
n.p.
n.p.
n.p.
n.p.
n.p.
A
(red covers)
Sub-themes Titles Frequency
1. Nomenclature
2. Community trade, general
1. GEONOMENCLATURE
1. ANALYTICAL TABLES OF EXTER NAL TRADE NIMEXE — Exports (13 volumes)
ANALYTICAL TABLES OF EXTER NAL TRADE NIMEXE — Imports (13 volumes)
2. ANALYTICAL TABLES OF EXTER NAL TRADE CTCI — Exports
(6 volumes)
ANALYTICAL TABLES OF EXTER NAL TRADE CTCI — Imports
(6 volumes)
3. NIMEXE — EXTERNAL TRADE STATISTICS Countries-products SCE 2112 (microfiches)
4. CTCI — EXTERNAL TRADE STAT ISTICS Countries-products SCE 2311 (microfiches)
5. NIMEXE - EXTERNAL STATISTICS Products-countries SCE 1111/1112 (microfiches)
6. CTCI — EXTERNAL TRADE STAT ISTICS Products-countries SCE 1311/ 1312 (microfiches)
7. NIMEXE — EXTERNAL TRADE STATISTICS Products-countries SCE 1118/1119 (microfiches)
8. NIMEXE — EXTERNAL TRADE STATISTICS Products-countries SCE 2119 (microfiches)
9. EXTERNAL TRADE
UCTS (microfiches) ECSC
PROD-A
A
10. MONTHLY
BULLETIN EXTERNAL TRADE A
3. Transport 1. STATISTICAL YEARBOOK TRANS PORT, COMMUNICATIONS, TOUR ISM
2. CARRIAGE OF GOODS
4. Trade with developing 1. YEARBOOK OF EXTERNAL TRADE
countries STATISTICS
2. YEARBOOK OF EXTERNAL TRADE INDICES
3. TRADE: ANALYSIS OF THE EC TRADE
4. TRADE: ANALYSIS OF THE EC TRADE
n.p.
Β
n.p.
n.p.
Theme 9 — Miscellaneous
(brown covers)
Sub-themes Titles Frequency
1. Miscellaneous statistics 1. GOVERNMENT FINANCING OF RE SEARCH AND DEVELOPMENT
2. Miscellaneous
information 1. EUROSTAT NEWS
2. STATISTICAL NEWS AND GRAPHS
Q
It will be realized that Cronos can provide answers to practically every macroeconomic query at the level of the individual countries. However, users requiring data at regional level must consult the Regio data bank. The latter contains information on the main aspects of the economic life of the various regions of the EC Member States. The re-gional breakdown into three different levels is based on a special nomenclature (NUTS). At the first level there are 54 Community regions (e.g. Yorkshire and Humberside in the United Kingdom) while the third level comprises 742 regions (e.g. counties in the United King-dom).
The data in Regio relate to population struc-ture, employment, economic accounts, agri-cultural production and industrial structure. The data are stored in tabular form and are normally available from 1970 or 1975; apart from unemployment statistics (monthly), the periodicity of all these data is annual.
The following are a few typical queries that can be answered with the help of Regio:
(i) Are comparable statistics on the struc-ture and age of the population, unem-ployment trends and productivity avail-able for the regions of Bavaria, Brittany, Scotland and Lombardy? (See Table 2.) (ii) How is energy production distributed
over the territory of the European Com-munity (coal mines, oil refineries, nu-clear power stations, etc.)?
(iii) What is the relative importance of the various transport networks (road, rail, waterway) for goods transport in the East Midlands and the South-West? (iv) Which regions are affected by a reform
[image:31.459.33.407.330.460.2]of the Community's agricultural policy? Where are the Community's dairy cow herds concentrated? What is the trend of agricultural production and yields in the various regions (e.g. for wheat or sugar beet)?
Table 2 : Key regional indicators
Bavaria Brittany Lombardy Scotland
Source: Eurostat — Area Total Wood
land (1000 ha) 7 055 2 751 2 385 7 878 2 374 314 472 917 Regio. Population < 25 Total
(1000) 3 761 1 330 3 125 1963 10 928 2 689 8 945 5 150 Population density (in h./km2
155 98 375 65 Birth rate (%) 10.7 14.7 9.4 13.4 Unemployment rate (%) 3.0 8.1 5.1 12.7
Like regional policy, external trade plays an important role in the relations between the EC Member States (e.g. in tariff nego-tiations). Hence the existence at Eurostat of a considerable volume of relevant data, stored in the Comext data bank. Comext contains the statistics of external trade between the EC Member States and of their trade with some 200 non-member countries. These trade data are broken down on the basis of the European nomenclature (Nimexe) into 7 500 different
goods. Export and import data are given in each case in ECU (European currency units), in tonnes and in specific units of measure-ment (e.g. litres, single items, pairs, etc.).