A Short Gamma-ray Burst
'no-host' Problem? Investigating
Large Progenitor Offsets for Short
Grbs with Optical Afterglows
The Harvard community has made this
article openly available.
Please share
how
this access benefits you. Your story matters
Citation
Berger, E. 2010. “A SHORT GAMMA-RAY BURST
‘NO-HOST’ PROBLEM? INVESTIGATING LARGE PROGENITOR
OFFSETS FOR SHORT GRBs WITH OPTICAL AFTERGLOWS.”
The Astrophysical Journal 722 (2): 1946–61. https://
doi.org/10.1088/0004-637x/722/2/1946.
Citable link
http://nrs.harvard.edu/urn-3:HUL.InstRepos:41397414
Terms of Use
This article was downloaded from Harvard University’s DASH
repository, and is made available under the terms and conditions
applicable to Other Posted Material, as set forth at
http://
C
2010. The American Astronomical Society. All rights reserved. Printed in the U.S.A.
A SHORT GAMMA-RAY BURST “NO-HOST” PROBLEM? INVESTIGATING LARGE PROGENITOR OFFSETS
FOR SHORT GRBs WITH OPTICAL AFTERGLOWS
E. Berger
Harvard-Smithsonian Center for Astrophysics, 60 Garden Street, Cambridge, MA 02138, USA
Received 2010 June 29; accepted 2010 August 27; published 2010 October 5
ABSTRACT
We investigate the afterglow properties and large-scale environments of several short-duration gamma-ray bursts (GRBs) with subarcsecond optical afterglow positions but no bright coincident host galaxies. The purpose of this joint study is to robustly assess the possibility of significant offsets, a hallmark of the compact object binary merger model. Five such events exist in the current sample of 20 short bursts with optical afterglows, and we find that their optical, X-ray, andγ-ray emission are systematically fainter. These differences may be due to lower circumburst densities (by about an order of magnitude), to higher redshifts (by Δz≈ 0.5–1), or to lower energies (by about a factor of 3), although in the standard GRB model the smaller γ-ray fluences cannot be explained by lower densities. To study the large-scale environments, we use deep optical observations to place limits on underlying hosts and to determine probabilities of chance coincidence for galaxies near each burst. In four of the five cases, the lowest probabilities of chance coincidence (P(< δR)∼0.1) are associated with bright galaxies at separations of δR ∼ 10, while somewhat higher probabilities of chance coincidence are associated with faint galaxies at separations of∼2. By measuring redshifts for the brighter galaxies in three cases (z=0.111,0.473,0.403), we find physical offsets of≈30–75 kpc, while for the faint hosts the assumption ofz1 leads to offsets of∼15 kpc. Alternatively, the limits at the burst positions (26 mag) can be explained by typical short GRB host galaxies (L ≈0.1–1L∗) atz2–3. Thus, two possibilities exist: (1)∼1/4 of short GRBs explode∼50 kpc or∼15 kpc from the centers ofz∼0.3 orz1 galaxies, respectively, and have fainter afterglows due to the resulting lower densities; or (2)∼1/4 of short GRBs occur atz2 and have fainter afterglows due to their higher redshifts. The high-redshift scenario leads to a bimodal redshift distribution, with peaks atz∼0.5 andz∼3. The large offset scenario leads to an offset distribution that is well matched by theoretical predictions of NS–NS/NS–BH binary kicks, or by a hybrid population with globular cluster NS–NS binaries at large offsets and primordial binaries at offsets of 10 kpc (indicative of negligible kicks). Deeper constraints on any coincident galaxies to28 mag (using theHubble Space Telescope) will allow us to better exclude the high-redshift scenario.
Key words: gamma-ray burst: general Online-only material:color figures
1. INTRODUCTION
The bimodality of gamma-ray burst (GRB) durations (Kouveliotou et al.1993) is indicative of separate progenitor populations for long- and short-duration GRBs. While direct observational support exists for the massive star origin of long GRBs (e.g., Woosley & Bloom2006), the most popular pro-genitor model for short GRBs is the coalescence of compact object binaries with neutron star and/or black hole constituents (NS–NS/NS–BH; Eichler et al.1989; Paczynski1991; Narayan et al.1992). One of the key predictions of this model is that some systems will experience large velocity kicks at birth, leading to eventual mergers well outside of the host galaxies, in galactic halos and the intergalactic medium (IGM; Bloom et al.1999; Fryer et al.1999; Belczynski et al.2006). These models predict that 10%–20% of all mergers will occur at offsets of20 kpc for Milky Way mass galaxies. In such environments, the result-ing afterglow emission is expected to be fainter than for bursts occurring in coincidence with their host galaxies due to the low ambient density (Panaitescu et al.2001; Perna & Belczynski
2002).
A subset of NS–NS binaries (∼10%–30%) may be formed dynamically in globular clusters (Grindlay et al.2006), leading to possible large offsets and low ambient densities despite an absence of kicks. The distribution of offsets for such binary systems can in principle be calculated from the spatial distribution of globular clusters, and initial predictions are
that 60%–95% of these systems will have offsets of 20 kpc (depending on the mass of the galaxy; Salvaterra et al.2010). An additional expectation is that dynamically formed binaries will be heavily skewed to lower redshifts due to the additional time delay between the formation and core collapse of the globular clusters (Hopman et al.2006; Salvaterra et al.2008).
Other progenitor systems for short GRBs have also been proposed, including young magnetars (Thompson & Duncan
1995), accretion-induced collapse (AIC) of neutron stars (NSs; Qin et al.1998), and delayed magnetar formation through binary white dwarf mergers or white dwarf AIC (Levan et al.2006a; Metzger et al.2008). These models are partially motivated by observations that cannot be easily accommodated in the standard NS–NS merger model, such as extended soft γ-ray emission on timescales of∼100 s (e.g., Villasenor et al.2005; Metzger et al.2008; Perley et al.2009), or by phenomena such as short-duration giant flares from softγ-ray repeaters (e.g., Hurley et al.
2005; Palmer et al.2005; Tanvir et al.2005; Nakar et al.2006). The general expectation is that these alternative progenitors will not experience kicks, and will therefore lead to bursts coinciding with host galaxies.
The detection of short GRB afterglows starting in mid-2005 provided an opportunity to investigate the various progenitor models through a range of observational tests: the redshift distribution (Berger et al.2007; Gal-Yam et al.2008), the host galaxy demographics (Berger 2009), the afterglow properties (Berger2007; Gehrels et al.2008; Kann et al.2008; Nysewander
et al. 2009), and perhaps most importantly, their locations relative to the host galaxies (Fong et al.2010). As of mid-2010, X-ray and optical afterglows have been detected from 40 and 20 short GRBs, respectively, with the latter sample providing accurate subarcsecond positions. Of these 20 events, 15 directly coincide with host galaxies with a wide distribution of apparent magnitudes, and redshifts ofz≈0.2–1 or beyond (e.g., Berger et al.2007; Berger2009; D’Avanzo et al.2009). However, the remaining five events1do not appear to coincide with galaxies, and therefore provide an opportunity to assess the possibility of large progenitor offsets, and to test the validity of the NS–NS merger models.
Significant offsets have been claimed previously, in particular for GRBs 050509b and 060502b with projected offsets of 39±13 and 73±19 kpc, respectively (Bloom et al.2006,2007). However, in both cases only X-ray positions are available (3.5 and 4.4 radius, respectively), and the error circles contain several galaxies consistent with a negligible offset (Berger et al.2007; Bloom et al.2007). Moreover, in the case of GRB 050509b the X-ray error circle intersected the outer regions of the host, raising the possibility that the progenitor system was formed in, rather than kicked to, the outskirts of the host. This possibility raises a crucial point, namely, that a substantial physical offset from the center of the host does not necessarily point to a progenitor kick if the burst still closely coincides with the host light distribution (Fong et al. 2010). An illustrative example of this point is GRB 071227 whose optical afterglow position coincides with the outskirts of edge-on disk galaxies, with an offset of about 15 kpc from the host center (D’Avanzo et al.
2009; Fong et al.2010).
Large offsets have also been speculated in a few cases with precise optical afterglow positions (GRBs 061201, 070809, and 080503; Stratta et al.2007; Perley et al.2008,2009). However, these claims have not been investigated systematically, mainly because they were treated on a case-by-case basis, with proba-bilistic arguments that prevented conclusive associations. These cases, combined with the ambiguity inherent to X-ray positions, demonstrate that bursts with optical afterglows are essential for reaching any robust conclusions about progenitor offsets (due to kicks and/or a globular cluster origin).
Here, we present the first systematic study of short GRBs with optical afterglows and no coincident hosts, which combines their afterglow properties with the large-scale environments. The purpose of this study is to statistically assess the possibility of offsets and to compare this with alternative explanations (e.g., a high-redshift origin). To achieve this goal, we set our study in the broader context of short GRBs that have optical afterglows and coincident hosts, as well as short GRBs with only X-ray positions. As we demonstrate throughout the paper, such a combined study is essential since offsets or high redshifts are expected to jointly affect both the afterglow properties and the large-scale environments. Our study also provides a robust statistical assessment of a posteriori chance coincidence probabilities, and the expected number of spurious associations, which cannot be properly assessed for individual bursts.
The paper is organized as follows. In Section2, we present deep optical observations of the environments of GRBs 061201, 070809, 080503, 090305, and 090515, as well as spectroscopic observations of bright galaxies near the burst positions for GRBs
1 These are GRBs 061201: Berger (2006a), Stratta et al. (2007), and Fong et al. (2010); 070809: Perley et al. (2007,2008); 080503: Perley et al. (2009); 090305: Cenko et al. (2009) and Berger & Kelson (2009); and 090515: Rowlinson et al. (2010b).
061201, 070809, and 090515. We study trends in the afterglow and prompt emission properties of bursts with and without coin-cident hosts in Section3, and determine a posteriori probabilities of chance coincidence as a function of projected angular offset for galaxies near the position of each burst in Section4. We also determine projected physical and host-normalized offsets, and use these in conjunction with the afterglow and prompt emission properties to address two scenarios for the short bursts with optical emission and no coincident bright hosts: (1) an ori-gin in faint galaxies atz 2 (Section4.2), or (2) substantial offsets from galaxies at z ∼ 0.1–0.5 or z 1 (Section4.3). Finally, in Section 5 we present the offset distribution of all short GRBs with optical afterglows (in the context of scenario (2)), and compare this distribution with predictions for NS–NS kicks and dynamically formed NS–NS binaries. We further in-vestigate whether the circumburst densities that are required for the measured optical magnitudes can be accommodated with a halo or IGM origin. We draw conclusions about the progenitors of short GRBs from our systematic study in Section6.
2. SHORT GRB SAMPLE AND OBSERVATIONS
We include in this investigation all 20 short GRBs with optical afterglow detections as of 2010 June. This is the full subset of events for which subarcsecond positions are available. We stress that this sample represents only about 1/3 of all short GRBs discovered to date, and about 1/2 of the sample with X-ray afterglow detections. Thus, it is not a complete sample of short GRBs, but it is the only subset for which we can investigate the possibility of large offsets with meaningful statistical significance. As we demonstrate in Section5, we do not expect this sample to be strongly biased with respect to circumburst density, at least forn10−5cm−3. The properties
of the 20 short GRBs, as well as events with deep optical limits, are summarized in Table1. As can be inferred from the table, some of the 20 events with only X-ray detections do not have optical follow-up observations, suggesting that the sample with optical afterglows may be largely representative.
For the purpose of our investigation, we define three sub-samples that will be used throughout the paper: (1) Sample 1: short GRBs with detected afterglows and coincident host galaxies (15 bursts), (2) Sample 2: the five short bursts with detected optical afterglows and no bright coincident hosts, and (3)Sample 3: short GRBs with detected X-ray afterglows (from the Swift X-ray Telescope (XRT)) but no optical detections despite rapid follow-up observations (13 bursts).
2.1. Optical Imaging
Table 1
Properties of Short GRBs with Optical Afterglows or Limits
GRB T90 za Fγb tX FXc topt Fν,opt Refs.
(s) (erg cm−2) (hr) (erg cm−2s−1) (hr) (μJy)
Short GRBs with optical detections (Samples 1and2)
050709 0.07 0.161 2.9×10⁻⁷ 60.5 3.5×10⁻¹⁵ 34 2.3 1–3
050724 3.0 0.257 3.9×10⁻⁷ 11.8 1.7×10⁻¹² 12 8.4 4–6
051221A 1.4 0.546 1.2×10⁻⁶ 3.1 1.8×10⁻¹² 3.1 5.8 7–8
060121 2.0 <4.3 4.7×10⁻⁶ 6.1 1.8×10⁻¹² 7.4 8.8 9–11
060313 0.70 <3 1.1×10⁻⁶ 2.8 4.0×10⁻¹² 2.8 10.8 11–12
061006 0.42 0.438 1.4×10⁻⁶ 19.5 1.0×10⁻¹³ 14.9 2.9 11,13
061201d 0.80 <1.7, 0.111? 3.3×10⁻⁷ 8.6 2.5×10⁻¹³ 8.6 2.9 14–15
070707 1.1 <4.3 1.4×10⁻⁶ 12.5 2.3×10⁻¹³ 11 1.9 16
070714B 3.0 0.923 7.2×10⁻⁷ 24.4 1.5×10⁻¹⁴ 23.6 0.7 17
070724 0.40 0.457 3.0×10⁻⁸ 2.35 5.5×10⁻¹³ 2.3 5.0 18–19
070809d 1.3 <3, 0.473? 1.0×10⁻⁷ 11.0 3.0×10⁻¹³ 11 0.8 20–21
071227 1.8 0.381 2.2×10⁻⁷ 7.0 6.9×10⁻¹⁴ 7.0 1.6 13
080503d 0.32 <3, · · · 6.1×10⁻⁸ 66.0 <7.8×10⁻¹⁴ 25.9 0.3 22
080905 1.0 0.122 1.4×10⁻⁷ 18.4 <5.9×10⁻¹⁴ 8.5 0.8 23
090305d 0.40 <4.3, · · · 7.5×10⁻⁸ 0.45 <8.5×10⁻¹⁴ 0.45 1.5 24–25
090426 1.28 2.609 2.5×10⁻⁷ 2.0 1.1×10⁻¹² 2.6 20.0 26–27
090510 0.30 0.903 3.4×10⁻⁷ 6.4 1.7×10⁻¹³ 9.0 2.3 28
090515d 0.04 <4.3, 0.403? 2.1×10⁻⁸ 4.9 <9.2×10⁻¹⁴ 1.9 0.1 29
091109B 0.30 · · · 1.9×10⁻⁷ 3.8 1.9×10⁻¹³ 5.7 0.5 30
100117 0.30 0.92 9.3×10⁻⁸ 8.4 <2.0×10⁻¹⁴ 8.4 0.3 31
Short GRBs with optical limits (Sample 3)
050509B 0.04 0.225 9.5×10⁻⁹ 9.1 <2.0×10⁻¹⁴ 2.1 <0.7 32–33
050813 0.60 · · · 1.2×10⁻⁷ 94.9 <2.6×10⁻¹⁴ 12.8 <1.9 34–36
051210 1.27 · · · 8.1×10⁻⁸ 6.9 <2.9×10⁻¹⁴ 19.2 <1.6 11,37
060502B 0.09 · · · 4.0×10⁻⁸ 18.6 <9.1×10⁻¹⁴ 16.8 <0.7 11,38
060801 0.50 1.130 8.1×10⁻⁸ 10.9 <9.0×10⁻¹⁵ 12.4 <0.8 11
061210 0.19 0.409 1.1×10⁻⁶ 72.4 <6.7×10⁻¹⁴ 2.1 <1.4 11
061217 0.21 0.827 4.6×10⁻⁸ 38.6 <1.7×10⁻¹⁴ 2.8 <2.0 11
070429B 0.50 0.902 6.3×10⁻⁸ 11.8 <3.8×10⁻¹⁴ 4.8 <0.6 39
080426 1.30 · · · 3.7×10⁻⁷ 6.1 2.9×10⁻¹³ 7.5 <2.6 40
080702 0.50 · · · 3.6×10⁻⁸ 2.9 <4.0×10⁻¹⁴ 12.1 <12.3 41
081226 0.40 · · · 9.9×10⁻⁸ 3.2 <2.9×10⁻¹⁴ 1.6 <0.9 42
090621B 0.14 · · · 7.0×10⁻⁸ 1.9 1.4×10⁻¹⁴ 0.9 <3.3 43
100206 0.12 · · · 1.4×10⁻⁷ 6.9 <2.0×10⁻¹⁴ 15.7 <0.5 44
Notes.Prompt emission and afterglow data for short GRBs with detected optical afterglows (top section) and deep optical afterglow limits (bottom section).
aRedshifts include spectroscopic measurements, limits from afterglow detections in the UV/optical, and for the bursts inSample 2, redshifts for galaxies with the lowest probability of chance coincidence (marked by “?”).
bThe fluences are in the observed 15–150 keV band, with the exception of GRB 050709 (2–400 keV) and GRB 060121 (2–400 keV).
cAll XRT data are from Evans et al. (2007) and Evans et al. (2009). dShort GRBs inSample 2.
References.(1) Villasenor et al.2005; (2) Fox et al.2005; (3) Hjorth et al.2005; (4) Barthelmy et al.2005; (5) Berger et al.2005; (6) Grupe et al.2006; (7) Burrows et al.2006; (8) Soderberg et al.2006; (9) de Ugarte Postigo et al.2006; (10) Levan et al.2006b; (11) Berger et al.
2007; (12) Roming et al.2006; (13) D’Avanzo et al.2009; (14) Stratta et al.2007; (15) Fong et al.2010; (16) Piranomonte et al.2008; (17) Graham et al.2009; (18) Berger et al.2009; (19) Kocevski et al.2010; (20) Perley et al.2007; (21) Perley et al.2008; (22) Perley et al.
2009; (23) Rowlinson et al.2010a; (24) Cenko et al.2009; (25) Berger & Kelson2009; (26) Antonelli et al.2009; (27) Levesque et al.2010; (28) McBreen et al.2010; (29) Rowlinson et al.2010b; (30) Malesani et al.2009; (31) W. Fong et al. 2011, in preparation; (32) Gehrels et al.
2005; (33) Bloom et al.2006; (34) Ferrero et al.2007; (35) Berger2006b; (36) Prochaska et al.2006; (37) La Parola et al.2006; (38) Bloom et al.2007; (39) Cenko et al.2008; (40) de Ugarte Postigo et al.2008; (41) Greco et al.2008; (42) Berger et al.2008; (43) Galeev et al.2009; (44) Berger et al.2010.
by Perley et al. (2009), with mAB(F606W) 28.5 mag. For
GRB 090305, we use LDSS3r-band observations obtained on 2010 May 8 UT with a total exposure time of 2400 s. Finally, for GRB 090515 we user-band observations obtained with the Gemini Multi-Object Spectrograph (GMOS) mounted on the Gemini-North 8 m telescope from 2009 May 15 UT with a total exposure time of 1800 s.
The ground-based observations were reduced and analyzed using standard routines in IRAF. The analysis of the HST
observations is detailed in Fong et al. (2010). The limiting magnitudes for all five observations are listed in Table2, and images of the five fields are shown in Figures1–5.
2.2. Optical Spectroscopy
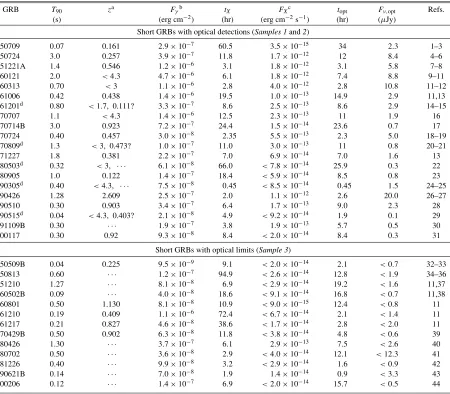
Figure 1.HST/ACS/F814W image of the location of GRB 061201. Galaxies near the position of the optical afterglow (cross-hairs) are marked.
(A color version of this figure is available in the online journal.)
located 16.3 from the afterglow position of GRB 061201 (marked “S4” in Figure 1) revealed a star-forming galaxy at z=0.111 (Stratta et al.2007; Fong et al.2010); see Figure6.
For GRB 070809, we obtained spectra of two galaxies located 5.9 and 6.0 from the optical afterglow position (marked “S2” and “S3,” respectively, in Figure 2) using LDSS3 on 2008 January 14 UT. The galaxy at a separation of 5.9 was previously identified as a star-forming galaxy atz=0.218 by Perley et al. (2008). Here, we find that the object at a separation of 6.0 is an early-type galaxy atz=0.473, with no evidence for ongoing star formation activity (Figure7).
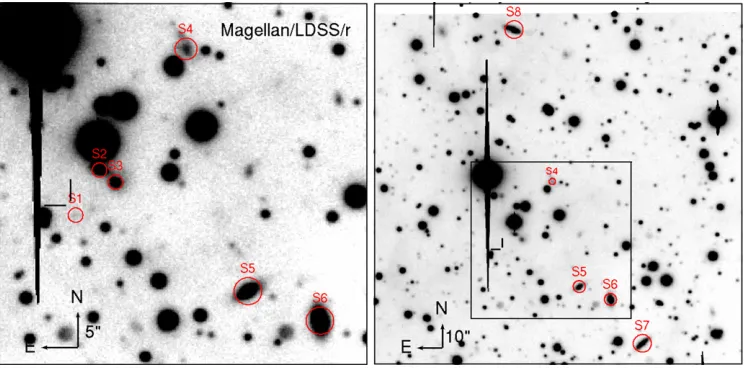
[image:5.612.59.279.53.267.2]Finally, for GRB 090515 we obtained multi-object spectro-scopic observations with LDSS3 for nearly 100 galaxies within a 5×5field centered on the GRB position. These observations provide redshifts for several galaxies near the host position, in-cluding a star-forming galaxy atz=0.626 (5.8 offset; “S1” in Figure5), an early-type galaxy atz=0.403 (14.0 offset; “S5”), and a star-forming galaxy atz=0.657 (14.9 offset; “S6”); see
Table 2
Observations of Short GRBs with Optical Afterglows and no Coincident Host Galaxies (Sample 2)
GRB Instrument Filter texp mlima
(s) (AB mag)
061201 HST/ACS F814W 2224 26.0
070809 Magellan/LDSS3 r 1500 25.4
080503 HST/WFPC2 F606W 4000 28.5b
090305 Magellan/LDSS3 r 2400 25.6
090515 Gemini-N/GMOS r 1800 26.5
Notes.
aLimits are 3σ.
bThis limit is from Perley et al. (2009).
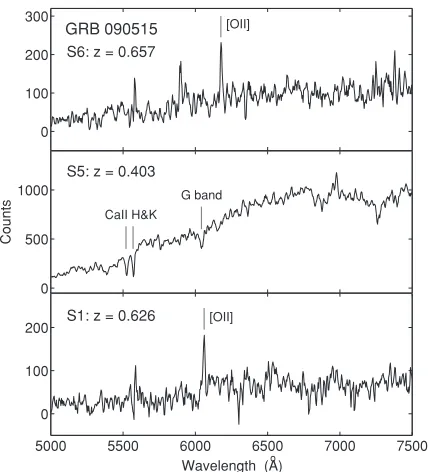
Figure8. In an upcoming paper, we will demonstrate that the galaxy atz=0.403 is a member of a cluster.
3. AFTERGLOW PROPERTIES
We begin our investigation by assessing the distribution of optical afterglow magnitudes for the three samples defined in Section 2. The observed magnitudes and limits as a function of time after the burst are shown in Figure 9. The median observation time for the sample is about 8.5 hr after the burst. The distribution of detected optical afterglow magnitudes is broad, ranging fromrAB ≈ 21 to≈26 mag. The limits range
fromrAB23 to25 mag (with the exception of GRB 080702
which only has a shallow limit of about 21 AB mag; Greco et al.
2008).
The mean brightness and standard deviation forSample 1are2
rAB =23.0±1.3 mag. This is substantially fainter, by about
an order of magnitude, than the afterglows of long GRBs on a comparable timescale (e.g., Kann et al.2008,2010). It is also remarkably similar to the prediction ofR≈23 mag att ≈10 hr by Panaitescu et al. (2001). Since the available limits are at least 23 mag, we conclude that the bursts lacking optical detections are drawn from a population with fainter afterglows. For the five bursts inSample 2, we find a median and standard deviation of
2 These numbers remain essentially unchanged if we extrapolate all
measured magnitudes to the fiducial time of 8.5 hr with a typical afterglow decay index ofα= −0.75.
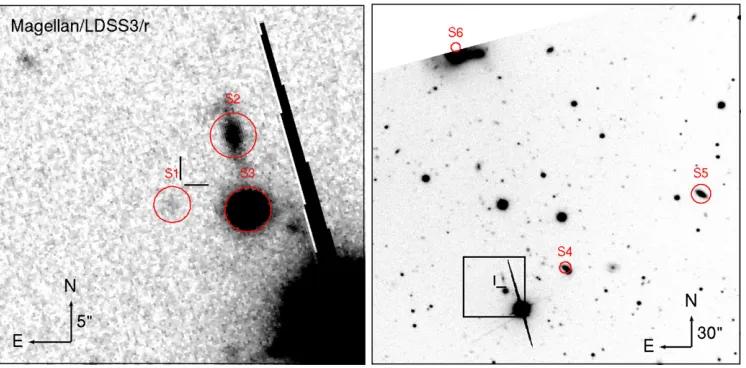
[image:5.612.317.568.86.166.2] [image:5.612.122.495.542.726.2]Figure 3.HST/WFPC2/F606W image of the location of GRB 080503. Galaxies near the position of the optical afterglow (cross-hairs) are marked. A faint galaxy at a separation of only 0.8 was found by Perley et al. (2009) based on a deeper
stack ofHST/WFPC2 observations. These authors also find that the galaxy
marked “S5” is located atz=0.561, leading to a physical offset of 85 kpc. (A color version of this figure is available in the online journal.)
rAB =24.4±1.4 mag, about 1.4 mag fainter than the bursts
with coincident hosts.
The cumulative distributions for the three samples normalized to the fiducial time of 8.5 hr after the burst are shown in Figure 10. A Kolmogorov–Smirnov (K-S) test indicates that there is only an 8% probability that Sample 1 and Sample 2 are drawn from the same underlying distribution of optical afterglow brightnesses. Similarly, the probability thatSample 1 andSample 3are drawn from the same underlying distribution is5% (an upper limit since the bursts in Sample 3 are not detected in the optical). On the other hand, the probability that Sample 2andSample 3are drawn from the same underlying distribution is high,≈50%.
The overall faintness of the optical afterglows inSample 2and Sample 3can be explained in two primary ways. First, they could result from systematically lower circumburst densities. In the
standard afterglow model3withν
m < νopt < νc, the afterglow flux scales asFν∝n1/2for a uniform medium (Sari et al.1998). Thus, a difference of about +1.4 mag can be explained with a density that is about an order of magnitude lower than for the bursts inSample 1.
Alternatively, the fainter fluxes may be due to higher redshifts for Sample 2 and Sample 3 compared to Sample 1 since the optical flux also scales asFν ∝(1 +z)(3+p)/4d−2
L , wheredLis
the luminosity distance. The +1.4 mag difference corresponds toΔz ≈ +0.5 (+1) for aSample 1mean redshift of z = 0.5 (z = 1). Similarly, the flux also depends on the total energy, withFν ∝E(3+p)/4, and therefore a difference of +1.4 mag can
be explained with an energy release lower by about a factor of 3.
The various scenarios (lower density, lower energy, or higher redshift) can be further explored through a comparison of the promptγ-ray emission, and the relation between the optical and X-ray afterglow brightness. In the framework of the standard GRB model, we do not expect lower densities to impact the prompt emission since it is expected to be produced by internal processes (shocks or magnetic dissipation) that do not depend on the external medium. On the other hand, lower energies or higher redshifts will tend to systematically affect the prompt and afterglow emission.
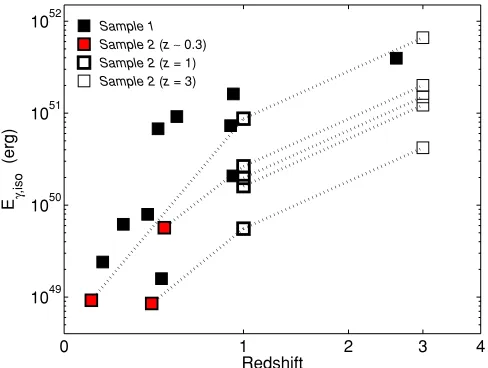
In Figure11, we plot the distributions ofγ-ray fluence (Fγ), afterglow X-ray flux at the fiducial time of 8 hr (FX,8), and
duration (T90) for the three samples. For the latter, we only use the duration of the short component when extended soft emission is also detected. This provides a comparison of the key feature that designates the bursts as short. The distributions allow us to explore the underlying reason for the difference in optical afterglow brightness between the three samples. First, we find that the distribution of theFγ values forSample 1has a mean value that is about a factor of 5 times larger than for Sample 2andSample 3. This is indicative of higher redshifts for the latter two samples if the isotropic-equivalent energies of all short GRBs are similar, or alternatively a lower energy scale if the redshifts are similar.
3 We use the standard synchrotron spectrum definitions:ν
mis the
characteristic synchrotron frequency corresponding to electrons with the minimum Lorentz factor (γm) of the electron distribution,N(γ)∝γ−p;p
usually has a value of≈2.2–2.5; andνcis the synchrotron cooling frequency
[image:6.612.121.493.542.726.2](Sari et al.1998).
Figure 5.Gemini-North/GMOSr-band images of the location of GRB 090515. Galaxies near the position of the optical afterglow (cross-hairs) are marked. Note that the object coincident with the cross-hairs is the optical afterglow.
(A color version of this figure is available in the online journal.)
5500 6000 6500 7000 7500
0 2 4 6 8 10
12 GRB 061201
z = 0.111
o o
Wavelength (A)
Flux (10
−17
erg/cm
2 /s/A)
[OIII] Hβ
Hα [NII]
[image:7.612.337.552.285.521.2][SII]
Figure 6.Magellan/LDSS3 spectrum of the galaxy with the lowest probability of chance coincidence near the position of GRB 061201. This galaxy is marked “S4” in Figure1. It has a redshift ofz=0.111 and it is undergoing active star formation (Berger2006a; Stratta et al.2007; Fong et al.2010).
5500 6000 6500 7000 7500 8000 8500 9000 0
0.5 1 1.5 2 2.5
GRB 070809 z = 0.473
Flux (10
−17
erg/cm
2/s/A)
Wavelength (A)o
o
CaII H&K [OII]
G band
Na I
5400 5500 5600 0.4
0.6 0.8
1 [OII]
Figure 7.Magellan/LDSS3 spectrum of the galaxy with the lowest probability of chance coincidence near the position of GRB 070809. This galaxy is marked “S3” in Figure2. It has a redshift ofz=0.473 and is an early-type galaxy with no evidence for ongoing star formation activity (see inset).
In the same vein, we find that the distributions of theFX,8
values forSample 2andSample 3have lower means than for
5000 5500 6000 6500 7000 7500
0 100 200
Wavelength (A)o [OII]
S1: z = 0.626 0
500 1000
Counts
CaII H&K G band
S5: z = 0.403 0
100 200
300 [OII]
[image:7.612.64.280.288.456.2]GRB 090515 S6: z = 0.657
Figure 8.Magellan/LDSS3 spectra of three galaxies with a low probability of chance coincidence near the position of GRB 090515. The galaxy with the lowest probability of chance coincidence is marked “S5” in Figure5. It has a redshift ofz = 0.403 and is an early-type galaxy which is part of a galaxy cluster (W. Fong et al. 2011, in preparation).
Sample 1. This result is indicative of overall fainter afterglow emission for the former two samples, and this can again be explained in the context of lower energies or higher redshifts. Unlike in the case of theγ-ray emission, a lower circumburst density would also account for the fainter X-ray fluxes if νX < νc. Finally, we find that the durations of the bursts in Sample 2 and Sample 3 are shorter by about a factor of 2 compared to the events with optical afterglows and coincident hosts, although there is substantial scatter in all three samples. The shorter durations are not trivially explained in the context of lower energies, higher redshifts, or lower densities.
[image:7.612.63.273.512.676.2]100 101
21
22
23
24
25
26
Sample 1 Sample 2 Sample 3
050709
050724
051221
060121
060313
061006
061201
070707
070714b
070724
070809
071227
080503
080905
090305
090426
090510
090515
091109b
100117
050509b
050813
051210
060502b
060801
061210
061217
070429b
080426
081226
090621b
100206
t−1/2
t−1
Optical AB Magnitude
Time after the burst (hrs)
0 2 4 6 8 10
[image:8.612.150.464.52.290.2]Number
Figure 9.Optical afterglow brightness on timescales of a few hours after the burst for short GRBs with detected afterglows (Sample 1: black squares;Sample 2: red squares) or upper limits (gray triangles). The lines at the top right indicate the fading tracks for afterglow decay rates ofα= −0.5 and−1. The right panel shows the projected histogram for the bursts with detected afterglows (hatched) and upper limits (open). The symbols mark the mean for each sample, and the vertical bar marks the standard deviation forSample 1.
(A color version of this figure is available in the online journal.)
28 27 26 25 24 23 22 21 0
0.1 0.2 0.3 0.4 0.5 0.6 0.7 0.8 0.9 1
Sample 1
Sample 2 (KS=0.08)
Sample 3 (KS=0.05)
Optical AB Magnitude at t=8 hr
Cumulative Fraction
Figure 10. Cumulative afterglow brightness distributions for the bursts in Figure9, extrapolated to a common fiducial time of 8 hr after the burst with a fading rate ofα= −0.75. The K-S probabilities relative to the sample with detected afterglows and coincident hosts are noted in the figure. It appears unlikely that the bursts with no coincident hosts, and those with deep upper limits, are drawn from the same distribution as the bursts with detected hosts. (A color version of this figure is available in the online journal.)
correlation between the two quantities, but that the events in Sample 1 appear to have larger fluences at a given duration compared to the events in Sample 2 and Sample 3. This is indicative of lower γ-ray fluxes for the latter two samples, possibly as a result of higher redshifts. Higher redshifts will also shift the intrinsic durations of the bursts inSample 2and Sample 3into better agreement with the bursts inSample 1.
We therefore conclude that the differences in prompt emission and optical/X-ray afterglow properties are consistent with a higher redshift origin for the bursts inSample 2 andSample 3. The fainter afterglow emission is also consistent with lower density environments for these two samples, although this does
not clearly explain the differences in prompt emission (at least in the framework of the standard GRB model). We return to the discussion of low density versus a high-redshift origin in Section4when we investigate the host galaxy properties.
In addition to the overall faintness of the optical and X-ray afterglows, a substantial difference in density may also be imprinted on theratioof optical to X-ray brightness. This is be-cause the synchrotron cooling frequency depends on density as νc∝n−1, and is therefore expected to transition across the X-ray band as the density decreases. Forνc> νX, the X-ray and opti-cal bands occupy the same portion of the synchrotron spectrum, with a resulting spectral index ofβ = −(p−1)/2 ≈ −0.6 to
≈−0.75 while forνc< νX(i.e., high density), the spectrum be-tween the two bands will be steeper, reaching a maximum value of≈−1.25 whenνc≈νopt. In Figure13, we plot the X-ray flux
versus optical magnitude for all three samples. For each burst, the fluxes in the optical and X-rays are taken at similar times af-ter the burst, or extrapolated to a common time. The correction factors due these extrapolations are generally4 2 (Table 1). For the combinedSample 1andSample 2, we find a clear cor-relation between the fluxes in the two bands, leading to a mean optical to X-ray spectral index ofβOX = −0.72±0.17. This is essentially indistinguishable from the ratio for long GRBs,
βOX = −0.65±0.35 (Jakobsson et al. 2004). The median
values are consistent withνc νX, but exhibit dispersion that is likely due to scatter in the values ofpand/or the location of νcrelative to the X-ray band.
The similarity of βOX for long and short GRBs does not
necessarily indicate that the densities are similar for the two samples. In particular, ifνcis located close to the X-ray band for long GRBs, while for short GRBsνcνX(due to a lower
density), the effect onβOXwill be marginal, particularly within
the overall observed scatter. For example, with p = 2.5 the difference inβOXbetween a model withνcexactly intermediate
[image:8.612.62.276.362.528.2]−8.50 −8 −7.5 −7 −6.5 −6 −5.5 −5 2
4 6
8 Sample 1
Sample 2 Sample 3
Number
log [Fγ] (erg/cm2)
−150 −14.5 −14 −13.5 −13 −12.5 −12 −11.5 −11
2 4 6
Number
log [FX,8] (erg/s/cm2)
−1.5 −1 −0.5 0 0.5
0 2 4 6
Number
[image:9.612.321.567.54.240.2]log [T90] (s)
Figure 11.Histograms ofγ-ray fluence (top), afterglow X-ray flux at 8 hr (middle), and duration (bottom) for the three short GRB samples discussed in this paper. Unhatched regions mark upper limits. The arrows mark the mean for
each sample, indicating that the bursts inSample 2andSample 3have lower
γ-ray fluences, fainter X-ray fluxes, and shorter durations, than the bursts with detected afterglows and coincident hosts.
(A color version of this figure is available in the online journal.)
10−1 100 10−8
10−7 10−6 10−5 10−4
Sample 1 Sample 2 Sample 3
T90 (s)
Fγ
(erg/cm
[image:9.612.46.291.55.387.2]2 )
Figure 12.Short GRBγ-ray fluence as a function of duration for the three
samples discussed in this paper. The filled symbols mark theγ-ray fluences
measured bySwift in the 15–150 keV energy range, while open symbols
connected by dotted lines indicate fluences measured by other satellites with a broader energy range (e.g.,Konus-Wind,Fermi). An overall correlation is apparent in the data. The bursts inSample 2andSample 3appear to lie below the mean correlation for the bursts inSample 1, i.e., they have lower fluences for their durations, or longer durations for their fluences.
(A color version of this figure is available in the online journal.)
26 25 24 23 22 21
10−14
10−13
10−12
Short:βOX = −0.72 ± 0.17 Long:βOX = −0.65 ± 0.35
Optical AB Magnitude
F X
(erg cm
[image:9.612.63.278.491.659.2]−2 s −1 )
Figure 13.X-ray vs. optical flux for the bursts from Figure9. The cross-hatched region marks the median and standard deviation assuming the expected
power-law correlation with an indexβOX. The light shaded region marks the region
occupied by long GRBs (Jakobsson et al.2004). The distributions for long and short GRBs are largely indistinguishable, as are the distributions for short GRBs with and without coincident hosts. We note that a large fraction of the bursts with optical upper limits also have undetected X-ray afterglows on timescales of a few hours after the burst. The overall similarity between the ratio of optical to X-ray flux for long and short GRBs does not allow us to clearly locate the synchrotron cooling frequency (νc) in relation to the X-ray band. Ifνc> nuXfor
short GRBs, the faintness of the optical afterglows for bursts with no coincident hosts cannot be used to distinguish density and redshift effects.
(A color version of this figure is available in the online journal.)
between the optical and X-ray bands and a model withνc> νX
isΔβOX ≈0.25. On the other hand, the scatter resulting from
a range of p = 2.2–2.5 is of the same order,ΔβOX = 0.15. Similarly, the nearly equivalent medianβOXvalues may indicate
that for both GRB populationsνc> νX. In this case, the resulting
lower limits onνctherefore prevent the use ofβOXas an indicator
of density.
Comparing Sample 1 andSample 2, we find no clear dif-ference inβOX(Figure13). The same is true for the bursts in
Sample 3, which are all consistent with the same relation given the optical upper limits and a mix of X-ray detections and upper limits. Thus, the ratio of optical to X-ray flux does not allow us to distinguish redshift/energy and density effects between the three samples.
To summarize, the optical afterglows of short GRB without coincident hosts (or with only optical limits) are systematically fainter than those of short GRBs with coincident hosts. The same is true for their X-ray fluxes and γ-ray fluences. The fainter afterglows may reflect lower densities (by an order of magnitude), but this does not naturally explain the lowerγ-ray fluences. Alternatively, the fainter afterglows andγ-ray fluences can be explained as a result of higher redshifts (Δz≈0.5–1) or lower energies (by about a factor of 3).
4. LARGE-SCALE ENVIRONMENTS
We next turn to an analysis of the large-scale environments of the bursts in Sample 2, partly in comparison to the hosts of bursts in Sample 1. As indicated in Section 2, we place limits ofrAB≈25.4–28.5 mag on the brightness of any galaxy
underlying the five short GRB positions (Table2; see Perley et al.
10−2 10−1 100
061201 070809
10−2 10−1 100
080503
Probability, P(<
δ
R)
100 101 102
090305
100 101 102
10−2 10−1 100
090515
[image:10.612.324.564.52.240.2]δR = Distance from GRB (arcsec)
Figure 14.Probability of chance coincidence as a function of distance from a short GRB optical afterglow position for galaxies near the location of each burst. These are the galaxies marked in Figures1–5. In each panel, we mark the galaxy with the lowest probability of chance detection with a circle. In four of the five cases, the lowest probability is associated with galaxies that are offset by∼5–15. Moreover, even the nearest galaxies are offset by≈1.6–5.8.
4.1. Probabilities of Chance Coincidence
To assess the potential that galaxies near each of the five bursts are the hosts, we calculate their probability of chance coincidence. We follow the methodology of Bloom et al. (2002), namely, we determine the expected number density of galaxies brighter than a measured magnitude,m, using the results of deep optical galaxy surveys (Hogg et al.1997; Beckwith et al.2006):
σ(m)= 1
0.33×ln(10)×10
0.33(m−24)−2.44 arcsec−2. (1)
The probability for a given separation,P(< δR), is then given by
P(< δR)=1−e−π(δR)2σ(m), (2)
where we use the fact that for offsets substantially larger than the galaxy size,δR is the appropriate radius in Equation (2) (Bloom et al.2002).
The resulting distributions for each field are shown in Figure 14. We include all galaxies that have probabilities of 0.95. We find that for four of the five bursts, faint galaxies (∼25–26 mag) can be identified within ≈1.6–2of the after-glow positions, with associated chance coincidence probabilities of≈0.1–0.2; in the case of GRB 090515, we do not detect any such faint galaxies within≈5of the afterglow position. For GRB 080503, we also include the galaxy at an offset of 0.8 andmAB(F606W)=27.3±0.2 mag identified by Perley et al.
(2009) based on their deeper stack ofHSTobservations. On the other hand, for four of the five bursts we find that the galaxies with the lowest probability of chance coincidence,≈0.03–0.15, are brighter objects with offsets of about 6–16from the burst
100 101 102
10−2
10−1
100
070707
δR = Distance from GRB (arcsec)
Probability, P(<
δ
R)
10−2
10−1
100
060121
100 101 102
060313
Figure 15.Same as Figure14, but for short GRBs with coincident faint hosts. In this case, the lowest probability of chance coincidence is associated with the underlying faint host.
positions; only in the case of GRB 080503 is the lowest chance coincidence associated with the nearest galaxy (see Perley et al.
2009).
For comparison, we repeat the same analysis for short GRBs fromSample 1which have faint coincident hosts (GRB 060121: 26.0 AB mag; GRB 060313: 26.6 AB mag; and GRB 070707: 27.3 AB mag). The results of the probability analysis are shown in Figure 15. We find that in all three cases, the coincident hosts exhibit the lowest probability of chance coincidence,
≈0.02–0.05. Only in the case of GRB 070707 do we find galaxies with δR few arcsec that have P(< δR) 0.1. Thus, these three bursts are consistent with negligible offsets from faint galaxies, presumably atz1.
The use of a posteriori probabilities to assignuniquegalaxy associations is fraught with difficulties. First, for a given apparent brightness, galaxies located further away from the GRB position, potentially due to larger kicks and/or longer merger timescales in the NS–NS merger framework, have higher probabilities of chance coincidence. Since we have no a priori model-independent knowledge of the range of possible kicks and merger timescales, we cannot rule out galaxies at very large offsets for whichP(< δR)∼1. Indeed, a reasonable constraint ofvkick103km s−1andτmerger 10 Gyr leads to only a weak
constraint on the offset of10 Mpc. Atz=0.1 (z=1), this corresponds to about 1◦.5 (0◦.3), a projected distance at which nearly all galaxies will have a chance coincidence probability of order unity.
[image:10.612.48.294.52.334.2]δR 1(which atz=0.043 for this galaxy corresponds to a physical offset of about 100 kpc).
A final complication, which is not unique to this sub-set of events, is that we can only measure projected off-sets, δR = δR3D × cos(θ). The measured offsets can be
used as lower limits on the actual offsets, while for the over-all distribution we can apply an average correction factor of π/2, based on the expectation value for the projection factor, cos(θ).
Despite these caveats, we can address the probability that all of the associations are spurious. This joint probability is simply the product of the individual probabilities (Bloom et al.
2002). For the faint galaxies at small angular separations the probability that all are spurious associations isPall≈8×10⁻⁵,
while for the galaxies with the lowest probability of chance coincidence the joint probability is nearly 30 times lower, Pall ≈ 3×10⁻⁶. Conversely, the probabilities that none of
the associations are spurious are ≈0.42 and ≈0.59, respec-tively. These values indicate that some spurious coincidences may be present forSample 2. Indeed, the probabilities that 1, 2, or 3 associations are spurious are [0.40,0.15,0.027] and [0.34,0.068,0.006], respectively. These results indicate that for the faint galaxies it is not unlikely that 2–3 associations (out of 5) are spurious, while for the brighter galaxies 1–2 associations may be spurious. This analysis clearly demon-strates why a joint statistical study is superior to case-by-case attempts to associate short GRBs with galaxies at substantial offsets.
We therefore conclude that despite the weaknesses inherent to a posteriori probabilities, we conclude that there is stronger statistical support for an association of at least some of the five bursts inSample 2with bright galaxies at separations of∼10, than for an association with the faint galaxies at separations of ∼2. Clearly, we cannot rule out the possibility that in reality the hosts are a mix of faint and bright galaxies with a range of angular offsets of 2. We note that if deeper observations eventually lead to the detection of underlying galaxies (0.5) at the level of≈27 mag, the associated chance coincidence probabilities will be≈0.05 per object, and the joint probabilities will be only slightly higher than for the bright galaxies with∼10offsets. On the other hand, if we can achieve magnitude limits of 28 mag on any coincident hosts, the resulting probabilities of chance coincidence will be larger than for the offset bright galaxies. Thus, eliminating the possibility of underlying hosts at the level of28 mag is of the utmost importance. So far, only GRB 080503 has been observed to such a depth with no detected coincident host (Perley et al.2009), but observations of the full sample are required for a robust statistical comparison. As we discuss in Section4.2, such deep limits will also reduce the probability of underlying hosts based on redshift arguments.
Beyond the use of projected angular offsets, we note that the faint galaxies near the burst positions are likely to have projected physical offsets of about 15 kpc.5 To assess the projected physical offsets for the galaxies with the lowest probability of chance coincidence, we measured spectroscopic redshifts in three cases (GRBs 061201, 070809, and 090515; Section2). In the case of GRB 061201, the galaxy redshift ofz=0.111 leads to a projected physical offset of 32.4 kpc (Fong et al. 2010). In the case of GRB 070809, the lowest probability of chance
5 Although the redshifts of these galaxies are not known, the angular diameter distance is nearly independent of redshift beyondz∼1, which is appropriate for these faint host galaxies.
coincidence is not associated with the star-forming galaxy6 at
z=0.218 identified by Perley et al. (2008), but instead belongs to the early-type galaxy identified here, which has a redshift of z = 0.473, and hence an offset of 34.8 kpc. Finally, for GRB 090515, the lowest probability of chance coincidence is associated with a cluster early-type galaxy atz=0.403, leading to a physical offset of 75 kpc.
Thus, two scenarios emerge from our investigation of the large-scale environments: (1) the bursts are spatially coincident with currently undetected galaxies (with rAB 26 mag), or (2) the bursts have substantial offsets of at least ≈15–75 kpc depending on whether they are associated with faint galaxies at small angular separations, or brighter galaxies at z ∼ 0.1–0.5; for the ensemble of five events the larger offsets are statistically more likely than the∼15 kpc offsets. In the context of large offsets, even larger values may be possible if the bursts originated in galaxies with larger separations andP(< δR)∼1. These two scenarios echo the possibilities that emerged from the analysis of the afterglow and prompt emission properties (Section3). Distinguishing between these possibilities is clearly of fundamental importance to our understanding of short GRBs: the former scenario will point to a population of very faint hosts (likely at high redshifts), while the latter scenario will provide evidence for large offsets (due to kicks or a globular cluster origin) and hence NS–NS/NS–BH progenitors for at least some short GRBs.
4.2. Scenario 1: Undetected Faint Hosts at High Redshift
We can place upper limits on the redshifts of the GRBs in Sample 2based on their detections in the optical (i.e., the lack of complete suppression by the Lyαforest). The afterglow of GRB 061201 was detected in the ultraviolet by theSwift/UVOT and it is therefore located atz1.7 (Roming et al.2006). The remaining four bursts were detected in the opticalgorrband, and can therefore be placed atz3 or4.3 (Table1).
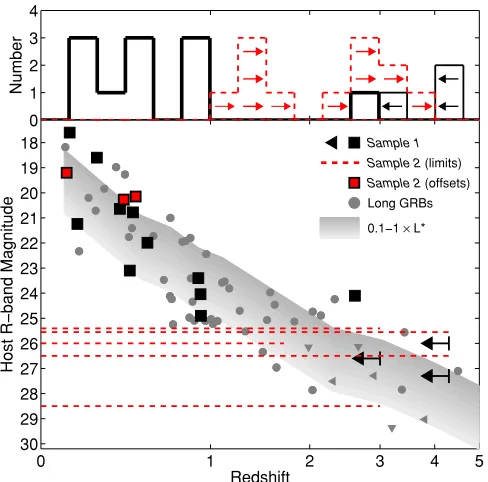
We place additional constraints on the redshifts of any underlying hosts using the existing sample short GRB host galaxies. In Figure 16, we plot the r-band magnitudes as a function of redshift for the all available short GRB hosts from Sample 1. For the faint hosts without known redshifts (GRBs 060121, 060313, and 070707), we place upper limits on the redshift using optical detections of the afterglows (Table 1). A wide range of host magnitudes, rAB ∼ 16.5–27.5 mag, is
apparent. We also plot the r-band magnitudes of long GRB hosts (Savaglio et al.2009), as well as ther−zphase space that is traced by galaxies with luminosities ofL=0.1–1L∗. We use the appropriate value ofL∗as a function of redshift, taking into account the evolving galaxy luminosity function (Steidel et al.
1999; Blanton et al.2003; Willmer et al.2006; Reddy & Steidel
2009). We find excellent correspondence between the hosts of long and short GRBs, and the phase space traced by 0.1–1L∗ galaxies, at least toz∼4. In the context of these distributions, the available limits for the short GRBs inSample 2translate to redshifts of z 1.5 if they are 0.1 L∗ galaxies, orz 3 if they areL∗galaxies. The latter lower limits are comparable to the redshift upper limits inferred from the afterglow detections. We note that for GRB 080503, the limits of 28.5 mag and z3 from the afterglow (Perley et al.2009) place even more stringent limits on the luminosity of an underlying galaxy of 0.1L∗galaxy.
6 We note that even if the burst was associated with this galaxy, the
0 1 2 3 4 5 18
19 20 21 22 23 24 25 26 27 28 29 30
Sample 1 Sample 2 (limits) Sample 2 (offsets) Long GRBs
0.1−1× L*
Redshift
Host R−band Magnitude
0 1 2 3 4
[image:12.612.48.292.55.296.2]Number
Figure 16.Main panel: host galaxy optical magnitude as a function of redshift for short GRB hosts (black squares), long GRB hosts (detections: gray circles; non-detections or no redshifts: gray triangles), and galaxies with a luminosity of 0.1–1L∗(shaded region). The dashed lines mark the upper limits at the GRB positions for the short GRBs with no coincident hosts. The arrows mark the upper limits on the redshifts of three bursts inSample 1with faint hosts, based on the detection of the afterglows in the optical band (i.e., lack of a strong Lyman break). If underlying host galaxies exist forSample 2, their non-detection indicatesz1.5 (for 0.1L∗) or3 (forL∗). The alternative possibility that they are located at similar redshifts to the detected hosts, requires0.01L∗, but this does not naturally explain their fainter afterglows. Upper panel: projected redshift histogram forSample 1(black) andSample 2(dashed red limits) under the assumption that the hosts are 0.1L∗galaxies (z∼ 1.5) andL∗galaxies (z∼3).
(A color version of this figure is available in the online journal.)
The redshifts ofz1.5 for putative 0.1L∗hosts are consis-tent with the faintness of the optical afterglows, from which we inferredΔz≈0.5–1 compared toSample 1(Section3). We note, however, that the one known short GRB atz2 (GRB 090426; Antonelli et al.2009; Levesque et al.2010) has a host galaxy luminosity of∼2L∗, which may suggest that the appropriate redshift lower limits arez3.
The possibility that the five bursts originated atz3 leads to a bimodal redshift distribution (Figure16). Nearly all of the bursts inSample 1with a known redshift (9/10) havez≈0.2–1, with a median ofz ≈0.5; the sole exception is GRB 090426 at z=2.61. The three bursts with faint coincident hosts have upper limits ofz4 from afterglow detections, while lower limits of z1.5–2 can be placed on these hosts if they haveL0.1L∗. Adding theSample 2bursts with the assumption that they have z 3 will furthermore result in a population of short GRBs with a median ofz∼3, and leave a substantial gap atz∼1–2 (Figure 16). If the five bursts are instead hosted by 0.1L∗ galaxies, the inferred lower limits on the redshifts (z 1.5) lead to a potentially more uniform redshift distribution.
It is difficult to explain a bimodal redshift distribution with a single progenitor population such as NS–NS binaries, without appealing to, for example, a bimodal distribution of merger timescales. Another possibility is two distinct progenitor populations, producing bursts of similar observed properties but with distinct redshift ranges. While these possibilities are
−1 −0.5 0 0.5 1 1.5
0 0.5 1 1.5 2 2.5 3 3.5 4
Sample 1 Sample 2 (z∼ 0.3)
Sample 2 (z∼ 1)
log [δR] (arcsec)
[image:12.612.321.566.55.241.2]Number
Figure 17.Histogram of projected angular offsets relative to the host galaxy center for short GRBs with coincident hosts (hatched black), and bursts with no coincident hosts if the galaxies with lowest chance coincidence probability are the hosts (hatched red), or if the faint galaxies with smallest angular separation are hosts (open red), see Figure14. The dashed line is a log-normal fit to the bursts with coincident hosts.
(A color version of this figure is available in the online journal.)
difficult to exclude, they do not provide a natural explanation for the short GRB population.
A final alternative explanation is that any underlying hosts reside at similar redshifts to the known hosts in Sample 1 (z ∼ 0.5), but have significantly lower luminosities of 0.01 L∗. This scenario would not naturally explain why the bursts in Sample 2 have fainter optical and X-ray afterglows, as well as lower γ-ray fluences. We therefore do not consider this possibility to be the likely explanation.
4.3. Scenario 2: Large Offsets
While higher redshifts may explain the lack of detected hosts, the fainter afterglows, and the weaker γ-ray fluences of the bursts in Sample 2, this scenario suffers from several difficulties outlined above. The alternative explanation is that the bursts occurred at significant offsets relative to their hosts, and hence in lower density environments that would explain the faint afterglow emission (though possibly not the lowerγ-ray fluences). As we demonstrated in Section4.1, the offsets may be∼2(∼15 kpc) if the bursts originated in the faint galaxies at the smallest angular separations, or∼10(∼30–75 kpc) if they originated in the brighter galaxies with the lowest probability of chance coincidence. Below we address the implications of these two possible offset groups through a comparison to the offsets measured for the bursts inSample 1(e.g., Fong et al.2010).
We plot the distributions of projected angular offsets for the short GRBs with and without coincident hosts in Figure 17. The offsets forSample 1have a mean and standard deviation of about 0.7±0.7 and a range of about 0.1–3. Modeled with a log-normal distribution, the resulting mean and width in units of arcseconds are log(δR) ≈ −0.2 andσlog(δR) ≈0.35. If we
−0.5 0 0.5 1 0
1 2 3 4
5 Sample 1
Sample 2 (z∼ 0.3)
Sample 2 (z∼ 1)
Number
[image:13.612.48.294.54.247.2]log [δR / Re]
Figure 18.Same as Figure17but normalized relative to the host effective radii,
Re. The dashed line is a log-normal fit to the bursts with coincident hosts. (A color version of this figure is available in the online journal.)
As noted in Section 4.1, the projected angular distances may not be the most robust quantity for measuring the offset distribution. An alternative quantity is the offset normalized by each host’s effective radius (Fong et al. 2010). This quantity takes into account the varying sizes of the hosts due to both intrinsic size variations and redshift effects. It also gives a better indication of whether the burst coincides with the host light or is significantly offset. As shown in Figure 18, the host-normalized offsets ofSample 1have a mean and standard deviation of about 1±0.6Re, and a range of about 0.2–2Re.
A log-normal fit results in a mean of log(δR/Re) ≈ 0 and a width ofσlog(δR/Re) ≈0.2. The bursts inSample 2 have much larger host-normalized offsets, with (δR/Re)=7.3±2.3 if they originated in the galaxies with the lowest chance coincidence probability. Even if we associate the bursts with the nearest faint hosts, the distribution has a mean of about 4Re, reflecting the
fact that the effective radii of the faint galaxies are smaller than those of the brighter ones.
Finally, we plot the projected physical offsets in Figure19. The mean and standard deviation for Sample 1 are δR = 4.2 ± 3.8 kpc, and a log-normal fit results in a mean of log(δR) ≈ 0.5 and a width of σlog(δR) ≈ 0.3. On the other
hand, the bursts inSample 2have a mean offset of about 19 kpc if they arise in the faint galaxies with small angular separation, or about 40 kpc if they arise in the brighter galaxies, again pointing to distinct distributions.
The distributions of angular, physical, and host-normalized offsets exhibit a clear bimodality if we associate the bursts in Sample 2with the galaxies atz∼0.1–0.5. This is particularly apparent in the more meaningful quantities, namely, physical and host-normalized offsets (Figures18and19). The effect is still apparent, though less pronounced, in the case of association with the faint galaxies atz1. Thus, if the offset scenario is correct, the resulting distributions point to a possible bimodality rather than a single continuous distribution of offsets.
The cumulative distributions of physical offsets forSample 1 alone, and in conjunction with the two possible offset groups for Sample 2, are shown in Figure20. The combined distributions have a median of about 4 kpc, driven by the bursts with coincident hosts. However, there is a clear extension to larger physical offsets in the case of association with the brighter
−0.5 0 0.5 1 1.5 2
0 0.5 1 1.5 2 2.5 3 3.5 4
Sample 1 Sample 2 (z∼ 0.3)
Sample 2 (z∼ 1)
log [δR] (kpc)
Number
Figure 19.Same as Figure17but projected physical offsets in units of kpc. The dashed line is a log-normal fit to the bursts with coincident hosts.
(A color version of this figure is available in the online journal.)
100 101 102
0 0.2 0.4 0.6 0.8 1
Sample 1
Sample 1+2 (z∼ 0.3)
Sample 1+2 (z∼ 1)
Sample 2 (z∼ 0.3)
NS−NS: Bloom et al. 1999 NS−NS: Fryer et al. 1999 NS−NS: Belczynski et al. 2006 GCs: Salvaterra et al. 2010
δR (kpc)
[image:13.612.320.568.56.246.2]Cumulative Fraction
Figure 20.Cumulative distributions of projected physical offsets for short GRBs with coincident hosts (black line), and combined with offsets for the hosts with the lowest probabilities of chance coincidence (thick red line) or the faint hosts with smallest angular offsets (thin red line). Also shown are predicted
distributions for NS–NS kicks from several models (Bloom et al.1999; Fryer
et al.1999; Belczynski et al.2006), and for dynamically formed NS–NS binaries from globular clusters (shaded region marks a range of predictions for host galaxy masses of 5×10¹⁰–1012M
; Salvaterra et al.2010). The models with kick velocities are in good agreement with the measured offset distribution for either set of galaxy associations, while the globular clusters model provides a poor match to the data.
(A color version of this figure is available in the online journal.)
galaxies, with about 20% of all objects havingδR30 kpc. The cumulative distributions are particularly useful for comparison with NS–NS merger models since predictions exist for both the kick scenario and the globular cluster origin model. We turn to this discussion below.
5. DISCUSSION AND IMPLICATIONS
[image:13.612.322.563.294.486.2]