Journal of Geophysical Research: Space Physics
BRIEF REPORT
10.1002/2014JA019939Key Points:
• Chorus wave distributions as a func-tion of Ae and solar wind parameters • Chorus waves and acceleration and
loss of radiation belt electrons • Upper band and lower band chorus
wave emission
Correspondence to:
H. Aryan,
Citation:
Aryan, H., K. Yearby, M. Balikhin, O. Agapitov, V. Krasnoselskikh, and R. Boynton (2014), Statistical study of chorus wave distributions in the inner magnetosphere usingAeand solar wind parameters,J. Geophys. Res. Space Physics,119, 6131–6144, doi:10.1002/2014JA019939.
Received 3 MAR 2014 Accepted 23 JUL 2014
Accepted article online 28 JUL 2014 Published online 18 AUG 2014
This is an open access article under the terms of the Creative Commons Attribution License, which permits use, distribution and reproduction in any medium, provided the original work is properly cited.
Statistical study of chorus wave distributions in the inner
magnetosphere using
Ae
and solar wind parameters
Homayon Aryan1, Keith Yearby1, Michael Balikhin1, Oleksiy Agapitov2,3, Vladimir Krasnoselskikh4, and Richard Boynton1
1Department of Automatic Control and Systems Engineering, University of Sheffield, Sheffield, UK,2Space Sciences
Laboratory, University of California, Berkeley, California, USA,3Astronomy and Space Physics Department, Taras Shevchenko National, University of Kiev, Kiev, Ukraine,4LC2E/CNRS, University of Orléans, Orleans, France
Abstract
Energetic electrons within the Earth’s radiation belts represent a serious hazard to geostationary satellites. The interactions of electrons with chorus waves play an important role in both the acceleration and loss of radiation belt electrons. The common approach is to present model wave distributions in the inner magnetosphere under different values of geomagnetic activity as expressed by the geomagnetic indices. However, it has been shown that only around 50% of geomagnetic storms increase flux of relativistic electrons at geostationary orbit while 20% causes a decrease and the remaining 30% has relatively no effect. This emphasizes the importance of including solar wind parameters such as bulkvelocity (V), density (n), flow pressure (P), and the vertical interplanetary magnetic field component (Bz)
that are known to be predominately effective in the control of high energy fluxes at the geostationary orbit. Therefore, in the present study the set of parameters of the wave distributions is expanded to include the solar wind parameters in addition to the geomagnetic activity. The present study examines almost 4 years (1 January 2004 to 29 September 2007) of Spatio-Temporal Analysis of Field Fluctuation data from Double Star TC1 combined with geomagnetic indices and solar wind parameters from OMNI database in order to present a comprehensive model of wave magnetic field intensities for the chorus waves as a
function of magnetic local time, L shell (L), magnetic latitude (𝜆m), geomagnetic activity, and solar wind
parameters. Generally, the results indicate that the intensity of chorus emission is not only dependent upon geomagnetic activity but also dependent on solar wind parameters with velocity and southward
interplanetary magnetic fieldBs(Bz<0), evidently the most influential solar wind parameters. The largest
peak chorus intensities in the order of 50 pT are observed during active conditions, high solar wind
velocities, low solar wind densities, high pressures, and highBs. The average chorus intensities are more
extensive and stronger for lower band chorus than the corresponding upper band chorus.
1. Introduction
Energetic electrons in the space environment represent a serious hazard to geostationary satellites that are increasingly used for communication, navigation, Earth observation, and defense. The impact of such rel-ativistic electrons on satellites can range from single event upsets, which are followed by full recovery, to
permanent failure of individual subsystems, or even complete loss of the satellite [Blake et al., 1992;Fennell
et al., 2001]. Energetic electrons are mainly trapped within the Earth’s inner (1.1<L<2) and outer (3<L<7) radiation belts which are separated by what is known as the slot region. The inner radiation belt is
rela-tively stable and only varies during intense geomagnetic storms [Li et al., 1999;Millan and Thorne, 2007].
However, the outer radiation belt is highly dynamic and the flux of energetic electrons can vary by several
orders of magnitude during geomagnetic storms and other disturbances [Craven, 1966;Blake et al., 1992;
Baker et al., 1994;Reeves et al., 2003;Baker and Kanekal, 2008;Tu et al., 2009]. The interaction of
gyroreso-nant particles with chorus waves largely determines the dynamics of the Earth’s radiation belts [Meredith
et al., 2002;Thorne et al., 2005;Xiao et al., 2009, 2010] that affects the acceleration and loss of radiation
belt electrons [Bortnik and Thorne, 2007;Li et al., 2007;Shprits et al., 2009;Artemyev et al., 2013;Thorne et
al., 2013;Baker et al., 2014]. Meanwhile, the slot region between the inner and the outer radiation belt is
widely accepted to have formed as a result of energetic electron loss due to pitch angle scattering by very
low frequency waves such as plasmaspheric hiss [Lyons et al., 1972] and magnetosonic waves [Mourenas et
Figure 1.The (a) equatorial(|𝜆m|<15◦)lower band, (b) equatorial upper band, (c) midlatitude(15◦≤|𝜆m|≤40◦) lower band, and (d) midlatitude upper band average chorus intensities as a function ofL, MLT, and geomagnetic activity during (left column) quiet, (middle column) moderate, and (right column) active conditions.
2009] which is also accountable for the decay of energetic electrons in the outer radiation belt during
relatively quiet times [Summers et al., 2007].
Chorus emissions are very intense right-hand polarized electromagnetic whistler mode waves that are
excited naturally in the low-density region near the geomagnetic equator outside the plasmapause [Burtis
and Helliwell, 1969;LeDocq et al., 1998;Lauben et al., 2002;Santol´ık et al., 2005;Li et al., 2011], and they are
observed in two separate frequency bands: the lower band (0.1fce<f< 0.5fce) and the upper band
(0.5fce< f <fce) [Helliwell, 1967;Tsurutani and Smith, 1974;Agapitov et al., 2013] wherefceis the electron cyclotron frequency. The common approach is to present model wave distributions in the inner
magneto-sphere under different values of geomagnetic activity as expressed by the geomagnetic indices (KpandAe)
[Li et al., 2011;Meredith et al., 2012;Agapitov et al., 2012, 2013]. It has been shown that chorus wave emission
is dependent on geomagnetic activity with peak intensities observed during active conditions.Meredith
et al.[2012] concluded that the largest chorus wave intensities were observed with equatorial lower band
chorus between 2300 and 1200 magnetic local time (MLT). However,Reeves et al.[2003] examined 276
Journal of Geophysical Research: Space Physics
10.1002/2014JA019939
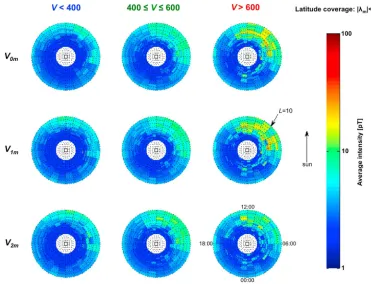
Figure 2.Average chorus intensities as a function ofL, MLT, andVfor (left column) slow, (middle column) moderate, and (right column) fast solar wind velocities. Results are shown for maximum solar wind velocity observed on (top row) current day (V0m), (middle row) previous day (V1m), and (bottom row) 2 days ago (V2m).
electron fluxes at the geostationary orbit [Onsager et al., 2007;Ohtani et al., 2009;Balikhin et al., 2011;
Matsumura et al., 2011;Reeves et al., 2011, 2013]. Recently,Boynton et al.[2013] applied the NARMAX
(Nonlinear Autoregressive Moving Average modelling) algorithm [Balikhin et al., 2010, 2011] to show the
importance of solar wind parameters that control the flux of energetic electrons at geostationary orbit and identified solar wind velocity as the most influential parameter. Therefore, in the present study the set of parameters of the wave distributions are expanded to include solar wind parameters, such as bulk velocity,
density, flow pressure, and the vertical interplanetary magnetic field component (Bz), in addition to
geo-magnetic activity. This study analyze almost 4 years (1 January 2004 to 29 September 2007) of Double Star TC1 Spatio-Temporal Analysis of Field Fluctuation (STAFF) and OMNI data in order to present the wave
mag-netic field intensities for the lower and upper band chorus waves as a function of MLT,𝜆m,L, geomagnetic
index (Ae), and solar wind parameters (velocity,V, density,n, pressure,P, and the vertical interplanetary
magnetic field component (Bz)).
2. Description of the Data Set
Double Star was lunched on 29 December 2003 as a joint mission by the European Space Agency, ESA, and China National Space Administration. The equatorial satellite, TC1, operates in an elliptical orbit with a perigee of 562 km and an apogee of 78,970 km. The STAFF (Spatio-Temporal Analysis of Field Fluctuation) experiment on board TC1 computes the spectral matrix at 27 different frequencies (between
10 Hz and 4 kHz) with a 1 s resolution using a Digital Wave Processor (DWP) [Cornilleau-Wehrlin et al.,
Table 1.The Kullback-Leibler Distance (DKL) Between Slow and Moderate (DKLsm), Slow and Fast (DKLsf), and Moderate and Fast (DKLmf) Solar Wind Velocities for
V0m,V1m, andV2mas Presented in Figure 2
DKLsm DKLmf DKLsf
V0m 0.0270 0.0395 0.0534
V1m 0.0258 0.0513 0.0635
V2m 0.0298 0.0448 0.0458
the antenna boom. This is done by rejecting spectra acquired when large interference spikes occur and by combining the signals from two axes of the antenna to synthesize a measurement in a direction where continuous interference is least. The optimum direction is adjusted as a function of frequency and spin phase. This study analyzes almost 4 years (1 January 2004 to 29 September 2007) of Double Star TC1
STAFF and OMNI data. The geomagnetic index (Ae) and the solar wind
parameters (V,n, andP) used are 1 h values available online at OMNI
database. The vertical interplanetary magnetic field component (Bz)
used are 1 min values that are also available online at OMNI database.
TheLparameter is binned in linear steps of 0.2L, and the MLT
param-eter is binned in linear steps of 1 h of MLT. The lower and upper band chorus wave intensities are calculated over the frequency ranges (0.1fce<f< 0.5fce) and (0.5fce<f<fce), respectively. The data are only selected in the cases where all of a given frequency band fall within the
fre-quency range; otherwise, the data are rejected. All data are in SI units (Ae(nT),V(km/s),n(n/cc),P(nPa), and
Bz(nT)).
3. Results
3.1. Average Chorus Intensities as a Function of Geomagnetic Activity
The distributions of chorus wave in the inner magnetosphere can be presented under different values of
geomagnetic activity as expressed by the geomagnetic indices. Figure 1 shows the equatorial(|𝜆m|<15◦)
lower band (a), equatorial upper band (b), midlatitude(15◦≤|𝜆m|≤40◦)lower band (c), and midlatitude
upper band (d) average chorus intensities as a function ofL, MLT, and geomagnetic activity during quiet
(left), moderate (middle), and active (right) conditions. Results show that both the equatorial (Figure 1b) and midlatitude (Figure 1d) upper band chorus intensities are relatively weak even during active conditions with peak values largely below 10 pT. The peak chorus intensities are mostly confined in the regions from 0500 to 1300 MLT (equatorial) and from 0900 to 1400 MLT (midlatitude) and marginally intensify with increasing geomagnetic activity. On the other hand, the lower band chorus intensities (Figures 1a and 1c) are far more extensive and stronger than the corresponding upper band chorus. The peak lower band chorus intensities rise to 10 pT and 20 pT, primarily from premidnight to the afternoon sector, during quiet and moderate con-ditions, respectively. The largest intensities of the order 50 pT are observed for lower band chorus during
active conditions in the region of 4≤L≤9from 2300 to 1300 MLT (equatorial) and from 0500 to 1400 MLT
(midlatitude). By large, the peak intensities of the midlatitude chorus are similar in magnitude to the corre-sponding equatorial chorus intensities. However, the peak intensities for midlatitude region predominantly occur within a smaller MLT sector than the corresponding equatorial chorus intensities. For example, the peak intensities of midlatitude lower band chorus during active conditions mainly occur from 0500 to 1400 MLT compared to a more extensive spread from 2300 to 1300 MLT seen for equatorial lower band chorus. The results are largely consistent with previous studies that presented model wave distributions in the inner magnetosphere under different values of geomagnetic activity as expressed by the geomagnetic
indices [Meredith et al., 2003;Li et al., 2011;Meredith et al., 2012;Agapitov et al., 2012, 2013]. In particular, the
results here agree with the results ofMeredith et al.[2012] who presented a combined satellite (DE1 (3 years),
CRRES (15 months), Cluster 1 (10 years), Double Star TC1 (1 year), and THEMIS (17 months)) model of the
equatorial and midlatitude wave intensity for the upper and lower band chorus also as a function ofAe.
3.2. Average Chorus Intensities as a Function of Solar Wind Parameters
As mentioned earlier,Reeves et al.[2003] concluded that only 53% of geomagnetic storms increase the flux
of relativistic electrons at geostationary orbit while 19% cause a decrease and the remaining 28 have no significant effect. This emphasizes the importance of including solar wind parameters in addition to geo-magnetic indices in order to better understand the distributions of chorus wave in the magnetosphere. The following sections reveal the average chorus intensities as a function of solar wind velocity, density,
pressure, and interplanetary magnetic field,Bz, respectively.
3.2.1. Average Chorus Intensities as a Function of Velocity
Solar wind parameters are known to be predominately effective in the control of high energy fluxes at
geostationary orbit with solar wind velocity considered as the most influential parameter [Boynton et al.,
Journal of Geophysical Research: Space Physics
10.1002/2014JA019939
Figure 3.The (a) equatorial(|𝜆m|<15◦)lower band, (b) equatorial upper band, (c) midlatitude(15◦≤|𝜆m|≤40◦)
lower band, and (d) midlatitude upper band average chorus intensities as a function ofL, MLT, and maximum solar
wind velocity from previous day (V1m) for (left column) slow, (middle column) moderate, and (right column) fast solar wind velocities.
column), moderate (middle column), and fast (right column) solar wind velocities. It is commonly accepted that temporal changes in solar wind parameters are not immediately observed at the geostationary orbit. In
fact, there is a time delay of approximately 1–2 days depending on the energy [Paulikas and Blake, 1979;Li
et al., 2005;Boynton et al., 2011;Reeves et al., 2011;Aryan et al., 2013]. The interplay between the local accel-eration and outward/inward radial diffusion mainly determines the time delay. While chorus emissions are generated over a wider range, a similar time delay may still apply. Consequently, Figure 2 includes maximum
solar wind velocity from current day (V0m, top row), 1 day (V1m, middle row), and 2 days (V2m, bottom row)
ago (the subscript,∗m, represents maximum value, and the corresponding number indicates days delay).
Results show that the average chorus intensities as a function of solar wind velocity follows a noticeably sim-ilar trend to that of chorus intensities as a function of geomagnetic activity. In this case, the average chorus intensities rise with increasing solar wind velocity in all three cases of delay. However, it is not immediately clear which of the three cases of delay provides the most widespread statistical distribution. Therefore,
the Kullback-Leibler [Kullback and Leibler, 1951;Kullback, 1959] theory was applied in order to identify the
Figure 4.Average chorus intensities as a function ofL, MLT, andnfor (left column) low, (middle column) moderate, and (right column) high solar wind densities. Results are shown for maximum solar wind density observed on (top row) current day (n0m), (middle row) previous day (n1m), and (bottom row) 2 days ago (n2m).
between two probability distributions (e.g.,XandY) given as a number known as the Kullback-Leibler
Distance (DKL) which is essentially the distance ofXfromY, withXandYnormalized, defined by equation (1).
𝐷KL= ∑
i
Xi⋅log2(Xi∕Yi) (1)
ADKLvalue of zero implies that the two probability distributions are identical. The Kullback-Leibler theory
was applied to the results in Figure 2 in the following way: first, calculateDKLbetween slow and moderate
(DKLsm), slow and fast (DKLsf), and moderate and fast (DKLmf) solar wind velocities for each particular cases of
delay; then verify the validity of the distribution for each cases of delay (a distribution is only valid if
DKLsf > DKLsmandDKLsf > DKLmf, i.e., the largest difference is expected between the two extreme
distri-butions; in this case between slow and fast solar wind velocities); finally, the distribution with the highest
value ofDKLsfamongst the valid distributions is selected (larger values ofDKLsuggests broader distribution).
The values ofDKLsm,DKLsf,DKLmfforV0m,V1m, andV2mare presented in Table 1. The results show that all three
cases of delay provide valid distributions. However, the most widespread statistical distribution is observed
Table 2.The Kullback-Leibler Distance (DKL) Between Low and Moderate (DKLlm), Low and High (DKLlh), and Moderate and High (DKLmh) Solar Wind Densities for
n0m,n1m, andn2mas Presented in Figure 4
DKLlm DKLmh DKLlh
n0m 0.0368 0.0307 0.0412
n1m 0.0447 0.0305 0.0500
n2m 0.0583 0.0293 0.0580
with maximum solar wind velocity from previous day (V1m) with the
largestDKLsfvalue of 0.0635.
Figure 3 shows the equatorial(|𝜆m|<15◦)lower band (a), equatorial
upper band (b), midlatitude(15◦≤|𝜆m|≤40◦)lower band (c), and
midlatitude upper band (d) average chorus intensities as a function of
L, MLT, and maximum solar wind velocity from previous day (V1m) for
Journal of Geophysical Research: Space Physics
10.1002/2014JA019939
Figure 5.The (a) equatorial(|𝜆m|<15◦)lower band, (b) equatorial upper band, (c) midlatitude(15◦≤|𝜆m|≤40◦)
lower band, and (d) midlatitude upper band average chorus intensities as a function ofL, MLT, and maximum solar
wind density from previous day (n1m) for (left column) low, (middle column) moderate, and (right column) high solar wind densities.
intensities largely occur within the regions of 0600 to 1200 MLT (equatorial) and 1000 to 1400 MLT (midlat-itude) and rise slightly with increasing velocity. The lower band chorus is more extensive, occurring in the
region 4≤L≤9from 0300 to 1300 MLT (equatorial) and from 0300 to 1300 MLT (midlatitude), and stronger
in compression to the corresponding upper band chorus with peak intensities rising to 15 pT, 20 pT, and 50 pT during slow, moderate, and fast solar wind velocities, respectively. The occurrence of peak lower band chorus intensities during active conditions (Figure 1) is slightly higher than during fast solar wind velocities (Figure 3). The peak intensities of midlatitude chorus are approximately equal in magnitude to the corre-sponding equatorial chorus intensities but mainly occur at smaller MLT sector. The results prove that there is a strong dependency between the intensity of chorus emission and solar wind velocity.
3.2.2. Average Chorus Intensities as a Function of Density
Another important solar wind parameter is density which is known to be influential in the control of high energy fluxes at geostationary orbit where it plays a crucial role in defining the relationship between
ener-getic electron fluxes and solar wind velocity [Aryan et al., 2013]. Figure 4 shows the average wave intensities
as a function ofL, MLT, andnfor low (left column), moderate (middle column), and high (right column) solar
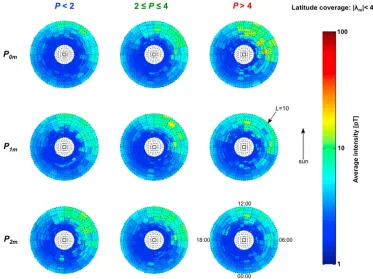
Figure 6.Average chorus intensities as a function ofL, MLT, andPfor (left column) low, (middle column) moderate, and (right column) high pressures. Results are shown for maximum pressure observed on (top row) current day (P0m), (middle row) previous day (P1m), and (bottom row) 2 days ago (P2m).
therefore, the average lower band chorus is shown for maximum density from the current day (n0m, top
row), previous day (n1m, middle row), and 2 days (n2m, bottom row) ago. In contrast to solar wind velocity
(Figure 2), the average chorus intensities decline with increasing solar wind density. The Kullback-Leibler
theory was applied to calculateDKL, between low and moderate (DKLlm), low and high (DKLlh), and moderate
and high (DKLmh) solar wind densities for each particular cases of delay, as shown in Table 2. Here the
dis-tributions ofn0m(top row) andn1m(middle row) are valid. However, the distribution ofn2m(bottom row) is
invalid becauseDKLlm > DKLlh. Amongst the two valid distributions, the most widespread statistical
distri-bution is observed with maximum solar wind density from previous day (n1m) with the largestDKLlhvalue
of 0.0500.
Figure 5 shows the equatorial(|𝜆m|<15◦)lower band (a), equatorial upper band (b), midlatitude
(
15◦≤|𝜆m|≤40◦)lower band (c), and midlatitude upper band (d) average chorus intensities as a
func-tion ofL, MLT, and maximum solar wind density from previous day (n1m) for low (left column), moderate
(middle column), and high (right column) solar wind densities. Again, the upper band chorus intensities are mostly weak with peak values of less than 10 pT. The peak intensities largely occur within the regions of 0600 to 1200 MLT (equatorial) and 1000 to 1400 MLT (midlatitude) and drop slightly with increasing
density. The lower band chorus is more extensive, occurring in the region 4≤L≤9from 0500 to 1100 MLT
Table 3.The Kullback-Leibler Distance (DKL) Between Low and Moderate (DKLlm), Low and High (DKLlh), and Moderate and High (DKLmh) Pressures forP0m,P1m, and
P2mas Presented in Figure 6
DKLlm DKLmh DKLlh
P0m 0.0296 0.0426 0.0517
P1m 0.0349 0.0429 0.0413
P2m 0.0410 0.0327 0.0453
Journal of Geophysical Research: Space Physics
10.1002/2014JA019939
Figure 7.The (a) equatorial(|𝜆m|<15◦)lower band, (b) equatorial upper band, (c) midlatitude(15◦≤|𝜆m|≤40◦) lower band, and (d) midlatitude upper band average chorus intensities as a function ofL, MLT, and maximum current day pressure (P0m) for (left column) low, (middle column) moderate, and (right column) high pressures.
trend to solar wind velocity and geomagnetic activity. Evidently, the results show convincing dependency between the intensity of chorus emission and solar wind density.
3.2.3. Average Chorus Intensities as a Function of Flow Pressure
Flow pressure is a function of velocity and density that is also known to contribute in the control of high energy fluxes at the geostationary orbit. Figure 6 presents the average lower band chorus intensities as a
function ofL, MLT, andPfor low (left column), moderate (middle column), and high (right column)
pres-sures. The results are shown for maximum pressure from the current day (P0m, top row), previous dayP1m,
middle row), and 2 days (P2m, bottom row) ago in order to take into account the time delay introduced by
the magnetospheric system. Similar to solar wind velocity (Figure 1), the average chorus intensities rise with
increasing pressure. The Kullback-Leibler theory was applied to calculateDKL, between low and moderate
(DKLlm), low and high (DKLlh), and moderate and high (DKLmh) pressures for each particular cases of delay,
shown in Table 3. In this case, the most widespread statistical distribution is observed with current day
maximum pressure (P0m, top row) with the largestDKLlhvalu of 0.0517.
Figure 7 shows the equatorial(|𝜆m|<15◦)lower band (a), equatorial upper band (b), midlatitude
(
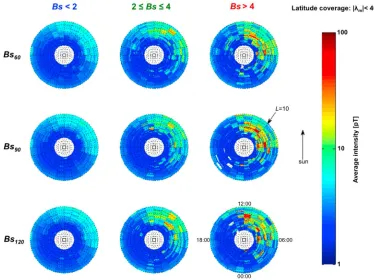
Figure 8.Average chorus intensities as a function ofL, MLT, andBsfor (left column) low, (middle column) moderate, and (right column) highBs. Results are shown forBswith (top row) 60 (Bs60), (middle row) 90 (Bs90), and (bottom row) 120 (Bs120) min of delay.
ofL, MLT, and maximum current day pressure (P0m) for low (left column), moderate (middle column), and
high (right column) pressures. The results show significant similarities to solar wind velocity (Figure 3) and geomagnetic activity (Figure 1) with regards to the intensities of chorus emission. Generally, the average chorus intensities rise with increasing pressure. The average lower band chorus intensities are larger than the corresponding upper band chorus intensities. However, the occurrence of peak lower band chorus intensities during high pressures (Figure 7) is slightly lower than during active conditions (Figure 1) and during fast solar wind velocities (Figure 3). The results prove that the intensity of chorus emission is also dependent upon pressure.
3.2.4. Average Chorus Intensities as a Function of FlowBz
High energy flux enhancement depends not only on the solar wind velocity and density but also on the
ver-tical interplanetary magnetic field component (Bz). The southward interplanetary magnetic field (Bz< 0)
causes large flux enhancement due to strong coupling with the Earth’s geomagnetic field. According to Tsurutani et al.[1989], the southward interplanetary magnetic field is the most geoeffective parameter. While several studies have shown that the dawnside and nightside chorus respond quickly to southward inter-planetary magnetic field, the exact time delay is not known. Therefore, time delays of up to 1440 min (24 h)
at 30 m intervals were studied. In the following analysisBs= −Bzis defined as the strength of the southward
interplanetary magnetic field.Bs<2nT is categorized as low, 2nT<Bs<4nT moderate, andBs>4nT high.
Figure 8 shows the average lower band chorus intensities as a function ofL, MLT, andBsfor low (left column),
moderate (middle column), and high (right column)Bs. The results are shown forBswith 60 (Bs60, top row),
90Bs90, middle row), and 120 (Bs120, bottom row) min of delay. Similar to solar wind velocity (Figure 2), the
average chorus intensities increase with increasingBs. The Kullback-Leibler theory was applied to calculate
DKL, between low and moderate (DKLlm), low and high (DKLlh), and moderate and high (DKLmh)Bsfor each
par-ticular cases of delay, as shown in Table 4. In this case, the only valid statistical distribution is observed with
90 min of delay inBs(Bs90, middle row) with aDKLlhvalue of 0.0766 (Note that the Kullback-Leibler results for
Journal of Geophysical Research: Space Physics
10.1002/2014JA019939
Table 4.The Kullback-Leibler Distance (DKL) Between Low and Moderate (DKLlm), Low and High (DKLlh), and Moderate and High (DKLmh)BsforBs60,Bs90, andBs120as Presented in Figure 8
DKLlm DKLmh DKLlh
Bs60 0.0328 0.0894 0.0825
Bs90 0.0393 0.0667 0.0766
Bs120 0.0339 0.0713 0.0631
Figure 9 shows the equatorial(|𝜆m|<15◦)lower band (a), equatorial
upper band (b), midlatitude(15◦≤|𝜆m|≤40◦)lower band (c), and
midlatitude upper band (d) average chorus intensities as a function
ofL, MLT, andBswith 90 min of delay for low (left column), moderate
(middle column), and high (right column)Bs. The results show
signif-icant similarities to solar wind velocity (Figure 3) and geomagnetic activity (Figure 1) with regards to the intensities of chorus emission.
The average chorus intensities increase with increasingBs. The
aver-age lower band chorus intensities are larger than the corresponding upper band chorus intensities. The upper band chorus intensities are mostly weak with peak values of less than 10 pT. The peak equa-torial lower band chorus intensities are more widely distributed (from premidnight to early afternoon in
the region of 4≤L≤9) compared to the midlatitude lower band chorus (from dawn to afternoon in the
region of 4 ≤ L≤ 9). Also, the peak lower band chorus intensities of 50 pT are more commonly observed
with highBsthan with low solar wind density and high pressure. Overall, results indicate that the intensity
of chorus emission is not only dependent on geomagnetic activity but also dependent on solar wind
velocity, density, pressure, and vertical interplanetary magnetic field component.Bsand solar wind
veloc-ity are evidently the most influential parameters having the largestDKLvalue between the extreme ends of
the distributions (DKLlh =0.0766) and (DKLsf = 0.0635), respectively, followed by pressure (DKLlh= 0.0517)
and density (DKLlh= 0.0500). The results here are in line with previous studies that have also identified
solar wind velocity as highly influential solar wind parameter that control the flux of energetic electrons at geostationary orbit.
4. Discussions and Conclusions
The present study examined almost 4 years (1 January 2004 to 29 September 2007) of STAFF
(Spatio-Temporal Analysis of Field Fluctuation) data from Double Star TC1 and OMNI database. The results are largely comparable with previous studies that presented model wave distributions in the inner
magne-tosphere under different values of geomagnetic activity as expressed by the geomagnetic indices (Kpand
Ae) [Meredith et al., 2003;Li et al., 2011;Meredith et al., 2012;Agapitov et al., 2012, 2013]. In particular, the
results here agree with the results ofMeredith et al.[2012] who used the geomagnetic index,Ae, to study
the distributions of the upper and lower band chorus intensities. However, in the present study the set of parameters of the wave distributions was expanded to include the solar wind parameters (velocity, density,
pressure, andBs) in addition to the geomagnetic activity. The results strongly suggest that the intensity of
chorus emission is not only dependent on geomagnetic activity but also dependent on solar wind param-eters. The strong dependency between the intensity of chorus emission and the solar wind parameters
shown here is not peculiar given the fact that various studies in the past [e.g.,Snyder et al., 1963;Gholipour et
al., 2004;Elliott et al., 2013] identified a high correlation coefficient between geomagnetic indices and solar
wind parameters.
Generally, the average upper band chorus intensities are relatively weak with peak values largely below 10 pT in all cases (chorus intensity as a function of geomagnetic activity, solar wind velocity, density,
pres-sure, andBs). The largest intensities of the order 50 pT are observed for lower band chorus during active
conditions, high solar wind velocities, low solar wind densities, high pressures, and highBscorrespondingly.
Perhaps, the upper band chorus intensities are weaker than the lower band chorus because the
genera-tion of the upper band chorus requires higher anisotropy of resonant electrons [Kennel and Petschek, 1966].
It is known that electron injection and anisotropy depends upon geomagnetic activity and solar wind parameters. The resonant anisotropy and the resonant numbers of electrons largely determine the
cho-rus wave instability [Xiao et al., 1998, 2006]. The natural enhancement of electron anisotropy in the noon
sector may result in high occurrence of dayside chorus at higherL[West et al., 1973] where critical stably
trapped flux levels are low. Electron injection would further enhance wave excitation [Li et al., 2009]. This
could account for the fact that chorus wave activities are associated with geomagnetic activity and also solar wind parameters.
The occurrence of peak lower band chorus intensities are most extensive during active conditions, fast solar
wind velocities, and highBs(from 2300 to 1300 MLT in the region of 4≤L ≤9) but slightly less extensive
during low solar wind densities and high pressures (from 0500 to 1200 MLT in the region of 4≤L≤9). The
peak midlatitude(15◦≤|𝜆m|≤40◦)chorus intensities predominantly occur within smaller MLT slots than
the corresponding equatorial(|𝜆m|<15◦)chorus intensities for both the upper and lower band chorus.
Possibly, this is because Landau damping weakens some of the waves as they propagate to higher latitudes,
where the wave normal angles are more oblique [Li et al., 2010, 2011].
Evidently, the intensity of chorus emission is more dependent on solar wind velocity andBsthan solar wind
density and pressure. Based on the Kullback-Leibler theory, the most widespread distribution was observed
withBs(DKLlh = 0.0766) and solar wind velocity (DKLsf = 0.0635) followed by pressure (DKLlh = 0.0517)
and density (DKLlh = 0.0500). This suggests thatBsand velocity are the most influential solar wind
param-eter that affect the evolution of the magnetospheric chorus wave intensities, consistent with the results of Kim et al.[2013] who presented an empirical model of the global distributions of the magnetospheric cho-rus amplitude using an artificial neural network and utilized the instantaneous measurement of the solar wind parameters as input. However, the present study takes into account the time delay introduced by the magnetospheric system. The results demonstrates that the most widespread statistical distributions are
Journal of Geophysical Research: Space Physics
10.1002/2014JA019939
Studies of the evolution of energetic electron fluxes rely heavily on the numerical codes in order to model energy and pitch angle diffusion due to electron interaction with plasma waves in the frame of quasi-linear approximation. Therefore, including the solar wind parameters in addition to the geomagnetic activity in the statistical wave models will benefit those studies, provide a better representation of the wave dis-tributions in the magnetosphere, and improve our knowledge of the acceleration and loss of radiation belt electrons.
References
Agapitov, O., V. Krasnoselskikh, Y. V. Khotyaintsev, and G. Rolland (2012), Correction to: A statistical study of the propagation characteristics of whistler waves observed by Cluster,Geophys. Res. Lett.,39, L24102, doi:10.1029/2012GL054320.
Agapitov, O., A. Artemyev, V. Krasnoselskikh, Y. V. Khotyaintsev, D. Mourenas, H. Breuillard, M. Balikhin, and G. Rolland (2013), Statistics of whistler mode waves in the outer radiation belt: Cluster STAFF-SA measurements,J. Geophys. Res. Space Physics,118, 3407–3420, doi:10.1002/jgra.50312.
Artemyev, A. V., O. V. Agapitov, D. Mourenas, V. Krasnoselskikh, and L. M. Zelenyi (2013), Storm-induced energization of radiation belt electrons: Effect of wave obliquity,Geophys. Res. Lett.,40, 4138–4143, doi:10.1002/grl.50837.
Aryan, H., R. J. Boynton, and S. N. Walker (2013), Analysis of trends between solar wind velocity and energetic electron fluxes at geostationary orbit using the reverse arrangement test,J. Geophys. Res. Space Physics,118, 636–641, doi:10.1029/2012JA018216. Baker, D. N., and S. G. Kanekal (2008), Solar cycle changes, geomagnetic variations, and energetic particle properties in the inner
magnetosphere,J. Atmos. Sol. Terr. Phys.,70, 195–206, doi:10.1016/j.jastp.2007.08.031.
Baker, D. N., J. B. Blake, L. B. Callis, J. R. Cummings, D. Hovestadt, S. Kanekal, B. Klecker, R. A. Mewaldt, and R. D. Zwickl (1994), Relativis-tic electron acceleration and decay time scales in the inner and outer radiation belts: SAMPEX,Geophys. Res. Lett.,21(6), 409–412, doi:10.1029/93GL03532.
Baker, D. N., et al. (2014), Gradual diffusion and punctuated phase space density enhancements of highly relativistic electrons: Van Allen Probes observations,Geophys. Res. Lett.,41, 1351–1358, doi:10.1002/2013GL058942.
Balikhin, M. A., R. J. Boynton, S. A. Billings, M. Gedalin, N. Ganushkina, D. Coca, and H. Wei (2010), Data based quest for solar wind-magnetosphere coupling function,Geophys. Res. Lett.,37, L24107, doi:10.1029/2010GL045733.
Balikhin, M. A., R. J. Boynton, S. Walker, J. E. Borovsky, S. A. Billings, and H. L. Wei (2011), Using the NARMAX approach to model the evolution of energetic electrons fluxes at geostationary orbit,Geophys. Res. Lett.,38, L18105, doi:10.1029/2011GL048980. Blake, J. B., M. S. Gussenhoven, E. G. Mullen, and R. W. Fillius (1992), Identification of an unexpected space radiation hazard,IEEE Trans.
Nucl. Sci.,39, 1761–1764, doi:10.1109/23.211364.
Bortnik, J., and R. M. Thorne (2007), The dual role of ELF/VLF chorus waves in the acceleration and precipitation of radiation belt electrons,J. Atmos. Sol. Terr. Phys.,69, 378–386, doi:10.1016/j.jastp.2006.05.030.
Bortnik, J., W. Li, R. M. Thorne, V. Angelopoulos, C. Cully, J. Bonnell, O. Le Contel, and A. Roux (2009), An observation linking the origin of plasmaspheric hiss to discrete chorus emissions,Science,324, 775–778, doi:10.1126/science.1171273.
Boynton, R. J., M. A. Balikhin, S. A. Billings, H. L. Wei, and N. Ganushkina (2011), Using the NARMAX OLS-ERR algorithm to obtain the most influential coupling functions that affect the evolution of the magnetosphere,J. Geophys. Res.,116, A05218, doi:10.1029/2010JA015505.
Boynton, R. J., M. A. Balikhin, S. A. Billings, G. D. Reeves, N. Ganushkina, M. Gedalin, O. A. Amariutei, J. E. Borovsky, and S. N. Walker (2013), The analysis of electron fluxes at geosynchronous orbit employing a NARMAX approach,J. Geophys. Res. Space Physics,118, 1500–1513, doi:10.1002/jgra.50192.
Burtis, W. J., and R. A. Helliwell (1969), Banded chorus—A new type of VLF radiation observed in the magnetosphere by OGO 1 and OGO 3,J. Geophys. Res.,74, 3002–3010, doi:10.1029/JA074i011p03002.
Cornilleau-Wehrlin, N., et al. (2005), The STAFF-DWP wave instrument on the DSP equatorial spacecraft: Description and first results,Ann. Geophys.,23, 2785–2801, doi:10.5194/angeo-23-2785-2005.
Craven, J. D. (1966), Temporal variations of electron intensities at low altitudes in the outer radiation zone as observed with satellite Injun 3,J. Geophys. Res.,71, 5643–5663, doi:10.1029/JZ071i023p05643.
Elliott, H. A., J.-M. Jahn, and D. J. McComas (2013), The Kp index and solar wind speed relationship: Insights for improving space weather forecasts,Space Weather,11, 339–349, doi:10.1002/swe.20053.
Fennell, J. F., H. C. Koons, J. L. Roeder, and J. B. Blake (2001), Spacecraft charging: Observations and relationship to satellite anomalies, inSpacecraft Charging Technology, ESA Special Publication, vol. 476, edited by R. A. Harris, 279 pp., European Space Agency, ESA, Noordwijk, Netherlands.
Gholipour, A., C. Lucas, and B. N. Araabi (2004), Black box modeling of magnetospheric dynamics to forecast geomagnetic activity,Space Weather,2, S07001, doi:10.1029/2003SW000039.
Helliwell, R. A. (1967), A theory of discrete VLF emissions from the magnetosphere,J. Geophys. Res.,72, 4773–4790, doi:10.1029/JZ072i019p04773.
Kennel, C. F., and H. E. Petschek (1966), Limit on stably trapped particle fluxes,J. Geophys. Res.,71, 1–28.
Kim, K.-C., Y. Shprits, J. Lee, and J. Hwang (2013), Empirically modeled global distribution of magnetospheric chorus amplitude using an artificial neural network,J. Geophys. Res. Space Physics,118, 6243–6253, doi:10.1002/jgra.50595.
Kullback, S. (1959), Information theory and statistics, inInformation Theory and Statistics, Wiley Series in Probability and Mathematical Statistics, Probability and Mathematical Statistics, pp. 1–256, John Wiley, New York.
Kullback, S., and R. A. Leibler (1951), On information and sufficiency,Ann. Math. Stat.,22, 79–86, doi:10.1214/aoms/1177729694. Lauben, D. S., U. S. Inan, T. F. Bell, and D. A. Gurnett (2002), Source characteristics of ELF/VLF chorus,J. Geophys. Res.,107(A12), 1429,
doi:10.1029/2000JA003019.
LeDocq, M. J., D. A. Gurnett, and G. B. Hospodarsky (1998), Chorus source locations from VLF Poynting flux measurements with the Polar spacecraft,Geophys. Res. Lett.,25, 4063–4066, doi:10.1029/1998GL900071.
Li, W., Y. Y. Shprits, and R. M. Thorne (2007), Dynamic evolution of energetic outer zone electrons due to wave-particle interactions during storms,J. Geophys. Res.,112, A10220, doi:10.1029/2007JA012368.
Li, W., R. M. Thorne, V. Angelopoulos, J. Bortnik, C. M. Cully, Ni. B., O. Le Contel, A. Roux, U. Auster, and W. Magnes (2009), Global distribu-tion of whistler-mode chorus waves observed on the THEMIS spacecraft,Geophys. Res. Lett.,36, L09104, doi:10.1029/2009GL037595.
Acknowledgments
Double Star was a joint mission by the European Space Agency (ESA) and the China National Space Administra-tion. The STAFF and DWP experiments, operations, and data analysis were supported by CNES (France), STFC (UK), and ESA. The OMNI data were obtained from the GSFC/SPDF OMNI-Web interface at http://omniweb. gsfc.nasa.gov. H. Aryan would like to acknowledge financial support from EPSRC. The authors would like to thank the reviewers for their time and valuable comments.
Li, W., et al. (2010), THEMIS analysis of observed equatorial electron distributions responsible for the chorus excitation,J. Geophys. Res.,
115, A00F11, doi:10.1029/2009JA014845.
Li, W., J. Bortnik, R. M. Thorne, and V. Angelopoulos (2011), Global distribution of wave amplitudes and wave normal angles of chorus waves using THEMIS wave observations,J. Geophys. Res.,116, A12205, doi:10.1029/2011JA017035.
Li, X., D. N. Baker, M. Teremin, T. E. Cayton, G. D. Reeves, R. S. Selesnick, J. B. Blake, G. Lu, S. G. Kanekal, and H. J. Singer (1999), Rapid enhancements of relativistic electrons deep in the magnetosphere during the May 15, 1997, magnetic storm,J. Geophys. Res.,104, 4467–4476, doi:10.1029/1998JA900092.
Li, X., D. N. Baker, M. Temerin, G. Reeves, R. Friedel, and C. Shen (2005), Energetic electrons, 50 keV to 6 MeV, at geosynchronous orbit: Their responses to solar wind variations,Space Weather,3, S04001, doi:10.1029/2004SW000105.
Lyons, L. R., R. M. Thorne, and C. F. Kennel (1972), Pitch-angle diffusion of radiation belt electrons within the plasmasphere,J. Geophys. Res.,77, 3455–3474, doi:10.1029/JA077i019p03455.
Matsumura, C., Y. Miyoshi, K. Seki, S. Saito, V. Angelopoulos, and J. Koller (2011), Outer radiation belt boundary location relative to the magnetopause: Implications for magnetopause shadowing,J. Geophys. Res.,116, A06212, doi:10.1029/2011JA016575.
Meredith, N. P., R. B. Horne, R. H. A. Iles, R. M. Thorne, D. Heynderickx, and R. R. Anderson (2002), Outer zone relativistic electron acceler-ation associated with substorm-enhanced whistler mode chorus,J. Geophys. Res.,107(A7), 0148–0227, doi:10.1029/2001JA900146. Meredith, N. P., R. B. Horne, R. M. Thorne, and R. R. Anderson (2003), Favored regions for chorus-driven electron acceleration to relativistic
energies in the Earth’s outer radiation belt,Geophys. Res. Lett.,30(16), 1871, doi:10.1029/2003GL017698.
Meredith, N. P., R. B. Horne, A. Sicard-Piet, D. Boscher, K. H. Yearby, W. Li, and R. M. Thorne (2012), Global model of lower band and upper band chorus from multiple satellite observations,J. Geophys. Res.,117, A10225, doi:10.1029/2012JA017978.
Millan, R. M., and R. M. Thorne (2007), Review of radiation belt relativistic electron losses,J. Atmos. Sol. Terr. Phys.,69, 362–377, doi:10.1016/j.jastp.2006.06.019.
Mourenas, D., A. V. Artemyev, O. V. Agapitov, and V. Krasnoselskikh (2013), Analytical estimates of electron quasi-linear diffusion by fast magnetosonic waves,J. Geophys. Res. Space Physics,118, 3096–3112, doi:10.1002/jgra.50349.
Ohtani, S., Y. Miyoshi, H. J. Singer, and J. M. Weygand (2009), On the loss of relativistic electrons at geosynchronous altitude: Its dependence on magnetic configurations and external conditions,J. Geophys. Res.,114, A01202, doi:10.1029/2008JA013391. Onsager, T. G., J. C. Green, G. D. Reeves, and H. J. Singer (2007), Solar wind and magnetospheric conditions leading to the abrupt loss of
outer radiation belt electrons,J. Geophys. Res.,112, A01202, doi:10.1029/2006JA011708.
Paulikas, G. A., and J. B. Blake (1979), Effects of the solar wind on magnetospheric dynamics—Energetic electrons at the synchronous orbit, inQuantitative Modeling of Magnetospheric Processes, Geophys. Monogr. Ser., edited by W. P. Olson, pp. 180–202, AGU, Washington, D. C.
Reeves, G. D., K. L. McAdams, R. H. W. Friedel, and T. P. O’Brien (2003), Acceleration and loss of relativistic electrons during geomagnetic storms,Geophys. Res. Lett.,30(10), 1529, doi:10.1029/2002GL016513.
Reeves, G. D., S. K. Morley, R. H. W. Friedel, M. G. Henderson, T. E. Cayton, G. Cunningham, J. B. Blake, R. A. Christensen, and D. Thomsen (2011), On the relationship between relativistic electron flux and solar wind velocity,J. Geophys. Res.,116, A02213, doi:10.1029/2010JA015735.
Reeves, G. D., S. Morley, and G. Cunningham (2013), Long-term variations in solar wind velocity and radiation belt electrons,J. Geophys. Res. Space Physics,118, 1040–1048, doi:10.1002/jgra.50126.
Santol´ık, O., E. Macúšová, K. H. Yearby, N. Cornilleau-Wehrlin, and H. S. K. Alleyne (2005), Radial variation of whistler-mode cho-rus: First results from the STAFF/DWP instrument on board the Double Star TC-1 spacecraft,Ann. Geophys.,23, 2937–2942, doi:10.5194/angeo-23-2937-2005.
Shprits, Y. Y., D. Subbotin, and B. Ni (2009), Evolution of electron fluxes in the outer radiation belt computed with the VERB code,
J. Geophys. Res.,114, A11209, doi:10.1029/2008JA013784.
Snyder, C. W., M. Neugebauer, and U. R. Rao (1963), The solar wind velocity and its correlation with cosmic-ray variations and with solar and geomagnetic activity,J. Geophys. Res.,68(24), 6361–6370, doi:10.1029/JZ068i024p06361.
Summers, D., B. Ni, and N. P. Meredith (2007), Timescales for radiation belt electron acceleration and loss due to resonant wave-particle interactions: 2. Evaluation for VLF chorus, ELF hiss, and electromagnetic ion cyclotron waves,J. Geophys. Res.,112, A04207, doi:10.1029/2006JA011993.
Thorne, R. M., T. P. O’Brien, Y. Y. Shprits, D. Summers, and R. B. Horne (2005), Timescale for MeV electron microburst loss during geomagnetic storms,J. Geophys. Res.,110, A09202, doi:10.1029/2004JA010882.
Thorne, R. M., et al. (2013), Rapid local acceleration of relativistic radiation-belt electrons by magnetospheric chorus,Nature,504, 411–414, doi:10.1038/nature12889.
Tsurutani, B. T., and E. J. Smith (1974), Postmidnight chorus: A substorm phenomenon,J. Geophys. Res.,79, 118–127, doi:10.1029/JA079i001p00118.
Tsurutani, B. T., A. L. Brinca, E. J. Smith, R. T. Okida, and R. R. Anderson (1989), A statistical study of ELF-VLF plasma waves at the magnetopause,J. Geophys. Res.,94, 1270–1280, doi:10.1029/JA094iA02p01270.
Tu, W., X. Li, Y. Chen, G. D. Reeves, and M. Temerin (2009), Storm-dependent radiation belt electron dynamics,J. Geophys. Res.,114, 0148–0227, doi:10.1029/2008JA013480.
West, H. I., R. M. Buck, and J. R. Walton (1973), Electron pitch angle distributions throughout the magnetosphere as observed on Ogo 5,
J. Geophys. Res.,78(7), 1064–1081, doi:10.1029/JA078i007p01064.
Xiao, F., R. M. Thorne, and D. Summers (1998), Instability of electromagnetic R-mode waves in a relativistic plasma,Phys. Plasmas,5, 2489–2497, doi:10.1063/1.872932.
Xiao, F., Q. Zhou, H. He, and L. Tang (2006), Instability of whistler-mode waves by a relativistic kappa-loss-cone distribution in space plasmas,Plasma Phys. Controlled Fusion,48, 1437–1445, doi:10.1088/0741-3335/48/9/012.
Xiao, F., Z. Su, H. Zheng, and S. Wang (2009), Modeling of outer radiation belt electrons by multidimensional diffusion process,J. Geophys. Res.,114, A03201, doi:10.1029/2008JA013580.