Benthic Respiration and Nutrient
Cycling in the Huon Estuary
(Southern Tasmania)
By
Dean Colin Thomson
Submitted in fulfilment of the requirements for the Degree of Doctor of Philosophy
Declaration of originality
I declare that this thesis contains no material which has been accepted for the award of any other degree or diploma in any tertiary institution, and to the best of my
knowledge contains no copy or paraphrase of material previously published or written by any other person except where due reference is made in the text of the thesis
Statement of authority of access
This thesis may be made available for loan and limited copying in accordance with the copyright act 1968
Acknowledgements
I would like to acknowledge and sincerely thank a number of people who have assisted and encouraged me:
My wife Sandra, whose support and encouragement is always appreciated. I couldn’t have done it without you.
Family and friends for keeping my life real and fun.
My supervisors, Dr Chris Burke and Dr John Volkman, for their ideas and guidance. I would also like to thank Dr John Purser, who stepped in for Chris when he went on Sabbatical.
Members of the CSIRO who offered advise on my research and helped me in the laboratory including Dr Ed Butler, Dr Peter Thompson, Val Latham, Danny
Holdsworth, Dr Andy Revill, Kate Berry and Ros Watson. I would especially like to thank Dr Ed Butler for allowing me to use his lab to conduct my experiments and store my samples.
Ros Watson and Val Latham for advice on various analysis techniques, and for also carrying out some of the nutrient analyses.
Fellow students who helped me in the lab or out in the field or offered general advice including Paul Armstrong, Justin Ho, Andrew Bissett and Hugh Forehead.
Ex-student Dr Perran Cook who gave me a lot of advise on methodology and data analysis.
I’d also like to thank Sue Billing and Richard Bradbury who kindly gave me a pillow to rest on and a roof over my head on my many travels to Hobart
Abstract
Sediment biogeochemistry was studied in the Huon estuary, which is located in Southern Tasmania, Australia. The sources of organic matter and rates of
decomposition were investigated as well as fluxes of nutrients, which are liberated during organic matter decomposition. The study aimed to develop a conceptual understanding of benthic respiration and nutrient cycling in the Huon estuary and the influence of organic carbon on these processes. This study also sought to evaluate the ecological significance of nutrient inputs from sediments compared with other
nutrient sources to the estuary.
Sediments were studied over one year, including sampling in March, July and
November in 2004 and then in April 2005. To represent the terrestrial and marine end members of the estuary, locations were situated in the upper and lower reaches respectively.
Employing a variety of organic – geochemical approaches, this study showed that sediments were dominated (i.e. >50%) by allochthonous, river-supplied terrestrial organic matter. Spatial differences were observed between the upper and lower locations with the upper estuary receiving most of its source of organic matter from terrestrial sources (approx. 75%). In contrast, the lower location had a greater variety of organic matter sources, with approximately 50% coming from terrestrial sources, approximately 20% from phytoplankton and about 15% from bacteria. No discernable differences were found between sampling stations within each location.
respiration was also present. The low CO2:O2 and Alkalinity:O2 flux ratios was
evidence of aerobic respiration. Additionally modelled oxygen consumption profiles showed that the majority of oxygen was consumed near the surface, most likely due to aerobic heterotrophic bacteria. A small oxygen consumption peak was also observed at the anoxic/oxic interface most likely due to sulphide oxidation.
Spatial and temporal differences in respiration occurred with carbon contents and temperature considered the main drivers respectively for this variability. Differences also occurred between total versus diffusive oxygen uptake rates, and was likely due to the presence of benthic fauna. Respiration in Huon estuary sediments compared well with other deep coastal sediments whereby rates of TCO2 and O2 fluxes were
very similar to Monterey Bay in California and the Southern Kattergat in the Baltic Sea
Benthic fluxes of nutrients were low in the Huon estuary. Average fluxes of ammonia, nitrate, phosphate and silicate were 1.3, 10.1, 1.6 and 32.5 µmol m-2 h-1 respectively. An extrapolation of these measurements to the whole estuary revealed that the sediments were only a minor source of nutrients, providing approximately 96 tonnes of inorganic nitrogen, 32 tonnes of phosphate and 586 tonnes of silicate.
On all occasions, the DIN flux was dominated by nitrate, which was always released from the sediment to the overlying water. The effluxes of nitrate and influxes of nitrite and ammonium are most likely associated with intensive nitrification,
stimulated by the presence of relatively deep oxygenated zones. Peaks of nitrate in the oxic zone observed from nitrate pore water profiles also provided additional evidence of nitrification. The net efflux of nitrate from the sediments, suggests that they act as net regenerators of nitrogen as opposed to nitrogen assimilators.
bacteria to reassimilate some of the ammonium due to the low nitrogen content of the organic matter been decomposed.
Due to increasing levels of chlorophyll a, largely due to the growing aquaculture industry, a laboratory experiment was conducted to observe the response of Huon estuary sediments to increasing loads of labile organic carbon. The addition of
Spirulina, produced a dramatic increase in the flux rates of all analytes. The change in fluxes for most analytes correlated well with increasing carbon loading however the rate change occurred in two distinct stages for some of the analytes, including oxygen and ammonium. Results showed rapid change in oxygen and ammonium flux rates and oxygen penetration with increasing carbon load size. However when the carbon load became >20.2 g C m-2 the change in flux rates and decrease in oxygen
penetration slowed significantly for these analytes.
The point at which the rate change of fluxes slowed possibly indicates that the biogeochemical system was switching from one that was dominated by aerobic respiration to one dominated by anaerobic respiration. A number of trends in the data indicate this including increasing CO2:O2 ratio, increasing alkalinity fluxes out of the
sediments, most likely due to sulphate reduction: an anaerobic metabolic process, and declining oxygen penetration depths. DIN fluxes also became dominated by
ammonium rather then nitrate as sediments became more anaerobic. Nitrate effluxes, evidence of nitrification, rapidly became nitrate fluxes into the sediment, suggesting denitrifiers could no longer obtain nitrate in situ due to the reduction in nitrification, and thus the breakdown of coupled nitrification/denitrification. As the sediments became anaerobic, denitrification became dominated by direct denitrification whereby denitrifiers obtain their nitrate requirements from the water column, as evidenced by uptake of nitrate by the sediments. Dissimilatory nitrate reduction to ammonium (DNRA) may also have contributed to the large efflux of ammonium as sediments became more anaerobic.
sediments that exist in environments exposed to increasing anthropogenic influence and provide a snapshot of how heavily polluted systems may once have functioned. This study has therefore added to the growing literature of how coastal sediments recycle carbon and nitrogen and their importance to local and global carbon and nitrogen cycles.
Finally this thesis has shown that it is difficult to interpret specific processes such as nitrification and denitrification from core incubations and the inferred stoichiometric relationships of the carbon, nitrogen and phosphate fluxes due to the complex nature of biogeochemical processes occurring in the sediments at any time. To build on the foundations laid by this study, the next step would be to carry out a set of carefully designed experiments in regards to both benthic respiration and nutrient cycling. In particular, an experiment that simultaneously measures bacterial nitrogen
assimilation, ANAMMOX, denitrification and nitrification would be useful to gain a better understanding of the nitrogen cycle. These experiments should be carried out under both unimpacted and impacted sediments as while I have shown that organic carbon loading alters sediment metabolism which is consistent with the literature, at this stage it is still unknown as to exactly how benthic metabolism would be
Table of Contents
Chapter 1. Introduction
... 21.1 Sediment Biogeochemistry ... 2
1.1.1 Benthic Metabolism ... 3
1.1.2 Nutrient Recycling ... 5
1.2 The Study Context and Research Objectives ... 8
1.3 Experimental approach... 12
1.3.1 Sources of Organic Matter ... 12
C/N Ratio... 12
Stable Isotopes... 12
Molecular Biomarkers... 13
1.3.2 Benthic Fluxes... 17
Core incubations... 17
Benthic chambers ... 17
Solute porewater profiles ... 18
1.4 Experimental design... 19
1.4.1 General Study Area ... 19
1.4.2 Study Locations... 20
1.4.3 Sampling Design ... 21
Chapter 2. Sources of Organic Matter
... 252.1 Introduction ... 25
2.2 Methods... 27
2.2.1 Total Carbon and Nitrogen concentrations and Stable Isotope δ15N and δ13C Analysis... 27
2.2.2 Lipid Biomarkers... 27
2.2.2.1 Collection and extraction of sediment... 27
2.2.2.2 Fatty acids and sterols ... 28
2.2.2.3 Instrumentation... 28
2.2.3 Sediment Grain Size... 29
2.2.4 Porosity... 29
2.3 Results ... 30
2.3.1 Sediment grain size, Porosity, Carbon and Nitrogen contents and Stable Isotope analysis ... 30
2.3.2 Fatty Acids ... 31
2.3.3 Alkanes... 36
2.3.4 Fatty Alcohols ... 38
2.3.5 Sterols... 40
2.4 Discussion ... 43
2.4.1 Total organic carbon, C/N ratios and stable isotopes... 43
2.4.2 Fatty Acids ... 45
Chapter 3 Benthic Respiration
... 613.1 Introduction ... 61
3.2 Materials and Methods ... 62
3.2.1 Study Site ... 62
3.2.2 Sediment Collection ... 63
3.2.3 Molecular Diffusive Fluxes and Oxygen Profiling ... 64
3.2.4 Total O2, TCO2 and Alkalinity Fluxes... 68
3.2.5 Benthic Fauna... 71
3.2.6 Sample Analysis... 71
3.2.7 Statistical Analysis ... 71
3.3 Results ... 72
3.3.1 Temporal and Spatial Patterns... 72
3.3.1.1 Total Oxygen fluxes ... 72
3.3.1.2 TCO2 fluxes ... 73
3.3.1.3 Depth of oxygen penetration and molecular diffusive flux rates ... 77
3.3.1.4 Oxygen Microgradient Profiles... 81
3.3.2 Benthic fauna... 82
3.4 Discussion ... 84
3.4.1 Spatial and temporal variability ... 84
3.4.2 Carbon diagenesis pathways ... 89
3.4.3 Comparison of diffusive (DOU) and total oxygen uptake (TOU) rates and the role of benthic infauna... 92
3.4.4 Ecological Significance of carbon mineralisation in Huon estuary sediments... 95
3.5 Conclusions ... 96
Chapter 4. Sediment Nutrient Fluxes
... 994.1 Introduction ... 99
4.2 Methods... 100
4.2.1 Sediment Collection ... 100
4.2.2 Sediment - water Nutrient fluxes ... 101
4.2.3 Nutrient Porewater analysis ... 102
4.2.4 Analytical Methods ... 102
4.2.4.1 Ammonium... 102
4.2.4.2 Nitrate + Nitrite ... 102
4.2.4.3 Phosphate ... 102
4.2.4.4 Silicate... 103
4.2.4.5 Total Nitrogen ... 103
4.2.5 Sediment – water flux calculations ... 103
4.2.6 Modelled sediment NH4+ production rates... 104
4.2.7 Statistical Analysis ... 105
4.3 Results ... 105
4.3.1 Physio-chemical water column conditions... 105
4.3.2 Sediment nutrient fluxes... 106
4.3.3 Porewater profiles ... 113
4.4 Discussion ... 116
4.4.1 Spatial variability of nutrient fluxes... 116
4.4.3 Nutrient Cycling... 122
4.4.3.1 Nitrogen... 122
4.4.3.2 Phosphate ... 127
4.4.3.3 Silicate... 128
4.4.4 Upward fluxes of ammonium in the sediments... 128
4.4.5 Comparison with other estuaries ... 130
4.5 Conclusions ... 134
Chapter 5. Effect of Carbon Loading on Sediment Fluxes
... 1375.1 Introduction ... 137
5.2 Methods... 139
5.2.1 Sampling Site and sediment collection ... 139
5.2.2 Carbon Loading Experiment ... 140
5.2.3 Total O2, TCO2 and Alkalinity and Nutrient Fluxes ... 141
5.2.4 Oxygen Penetration Depth ... 142
5.2.5 Nutrient Pore water analysis ... 143
5.2.6 Analytical Methods ... 143
5.2.6.1 Ammonium... 143
5.2.6.2 Nitrate + Nitrite ... 143
5.2.6.3 Phosphate ... 144
5.2.6.4 Alkalinity... 144
5.2.7 Statistical Analysis ... 144
5.3 Results ... 144
5.3.1 Respiration Fluxes... 144
5.3.2 Nutrient Fluxes... 147
5.3.3 Porewater Nutrients... 148
5.4 Discussion ... 151
5.4.1 Fluxes before carbon addition ... 151
5.4.2 Fluxes after carbon loading ... 153
5.4.3 Comparison with other Studies ... 156
5.5 Conclusions ... 157
Chapter 6. General Discussion
... 1606.1 Introduction ... 160
6.2 Conceptual nutrient cycling model for sediments in the Huon estuary ... 160
6.3 The influence of organic carbon on benthic respiration in the Huon Estuary. 168 6-4 How does sediment respiration and nutrient cycling respond to organic carbon perturbation ... 173
6-5 Ecological significance of Benthic Nutrient Fluxes in the Huon Estuary ... 176
6-6 Conclusions... 178
Chapter 1
Chapter 1. Introduction
Anthropogenic pollution of estuarine environments continues to increase around the world due to rapid urbanisation. Human activities including land clearing, agriculture, effluent disposal, aquaculture and combustion of fossil fuels are all impacting on the coastal environment leading to nutrient enrichment and increased sedimentation (Gray et al., 2002; Nixon, 1995; Holmer, 1991). Understanding how estuarine ecosystems function prior to and after anthropogenic perturbation is required to ensure their sustainability for future generations.
1.1 Sediment Biogeochemistry
Estuaries act as an important link between the land and the sea and therefore play a crucial role in coastal ecosystems. High sedimentation rates in estuaries mean that they play a crucial role in recycling carbon and nutrients to the broader ecosystem. Depending on the lability of the organic matter depositing onto the seafloor, the sediments will either rapidly remineralise the organic carbon releasing it back into the water column as carbon dioxide (CO2) or the carbon will be sequestered within the
sediments (Kristensen, 2000).
Particulate organic nitrogen (PON) is also remineralised during organic matter decomposition. The remineralised nitrogen can be released back into the overlying water column, as dissolved organic nitrogen (DON), ammonium or nitrate, which can be readily available for uptake by phytoplankton. However it can also be converted to di-nitrogen (N2) gas via denitrification or the ANAMMOX reaction and therefore no
longer available for phytoplankton uptake. Alternatively, ammonium can be
1.1.1 Benthic Metabolism
Sedimentary organic matter can be remineralised either through aerobic or anaerobic pathways. Organic matter can generally be characterised as having the following chemical composition:
(CH2O)a (NH3)b (H3PO4)c (1)
The amount of a, b and c largely depends on the source of the organic matter and stage of decomposition.
When organic matter is initially deposited onto the sea floor, organisms such as benthic fauna, bacteria and fungi (Kristensen, 2000) aerobically decompose the organic matter according to the following stoichiometry:
(CH2O)a (NH3)b (H3PO4)c + dO2→aCO2 + bNH3 + cH3PO4 + dH2O (2)
Because aerobic respiration occurs in a relatively thin oxidised upper layer in coastal sediments, a large fraction of the organic matter can be buried into anoxic layers.
Anaerobic metabolism proceeds in a sequence of metabolic processes that generally change with depth. The following order in which anaerobic metabolism occurs will depend on the availability of electron acceptors (Kristensen, 2000):
• Mn4+ Manganese oxide reduction • NO3- Denitrification
• Fe3+ Iron oxide reduction • SO42- Sulphate reduction
• CO2 Carbon dioxide reduction
Benthic metabolism can be influenced by a number of factors. These factors include: • Organic enrichment (Holmer and Kristensen, 1992; Caffrey et al., 1993;
Christensen et al., 2000; Grenz et al., 2000; Gray et al., 2002);
• Bioturbation/irrigation (Aller, 1994; Kristensen, 2000; Berg et al., 2001; Glud et al., 2003; Nielsen et al., 2004);
• Temperature (Klump and Martens, 1989; Vidal et al., 1997; Thamdrup et al., 1998; Westrich and Berner, 1998); and
• Oxygen concentration in the water column (Rasmussen and Jorgensen, 1992).
Benthic respiration is directly influenced by the source and supply of labile organic matter. In sediments that undergo organic enrichment either during phytoplankton blooms or via anthropogenic inputs, sediments may become anaerobic due to the depletion of oxygen within the sediments. The oxygen penetration depth is directly influenced by the supply of labile organic carbon, with shallow oxic zones related to high respiration rates due to increased organic loading (Kristensen, 2000).
Benthic remineralisation of carbon is strongly related to the sedimentation rate of carbon to the sea floor with the rate being strongly attenuated by the depth of the water column (Devol and Christensen, 1993). Many studies have shown that carbon sedimentation rates decrease with depth (Devol and Christensen, 1993), and that the relationship between sediment carbon oxidation rates and depth is best described by a power function (Christensen, 1989; Devol and Christensen, 1993). That is, carbon oxidation rates rapidly decline with increasing depth of the water column. Glud et al. (2000) found that carbon oxidation rates in Young Sound, Greenland, declined exponentially with depth because organic carbon and nutrients were being recycled in the upper water column before they reached the sea floor. Hulth et al. (1994) also found carbon oxidation rates to be strongly correlated with depth in the arctic
The effect of temperature has been shown to affect both anaerobic and aerobic respiration. A study by Thamdrup et al. (1998) showed that aerobic respiration in marine sediments increased by a factor of 2-3 for a temperature increase of 10oC. Likewise, studies have shown that sulphate reduction increases by a factor of 3 for a temperature increase of 10oC (Westrich and Berner, 1988 and references therein)
Benthic respiration can also be influenced by a variety of benthic faunal processes including bioturbation and irrigation. Bioturbation can enhance the movement of particles within sediments, which leads to greater substrate exposure, and hence an increase in organic matter decomposition. Sediment particles may also be transported between anaerobic and aerobic environments resulting in increased reoxidation and possibly increased remineralization (Aller, 1994). Irrigation and ventilation within and around worm burrows can also enhance benthic respiration by supplying oxygen and other oxidized compounds (electron acceptors) at depth in the sediments
(Kristensen, 2000).
1.1.2 Nutrient Recycling
Due to the remineralisation of organic matter, inorganic nutrients are released as shown by the simplified stoichiometric equation for aerobic respiration (equation 2) above. Of particular interest in Australian coastal environments is the nitrogen cycle as this is generally the limiting nutrient for phytoplankton growth.
After the remineralisation of organic matter, the ammonium produced may then be assimilated by bacteria, released from the sediment, become adsorbed onto sediment particles or oxidised to NO3- (Blackburn and Henriksen, 1983; Klump and Martens,
1983).
Nitrogen Cycling
Nitrification
Nitrification is the process whereby ammonium is oxidised to nitrite (nitrosofying bacteria such as Nitrosomonas sp.) and thence to nitrate (nitrifying bacteria such as
NH3 + O2→ NO2− + 3H+ + 2e− (3)
NO2− + H2O → NO3− + 2H+ + 2e− (4)
Nitrification is typically an aerobic process, and is generally confined to the oxic zone within sediments. However recent evidence suggests nitrification may also be coupled to manganese IV reduction (Hulth et al., 1999) within the anaerobic zone.
Nitrification is regulated by a number of factors including the availability of O2 and
NH4+, as well as salinity and pH. These, in turn, are often controlled by the
metabolism of bacteria, benthic algae and macrofauna.
It has been found that nitrification can be significantly inhibited by the activity of benthic diatoms (Henriksen and Kemp, 1988) and heterotrophic bacteria (Strauss and Lamberti, 2000) possibly through competition for NH4+. Rates of nitrification are
generally highest around macrofauna burrows, due to the occurrence of relatively high concentrations of NH4+ within an oxic environment (Henriksen and Kemp,
1988). Nitrification is important in the nitrogen cycling pathway as it is the precursor to denitrification.
Denitrification
Denitrification is the reduction of NO3- to N2 mediated by bacteria (Hulth et al.,
2005). The process of denitrification requires the availability of NO3-(or NO2-),
organic carbon and anoxic conditions. Denitrification is represented by the following stoichiometry:
106(CH2O)16(NH3)(H3PO4) + 94.4HNO3→106CO2 + 55.2N2 + H3PO4 + 177.2H2O(5)
The bacteria involved in denitrification can obtain nitrate from either the water column or from nitrification in sediments. When nitrate for denitrification is obtained from nitrification, the process is called coupled nitrification – denitrification (Capone,
-et al., 2000a), while denitrification rates in systems with low concentrations of NO3-,
depend entirely on nitrification occurring within the sediment.
ANAMMOX
An alternative pathway to denitrification is anaerobic ammonium oxidation
(ANAMMOX) whereby ANAMMOX bacteria convert nitrite and ammonium to N2
(Hulth et al., 2005). However the ANAMMOX reaction can only take place in the presence of both ammonium and nitrite in an anoxic environment. The ANAMMOX reaction is strongly inhibited by the presence of dissolved oxygen (Hulth et al., 2005). Nedwell et al. (1999) suggested that the ANAMMOX reaction is most likely to occur in hyper-nutrified environments. Since that study however, Kuypers et al. (2005) discovered the occurrence of ANAMMOX in the oxygen minimum zone of the Benguela upwelling off the coast of Namibia. Therefore the occurrence of
ANAMMOX could be more widespread in a range of ecological systems then first thought.
Dissimilatory Nitrate Reduction to Ammonium (DNRA)
This process is mediated by bacteria that couple the oxidation of organic carbon or reduced Fe- and S to the reduction of nitrate via nitrite to ammonium (Hulth et al., 2005) and appears to be most important in organic rich sediments with low NO3-
concentrations (Nedwell et al., 1999). In a recent study, sediments enriched by fish farm effluent were shown to have DNRA rates 7 times higher than denitrification, while sediments unaffected by the fish farm effluent had insignificant rates of DRNA (Christensen et al., 2000). This is important for nutrient cycling as it can lead to large supplies of ammonium to the water column, where otherwise it may have been removed from the environment via denitrification or ANAMMOX.
Phosphorus cycling
only released when iron (III) is reduced to iron (II) (Butler et al., 2000). Assimilation by benthic algae may also influence the cycling of phosphorus in sediments (Neilsen et al., 2001).
Silicate cycling
Sediment silicate fluxes are related to the availability of biogenic silica (Forja et al., 1994). The main source of biogenic silica to the seafloor in marine environments is mainly in the form of skeletons or skeletal fragments of silica – secreting micro-organisms e.g. diatoms (Zabel et al., 1997). Up to 80% of biogenic silica may be recycled by digenetic processes in surficial sediments (Zabel et al., 1997). Silicate fluxes can be influenced by irrigation rates and seasonality (Berelson et al., 2003), with temperature and the occurrence of diatoms the likely drivers of differences between seasons.
Benthic regeneration of silicate can have important consequences on the broader coastal ecosystem. In some systems such as the Black sea (Friedl et al., 1998) benthic regeneration may be the most important source of silicate including that supplied by river discharge. This can be important in terms of phytoplankton growth. While silica is not a limiting nutrient to overall primary production, changes in the relative
abundances of Si to N and P can potentially alter the phytoplankton community structure (Giblin et al., 1997). A decrease in this ratio can lead to shift from siliceous diatoms to flagellates and coccolithophores (Friedl et al., 1998), which can lead to an increase in toxic algal blooms (Giblin et al., 1997).
1.2 The Study Context and Research Objectives
knowledge already exists on water quality, sediment characteristics and physical processes such as flow rates and salinity gradients. The HES was commissioned in the late 1990’s to evaluate the environmental quality and understand the working of the Huon estuary as a system. This need emerged because of the rapidly expanding farming of finfish in these waters and the desire to manage the industry in a sustainable manner.
One of the main aims of that study was to identify the sources of nutrients into the Huon estuary and to develop overall system nutrient budgets. One of the key findings to emerge from the HES was that marine sources clearly dominated nitrogen inputs to the system annually. However uncertainty remained as to the source of nitrogen loads in bottom waters in summer. The authors concluded that this had potentially major implications for the estuarine assimilation capacity for fish-farm effluents as well as catchment loads.
The lack of understanding of how nutrients were cycled in the bottom waters of the estuary emerged as a key knowledge gap. The HES recommended that this gap should be addressed with specific process studies focused on nutrient regeneration in bottom waters and sediments of the lower Huon Estuary. Therefore one of the key aims of the current study was to address this knowledge gap by measuring benthic nutrient fluxes and nutrient porewater concentrations and thus infer key processes. A second aim was then to evaluate the importance of benthic nutrient regeneration to the broader Huon estuary system. Additional to these aims was to evaluate the role organic matter plays in driving respiration and nutrient cycling in Huon estuary sediments.
metabolic reactions are well known for carbon and nutrient cycling, how these reactions interrelate is less well known for unimpacted sediments in Australian environments. Studies on estuarine systems that are relatively pristine are important to advancing our understanding of global carbon and nutrient cycles.
In Summary, the overall aim of this study was to identify and understand the important biogeochemical processes occurring in sediments of a near pristine Australian temperate estuary. Of particular interest were the interactions between carbon inputs, benthic respiration and nutrient cycling and how these interactions control sediment-water exchange of nutrients. To achieve this, a field study was designed to identify the sources of organic carbon, benthic respiration and nutrient recycling processes. The first three research chapters are structured around the field study. Chapter 2 identifies the sources of organic carbon in the sediments using a variety of organic geochemistry techniques. Identifying the sources of organic carbon is important because the biodegradability of the carbon will affect the ability and thence rate that bacteria can remineralise the carbon. In general, organic carbon from terrestrial sources is refractory, or hard to breakdown, while marine phytoplankton sources of organic carbon are generally labile and thus easy to breakdown. Therefore the portion of labile carbon is important for driving benthic respiration and thence nutrient cycling.
Chapter 3 examines benthic respiration and carbon cycling. This was examined using measurements of CO2 and O2 fluxes in core incubations and employment of oxygen
microelectrodes to obtain sediment oxygen microprofiles. Chapter 4 uses nutrient flux measurements from core incubations and porewater profiles to identify the key
cycling. Therefore understanding how sediments in the Huon estuary respond to organic enrichment is critical to understanding the overall assimilation capacity of the estuary to nutrient enrichment from fish farms and other sources of anthropogenic pollution.
In summary, four research chapters and the general discussion are presented in this thesis which address the following questions
Chapter 2 – Sources of Organic Matter
• What are the major sources of organic carbon?
• How does the source and quantity of organic carbon change both temporally and spatially?
Chapter 3 – Benthic Respiration
• What are the rates of benthic respiration and how do they change temporally and spatially?
• What are some of the major factors controlling respiration?
• How does benthic respiration in the Huon estuary compare with other coastal systems?
Chapter 4 – Benthic Nutrient Cycling
• What are the major recycling pathways for nutrients within the sediments? • How do these processes vary temporally and spatially?
• How does benthic nutrient cycling in a mesotrophic system contrast with more enriched systems?
Chapter 5 – The effect of Organic Enrichment on Sediment Respiration and Nutrient Recycling Pathways
• What is the response of benthic respiration to organic enrichment? • How does organic enrichment impact on the nutrient cycling processes?
Chapter 6 – General Discussion
• Construction of Conceptual models and budgets for carbon and nutrient cycling
• How does organic carbon enrichment change the key processes in the conceptual models
• Evaluates the ecological significance of benthic nutrient cycling in the broader estuarine environment
1.3 Experimental approach
1.3.1 Sources of Organic Matter
C/N Ratio
The carbon to nitrogen (C/N) ratio can be used as a proxy to measure the quality of organic matter. A C/N ratio close to that of the Redfield ratio (6.625) is indicative of organic matter derived from marine phytoplankton while organic matter derived from terrestrial sources can have a C/N ratio of 20 or more (Bordovskiy, 1965).
This approach is, however, very approximate as degradation may significantly alter these ratios (Thornton and McManus, 1994). Low C/N ratios tend to increase during degradation because nitrogen is lost from organic matter at a greater rate then
produced by decomposing bacteria. In contrast, high C/N ratios tend to decrease during degradation as bacterial nitrogen production occurs at a faster rate then nitrogen loss from the decomposing organic matter (Thornton & McManus, 1994). Therefore, as new material is constantly arriving at the seafloor and in different degradation states the surface sediment contains a mixture of ‘fresh’ and degraded material, and the longer organic matter has been deposited on the seafloor the more difficult it becomes to distinguish between the two sources using C/N ratios.
Stable Isotopes
estimate of sources for the total carbon in the sample, it will only provide useful information when there are two well-defined end-members. Furthermore, this
technique gives little information about the type of marine or terrestrial organic matter in question.
Molecular Biomarkers
While C/N ratios and stable isotopes can tell us the relative contributions of terrestrial and marine organic matter, molecular biomarkers such as sterols, fatty acids and alcohols allow us to distinguish between the various sources of organic matter and can therefore provide very specific information. However, many lipid biomarkers originate from more than one source, making it difficult to isolate the source of the lipids when based on one compound only. Thus, the use of several lipid biomarkers can be used in combination to identify the source of organic matter within the sediments.
Alkanes and alcohols can be used to identify terrestrially derived organic matter. Alkanes from cuticular waxes of higher lands typically range between C23-35 with a distinct predominance of odd-carbon chain lengths and a concentration maximum at C27, C29 or C31. In regards to alcohols, C22 to C28 are generally characteristic of plant waxes from higher plants (Birgel et al., 2004). Alkanes are hydrocarbons that contain only single bonds whereas alcohols are hydrocarbon derivatives in which one or more hydrogens of a parent hydrocarbon have been replaced by a hydroxyl or alcohol functional group as depicted in figure 1.1.
CH3 CH2 CH3 CH3 CH CH3
OH Alkane Alcohol Figure 1.1 Basic structures of alkanes and alcohols
of membrane-bound enzymes (Volkman, 2003).Sterols generally make good biomarkers as they are relatively stable and have a long geological record, and they possess structural features (e.g. position of double bonds), which are restricted to a few groups of organisms (Volkman, 1986). However, some sterols are widely
dispersed in many organisms, making it difficult to assign those particuliar sterols to a particuliar source of organic matter. For example, Cholest-5-en-3β-ol (Cholesterol) is generally associated with zooplankton or other marine fauna as it is the major sterol of marine animals. However, it also widely dispersed in marine phytoplankton, particularly in dinoflagellates and some diatoms (Volkman, 1986).
Some of the main sterols of interest in marine sediments include
24-methylcholesta-5,22E-dien-3β-ol (Diatomsterol), Cholest-5-en-3β-ol
(Cholesterol), 24-ethylcholesta-5,22E-dien-3β-ol (Stigmasterol), 24-ethylcholest-5- en-3β-ol (Sitosterol) and 24-methylcholest-5-en-3β-ol (Campesterol), which are commonly used as markers for diatoms, marine animals and higher plants
Figure 1-2 The structural formula of cholesterol, diatomsterol, campesterol and sitosterol.
Fatty acids are generally the most abundant lipid type in surface sediments (Volkman et al., 1998) and fulfill a range of roles within living organisms including cellular membrane components (e.g.phospholipids), energy stores (e.g. triglycerides) and protective coatings (e.g. wax esters) (Killops and Killops, 1993). Fatty acids are found in various biological classes and provide a range of useful markers for phytoplankton, macroalgae, bacteria, seagrasses and terrestrial plants in the marine environment (Volkman et al., 1980, Meziane et al., 1997, Volkman et al., 1998, Kharlamenko et al., 2001).
Phytoplankton are a major source of fatty acids in marine sediments and the contribution of different algal classes can often be discerned from characteristic
HO
Cholesterol
HO
Diatomsterol
HO
Campesterol
HO 5
differences between classes (Smith et al., 1983; Dunstan et al., 1992; Viso and Marty, 1993; Volkman et al., 1989; Volkman et al., 1998; Zukhova and Aizdaicher, 1995). Table 1-1 provides a summary of the major fatty acids found in different algal classes. The table highlights that fatty acid compounds are often abundant in more then one algal class. However of more importance is the combination of fatty acid compounds within a class. For example 20:5n-3 is abundant in many algal classes but the
combination of high abundances of 18:4n-3, 20:5n-3 and 22:6n-3 is unique to the algal class Dinophyceae.
Table 1-1. Characteristic fatty acids in phytoplankton classes (information source: Viso and Marty (1993))
Bacteria are also associated with distinctive fatty acids, in particular iso-15:0 and
antesio-15:0 branched fatty acids. Vaccenic acid (18:1n-7) is also present in many
bacteria (Volkman et al., 1980; Perry, 1979). Perry et al. (1979) found that vaccenic acid accounted for 10.5% of fatty acids in aerobic heterotrophs and 17.3% in
anaerobic heterotrophs. However, vaccenic acid has also been reported in many other organism including plankton, phytoplankton, molluscs and fish (Perry et al., 1979). Therefore fatty acids should be analysed in combination with other molecular biomarkers before conclusions about the origin of the organic matter can be drawn. In this study a variety of geochemical approaches including C/N ratios, stable isotopes and molecular biomarkers were used to characterise the sources of organic matter at the study locations. Used as stand alone techniques, they each have both strengths and weaknesses as discussed above. However combining the different
Algal Class Characteristic fatty acids
Bacillariophyceae 16:1n-7, 16:0, 20:5n-3 and 14:0
Dinophyceae 16:0, 18:4n-3, 20:5n-3 and 22:6n-3
Prymnesiophyceae 14:0, 16:0 and 18:1n-9
Chlorophyceae and Prasinophyceae 16:0, 18:3n-3 and 16:4n-3
Cryptophyceae 16:0, 18:1n-9, 18:4n-3 and 18:2n-6
Raphidophyceae 16:0, 16:1n-7, 20:5n-3 and 18:4n-3
Xanthophyceae 16:1n-7, 16:0 and 20:5n-3
Rhodophyceae 16:0, 20:4n-6 and 20:5n-3
1.3.2 Benthic Fluxes
A number of different approaches have been used to study benthic respiration and the exchange of nutrients at the sediment – water interface. The most common techniques employed include sediment core incubations, in situ benthic chambers and the
calculation of fluxes from porewater concentration profiles (Hammond et al., 1985). Briefly, each of these methods and their limitations are discussed below.
Core incubations
Sediment cores are usually collected either by divers or remote coring devices such as box corers from which sub-cores are taken. The cores can then incubated at in situ temperature onboard a ship or taken back to a land-based laboratory. The change in the concentration of the solutes of interest in the overlying water, are then measured in the dark and or light.
The limitations of this technique include the possible underestimation of benthic exchange in sediments that have abundant macrofauna due to burrows being disturbed and damaged during the coring process (Hammond et al., 2004). The process of obtaining cores can also be quite destructive and can lead to excessive disturbance of the sediment structure, particularly the surface (top 1 cm) if care is not taken
retrieving the cores. Disruption of the sediment can significantly alter the biochemical structure within the cores and therefore seriously affect the processes occurring within. Retrieving cores from deep-sea sediments may also seriously affect bacterial metabolism that might be pressure dependent. Hammond et al. (2004) found that nitrate uptake in core incubations were significantly lower than in situ uptake, with the difference largely attributed to decreased denitrification rates in recovered cores in response to altered temperature and pressure. On the other hand, Miller-way et al. (1994) found no discernable difference between core incubations and in situ measurements in a shallow station on the Louisiana continental shelf.
Benthic chambers
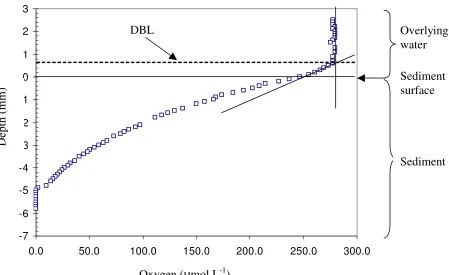
1985). Another complication of this technique is that turbulence within the chamber may be different to that of normal conditions (Hammond et al., 1985). For instance, some authors have shown that the effect of stirring rate on benthic fluxes can be large due to the disturbance of the diffusive boundary layer (DBL) (Hammond et al., 1985).
The DBL is a thin laminar flow between the sediment and water interface and controls the rate of diffusion of solutes between the sediment - water interface and is dependent on the appropriate level of turbulence. Therefore turbulence levels
different to natural conditions will greatly affect the flux of solutes through this layer (Hammond et al., 1985; Gundersen and Jorgensen, 1990; Jorgensen and Des Marais, 1990). Other limitations of chambers include the difficulty of measuring small fluxes, and that long deployments may lead to the production of anoxic conditions
(Hammond et al., 1985).
Solute porewater profiles
The final technique discussed is the calculation of fluxes from pore water
concentrations. The production of solutes within the sediment and diffusion rates across the sediment-water interface can be modeled from porewater profiles within the sediment and at the sediment-water interface (Berner, 1980). Berg et al. (1998) developed a model, which enables the calculation of sediment production and consumption rates as a function of depth as well as calculating the flux across the sediment-water interface and includes the non-diffusive transport mechanisms of bioturbation and bioirrigation.
In this study, core incubations were used to measure integrated fluxes of CO2, O2,
NH4+, NO3-, NO2-, SiO2, PO43- and alkalinity while gradients of oxygen, NH4+, and
NO3- were measured in the porewaters. Oxygen gradients were measured using
microelectrodes while NH4+ and NO3- porewater profiles were measured by the core
slicing and centrifuging technique. Due to the fine nature of the sediment, a resolution of 0.5 cm was obtained. This method could also be easily set up using existing
equipment. Rates of O2 consumption and NH4+ production within the sediments were
calculated using the porewater modeling routine of Berg et al. (1998). Oxygen
consumption measured in core incubations and modeled from porewater profiles were compared to infer the influence of macrofauna on respiration rates.
1.4 Experimental design
1.4.1 General Study Area
The Huon estuary is considered to be mesotrophic. Total nitrogen is high (10 - 20µm) mostly in the form of Dissolved organic nitrogen (DON), which enters the estuary from the forested catchments in the upper reaches. Dissolved inorganic nitrogen is low and dominated by nitrate. Nitrate tends to peak between March and September (>3µm) before been depleted in spring by phytoplankton blooms (<0.5µm). Ammonia is almost always below 1µm. Nitrogen is considered to be the limiting nutrient in this system. The estuary is generally well oxygenated with 80 – 100% DO saturation typical throughout the year (Butler et al., 2000).
The high quality of water is due to the upper catchment of the estuary been near pristine, which is characterised by native forest. In the lower catchment, the main industry is agriculture, in the form of horticulture and livestock grazing. The
Apart from agriculture, no other major industries apart from a saw mill operating between the early 1900’s to 1929 at Hospital bay, and a neutral sulphite
semi-chemical pulp mill operating between 1962 – 82 and 1986 – 1991 at the same site as the saw mill existed. More recently marine farming has been introduced since the mid 1980’s mainly in the form of salmonid culture and some shellfish culture. Three sewage treatment plants with some secondary treatment service the region, which is populated with about 13,000 people living in a number of small towns within the valley (Butler et al., 2000).
The main physical attributes of the Huon Estuary include a salt-wedge that penetrates into the upper reaches and relatively high flushing rates. Annual median flows are 41m3 s-1 and the average flushing period is approximately 7 days. The estuary is 39km in length, with an area of 83km2 and a mean depth of 16.6m. The estuary is also characterised by a shallow brackish zone in the upper half of the estuary and a deeper marine lower estuary with the presence of a mixing zone between the brackish and marine sections located at the ‘elbow’ of the estuary (Butler et al., 2000).
1.4.2 Study Locations
Two locations exhibiting different sediment characteristics were chosen for this study. The main consideration was to select study locations that were potentially influenced by different sources of organic matter. This was done so that we could assess the impact of different types of organic matter on sediment respiration and nutrient cycling. Care was taken so that other potential drivers of respiration and nutrient cycling such as water depth, sediment grain size and water quality were similar at both sites. The final position of the two locations was based on the Huon estuary report (Butler et al., 2000), which investigated the sources of organic matter within the sediments.
1.4.3 Sampling Design
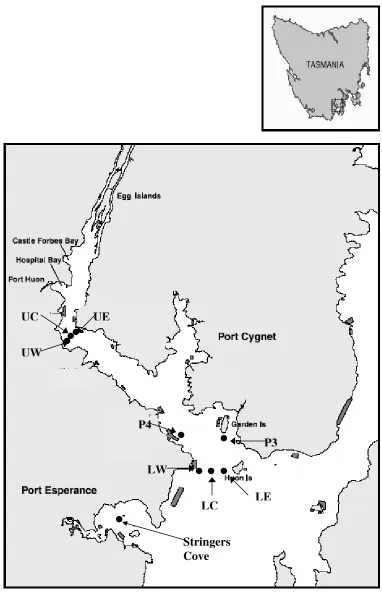
At both locations, a transect consisting of 3 sites from east to west was set up to study benthic respiration and nutrient cycling (Figure 1-3). At the upper location, the sites were called upper east, upper centre and upper west and will be referred to as UE, UC and UW respectively throughout the rest of the thesis. Likewise, the sites at the lower location were called lower east, lower centre and lower west and will be referred to as LE, LC and LW respectively throughout the rest of this thesis.
At each site triplicate cores were taken to measure sediment-water exchange of nutrients and respiration, duplicate cores were taken to measure oxygen and nutrient micro-profiles while sediment samples were also obtained for bulk carbon and
nitrogen analysis, sediment porosity and grain size as well as stable isotopes δ13C and δ15N and lipid molecular biomarkers. Water samples were also taken to measure basic water quality parameters and background nutrient concentrations
The study locations were visited three times in 2004, including March, July and November, using a small research vessel. The two locations were sampled on separate occasions, generally 3 days to a week apart, due to resource and labour limitations. Data from an additional sampling trip in April 2005 from Hideaway bay (P3) and Garden Island (P4) (Figure 1-3) have also been used in this thesis and will serve as a comparative study of the benthic processes with the upper and lower locations of the main study.
however that such measurements would have being desirable and would have added valuable information to the thesis.
Figure 1-3 The sampling sites for the Huon Estuary Study. The sampling locations include the upper estuary stations UE, UC & UW, the lower estuary stations LE, LC & LW, and additional sampling stations at Hideaway bay (P4) and Garden island (P3). Also included is sampling station at Stingers cove, which was used in a different study, but is referred to in this study for comparative purposes.
LE LC
LW
P3 P4
UE UC
UW
[image:33.595.126.508.81.678.2]Chapter Two
Chapter 2. Sources of Organic Matter
2.1 Introduction
Sediments play a vital role in the ecological functioning of an estuary by retaining much of the organic matter and minerals supplied naturally by rivers, catchment run-off and inputs from the water column. Much of the organic matter is remineralised by the microbial and faunal populations present, liberating nutrients and consuming oxygen, but more refractory material is buried in the sediments (Herbert, 1999).
The quality of the organic matter reaching the seafloor will heavily influence the rates and recycling pathways of carbon and nitrogen in sediments (Herbert, 1999). The carbon to nitrogen (C/N) ratio can be used as a proxy to measure the quality of the organic matter. A C/N ratio close to that of the Redfield ratio (6.625) is indicative of organic matter derived from microalgae while organic matter derived from terrestrial sources can have a C/N ratio of 20 or more (Bordovskiy, 1965).
Where the original organic matter undergoing decomposition has a high C/N ratio, much of the nitrogen remineralised may be reassimilated into microbial biomass (Schlesinger, 1997). Organic matter that is more labile and has a lower C/N ratio will stimulate rapid remineralisation rates and a release of nitrogen from the sediment (Hansen and Blackburn, 1992). Note, however, that as degradation proceeds the C/N ratio usually increases as nitrogen-rich labile organic matter is consumed (Thornton and McManus, 1994).
Furthermore, this technique gives little information about the type of marine or terrestrial organic matter in question.
Various other proxies have been used to estimate the sources of organic matter in sediments and from this inferences about the amount of labile organic matter present can be made. For example, biochemical’s such as carbohydrates, proteins and lipids are rapidly degraded in sediments and so measures of their abundance provide an estimate of the labile organic matter present (Misic and Fabiano, 1996; Fabiano and Pusceddu, 1998; Pusceddu et al., 1999; Danovaro et al., 2001). Alternatively, lipid and pigment biomarkers can allow the various sources of various sub-fractions of organic matter to be identified.
Fatty acids provide a range of useful markers for microalgae, macroalgae, bacteria, seagrasses and terrestrial plants (Volkman et al., 1980; Meziane et al., 1997; Volkman et al., 1998; Kharlamenko et al., 2001). Sterols have also been used to identify
sources of organic matter including that derived from faeces, diatoms and terrestrial sources (Volkman, 1986; Barrett et al., 1995). Triterpenoid alcohols such as α- and β-amyrins, lupeol, taraxasterol, betulin etc. are widely used as markers for higher plants (e.g. Volkman et al., 1987; Volkman, 2000), even though some of these have
additional minor sources (Volkman, 2005). Hopanoid alcohols are excellent markers for cyanobacteria and other prokaryotes (Summons et al., 1999).
2.2 Methods
2.2.1 Total Carbon and Nitrogen concentrations and Stable Isotope
δ
15N
and
δ
13C Analysis
Sediment sub-samples, taken from the same samples used for the analysis of lipid biomarkers, were dried in an oven overnight at 60oC, before being ground with a mortar and pestle. For the analysis of total organic carbon, sediments were weighed into smooth-walled tin cups and acidified with sulphurous acid to remove any inorganic carbon. 10 µl of 8% sulphurous acid was carefully added to each sample and then placed into an oven heated to 60oC until dry. This process was then repeated until effervescence was no longer detected. Sediment samples for nitrogen analysis were weighed into aluminium cups with no further processing required.
Samples were then analysed for nitrogen and carbon contents, and stable isotopes δ15N and δ13C using a Carlo Erba NA1500 CNS analyser interfaced via a Conflo II to a Finnigan Mat Delta S isotope ratio mass spectrometer operating in continuous flow mode. Combustion and oxidation were achieved at 1090oC and reduction at 650oC. Samples were analysed in duplicate. Results are presented in standard δ notation:
δ15N or δ13C (‰)
= −1 tandard s
sample
R R
x 1000‰
Where R = 13C/12C or 15N/14N. The standard for carbon is Vienna PDB limestone and the standard for nitrogen is atmospheric N2.
2.2.2 Lipid Biomarkers
2.2.2.1 Collection and extraction of sediment
every hour for 3 hours and then left overnight to extract. Phases were separated the next day by addition of CH2Cl2 and water to bring the final mixture ratio to 1:1:0.9
methanol/CH2Cl2/water by volume. The total solvent extract was obtained by rotary
evaporation of the organic solvent phase. This was then stored in glass vials, refrigerated ready for saponification.
2.2.2.2 Fatty acids and sterols
A 50% aliquot of the total solvent extract was saponified with potassium hydroxide in methanol, 5% wt./vol, under nitrogen for 2 hours at 80oC. Non-saponified neutrals were than extracted into hexane/CH2Cl2 (4:1 by vol, 3*3 ml) and transferred to
sample vials ready for analysis by gas chromatography (GC) and gas chromatography mass spectrometry (GCMS) after derivatisation with 100 µl of BSTFA solution at 60oC for 1 hour. After acidification of the remaining aqueous layer using hydrochloric acid down to pH=2, total fatty acids were obtained and methylated to form their fatty acid methyl esters using methanol/hydrochloric acid/CH2Cl2 (10:1:1 by volume) at
80°C for 2 hours. A C23 straight-chain fatty acid methyl ester internal standard was
then added before analysis using GC and GCMS.
2.2.2.3 Instrumentation
Gas chromatography
GC was performed on a Varian 3410 gas chromatograph fitted with and HP5 ultra capillary column (50 m; 0.32 i.d.; 0.17 µm film thickness), with an FID detector and SPI programmable injector. Samples were injected at 45oC; after 1 minute the oven temperature was raised at 30oC min-1 to 140oC and then at 3oC min-1 to 300oC where it was held for 5 minutes.
Mass spectrometry
the carrier gas. Typical mass spectrometer operating conditions were as follows: EV, 70 eV; Emission current 250, transfer line 310oC. Source temperature 240oC, 0.8 scans sec-1 and mass range 40-650 Dalton.
2.2.3 Sediment Grain Size
Sediment samples were taken from the same box cores that were analysed for respiration, nutrient fluxes and lipid biomarkers. Three sub-samples were taken, of which two were weighed wet and then dried at 60oC in an oven overnight and then reweighed to determine the % water content of the samples. The third sample was weighed wet and then washed through a series of Endecott (London UK) metal sieves including 500 µm, 250 µm, 125 µm and 63 µm meshes. The sieves were then dried overnight. The dry sediment was then reweighed and converted back to wet weight using the % water content as the conversion factor to determine the wet weight of each grain size fraction at each sampling site. The difference between initial wet weight and final wet weight was assumed to have been the sediment particles that passed through the 63 µm sieve. The amount of sediment in each grain size fraction was then expressed as a percentage of the total sample.
2.2.4 Porosity
2.3 Results
2.3.1 Sediment grain size, Porosity, Carbon and Nitrogen contents and
Stable Isotope analysis
The sediment was dominated at both locations by fine silts, comprising 43–64.3% of the sediment mass, and sediment porosity ranged between 0.73 and 0.87 (Table 2-1). A clear difference was seen in organic carbon contents in sediments from the upper and lower estuary locations. The organic carbon contents averaged 8.1% and 4.1% at the upper and lower locations respectively. At the upper estuary stations values ranged between 7.7 and 8.8%, while at the lower end they ranged between 3.4 and 4.7%. Nitrogen content was generally low at all stations and ranged between 0.3 and 0.6%. The C/N molar ratio averaged 17.2 and 11.1 at the upper and lower estuary locations respectively (Table 2-1).
The δ13C values at all stations ranged between -22.4 and -19.7‰ over the study period. The most isotopically enriched station was recorded in July at LW. Generally the lower estuary stations were more enriched (-19.7 to -21.7‰) compared to the upper estuary stations (-21.7 to -22.4). The δ15N values ranged between 7.3 and 8.3‰ at the lower estuary stations while at the upper estuary stations they ranged between 4.1 and 5.9‰.
Table 2-1 Organic carbon and nitrogen as % dry wt. (%Corg and %Norg), stable
isotope values δ13C and δ15N, molar carbon:nitrogen ratios in organic matter (C% / N%), silt/clay fraction and porosity in surface sediments of the study locations
%Corg %Norg C/N δ13C δ15N %<63 µm Porosity
LW March July November 4.5 3.8 3.6 0.5 0.4 0.4 10.5 11.1 10.5 -21.7 -19.7 -20.3 7.7 7.6 8.3 - 51.5
- 0.73
LC March July November 4.7 4.6 4.5 0.5 0.5 0.5 11.0 10.7 10.5 -21.3 -20.3 -19.9 7.4 7.4 8.1 - 43.7
- 0.81
LE March July November 3.4 3.9 3.8 0.3 0.4 0.4 13.2 11.4 11.1 -20.0 -21.1 -21.0 7.3 7.4 8.0 - 53.3
- 0.80
UW March July November 7.7 7.8 7.7 0.6 0.6 0.5 14.9 15.2 18.0 -22.3 -22.3 -22.2 5.2 5.1 5.9 - 60.1
- 0.87
UC March July November 8.1 8.2 8.0 0.6 0.6 0.5 15.8 16.0 18.7 -21.7 -22.3 -22.3 4.6 4.7 5.3 - 64.3
- 0.83
UE March July November 8.2 8.8 8.7 0.5 0.6 0.5 19.1 17.2 20.3 -22.4 -21.9 -22.1 4.2 4.1 4.8 - 57.0
- 0.77
Average Lower Stations
4.1 0.4 11.1 -20.6 7.7 49.5 0.78
Average Upper Stations
8.1 0.6 17.2 -22.2 4.9 60.5 0.82
2.3.2 Fatty Acids
– 30.6% of total fatty acids, while PUFAs only accounted for 2.7–6.1% (Table 2-2). The only PUFAs detected were 20:4(n-6), 20:5(n-3) and 22:6(n-3), although minor amounts of C18 PUFA may have been present. The branched fatty acids, principally
iso- and anteiso-odd chained compounds were a relatively minor component of fatty acids ranging between 0.8–1.1 µg g-1 dry sediment and contributing 8.0 and 16.9% of the total fatty acids. The main branched fatty acids present were the bacterially derived fatty acids iso- and anteiso-15:0.
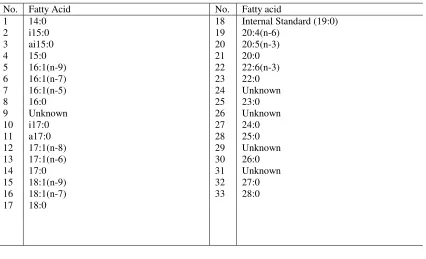
Figure 2-1 Fatty acid chromatogram of sediment at the Lower estuary. Peak numbers refer to table 2-2 below.
Table 2-2 Fatty acids from a representative sediment sample
No. Fatty Acid No. Fatty acid
1 14:0 18 Internal Standard (19:0)
2 i15:0 19 20:4(n-6)
3 ai15:0 20 20:5(n-3)
4 15:0 21 20:0
5 16:1(n-9) 22 22:6(n-3)
6 16:1(n-7) 23 22:0
7 16:1(n-5) 24 Unknown
8 16:0 25 23:0
9 Unknown 26 Unknown
10 i17:0 27 24:0
11 a17:0 28 25:0
12 17:1(n-8) 29 Unknown
13 17:1(n-6) 30 26:0
14 17:0 31 Unknown
15 18:1(n-9) 32 27:0
16 18:1(n-7) 33 28:0
17 18:0
10 20 30 40 50
0 10 20 30 40 50 60 70 80 90 Time (mins) Rel at ive A bunda nc e 8 18 5 1 19 16 9 20 23 27 30 33 2 3 4 7 6 10 11 12 13 14
15 17
21 22
24 25 26
28 29 31
[image:43.595.101.527.529.788.2]Table 2-3 Fatty acid composition (µg g-1 dry weight) at the lower and upper locations. ‘tr’, <0.05 µg g-1 dry weight ‘-‘ not detected
LE LC LW UE UC UW
Mar Jul Nov Mar Jul Nov Mar Jul Nov Mar Jul Nov Mar Jul Nov Mar Jul Nov
Saturated Acids <(n-C20)
12:0 tr tr tr tr 0.1 tr tr Tr tr 0.1 0.1 0.1 0.1 0.1 0.1 0.1 0.1 0.1 14:0 0.3 0.3 0.3 0.3 0.3 0.3 0.4 0.3 0.2 0.4 0.4 0.4 0.4 0.5 0.4 0.6 0.4 0.4 15:0 0.1 0.1 0.1 0.1 0.1 0.1 0.2 0.1 0.1 0.1 0.1 0.1 0.1 0.1 0.1 0.1 0.1 0.1 16:0 1.0 1.2 0.9 1.1 1.1 0.9 1.5 1.4 0.9 1.2 1.6 1.4 1.4 1.8 1.3 1.8 1.4 1.2 17:0 0.1 0.1 0.1 0.1 0.1 0.1 0.1 0.1 0.1 0.1 0.1 0.1 0.1 0.1 0.1 0.1 0.1 0.1 18:0 0.2 0.3 0.2 0.3 0.3 0.2 0.4 0.4 0.3 0.3 0.4 0.4 0.3 0.5 0.3 0.4 0.4 0.3 20:0 0.1 0.1 0.1 0.1 0.1 0.1 0.1 0.1 0.1 0.2 0.3 0.2 0.2 0.3 0.2 0.2 0.2 0.2
Sum 1.8 2.3 1.6 2.1 2.2 1.6 2.7 2.4 1.7 2.3 3.0 2.6 2.6 3.4 2.5 3.4 2.7 2.3
Saturated Acids >(n-C20)
22:0 0.2 0.3 0.2 0.3 0.3 0.2 0.2 0.3 0.2 0.7 1.2 0.9 0.8 1.2 0.8 0.8 0.9 0.6 23:0 0.1 0.1 tr 0.1 0.1 tr 0.1 0.1 Tr 0.3 0.4 0.3 0.3 0.4 0.3 0.3 0.3 0.2 24:0 0.3 0.5 0.3 0.5 0.5 0.3 0.5 0.5 0.3 1.1 1.8 1.3 1.3 2.0 1.4 1.3 1.4 1.1 25:0 0.1 0.2 0.1 0.2 0.2 0.1 0.2 0.2 0.1 0.8 1.2 0.9 0.9 1.3 0.8 0.9 0.9 0.6 26:0 0.3 0.4 0.3 0.4 0.4 0.3 0.4 0.5 0.3 0.8 1.3 0.9 0.9 1.5 1.0 0.9 1.1 0.8 27:0 0.1 0.1 0.1 0.1 0.1 0.1 0.1 0.1 0.1 0.2 0.4 0.3 0.3 0.5 0.3 0.3 0.4 0.2 28:0 0.2 0.3 0.3 0.3 0.4 0.2 0.3 0.4 0.3 0.4 0.9 0.6 0.6 1.1 0.7 0.6 0.8 0.6 30:0 0.2 0.3 0.2 0.3 0.3 0.2 0.3 0.3 0.2 0.1 0.3 0.3 0.2 0.4 0.2 0.2 0.3 0.2
Sum 1.5 2.2 1.6 2.0 2.3 1.5 2.1 2.3 1.5 4.4 7.5 5.6 5.3 8.3 5.4 5.3 6.0 4.5
Branched Saturated Acids
Sum 1.0 1.2 0.8 1.0 1.1 0.7 1.3 1.1 0.7 0.9 1.1 0.9 1.1 1.3 1.1 1.4 1.1 1.0
Monounsaturates
16:1(n-9) 0.1 0.2 0.1 0.1 0.1 0.1 0.1 0.1 0.1 0.1 0.1 0.1 0.1 0.1 0.1 0.1 0.1 0.1 16:1(n-7) 0.6 0.7 0.6 0.6 0.7 0.6 0.8 0.7 0.6 0.5 0.7 0.6 0.6 0.8 0.7 0.9 0.7 0.6 16:1(n-5) 0.2 0.2 0.1 0.2 0.2 0.1 0.2 0.2 0.1 0.1 0.2 0.2 0.2 0.2 0.2 0.2 0.2 0.2 17:1(n-8) tr 0.1 tr tr 0.1 tr 0.1 0.1 tr tr tr tr tr tr tr 0.1 tr Tr 17:1(n-6) 0.1 0.2 0.1 0.1 0.1 0.1 0.1 0.1 0.1 0.1 0.1 tr 0.1 0.1 0.1 0.1 0.1 0.1 18:1(n-9) 0.3 0.4 0.2 0.3 0.3 0.2 0.4 0.4 0.3 0.3 0.4 0.4 0.3 0.5 0.3 0.4 0.4 0.3 18:1(n-7) 0.5 0.8 0.5 0.5 0.6 0.4 0.8 0.8 0.5 0.4 0.6 0.5 0.5 0.7 0.6 0.8 0.7 0.6
Sum 1.8 2.4 1.7 1.9 2.1 1.6 2.5 2.5 1.6 1.5 2.1 1.8 1.8 2.5 2.1 2.7 2.1 1.9
Polyunsaturates
20:4(n-6) tr 0.1 tr tr 0.1 tr tr 0.1 tr 0.3 0.4 0.3 0.3 0.4 0.3 0.3 0.3 0.2 20:5(n-3) 0.2 0.2 0.3 0.2 0.2 0.2 0.3 0.2 0.2 0.1 0.1 0.2 0.1 0.2 0.2 0.3 0.1 0.2 22:6(n-3) 0.1 0.1 tr tr 0.1 tr 0.2 0.1 0.1 0.1 0.2 0.2 0.2 0.2 0.2 0.2 0.2 0.1
Sum 0.3 0.3 0.4 0.3 0.3 0.3 0.6 0.3 0.3 0.5 0.7 0.7 0.6 0.8 0.7 0.8 0.6 0.6
Total Fatty Acids 6.5 8.4 6.1 7.1 8.0 5.7 9.2 8.6 5.8 9.6 14.4 11.7 11.4 16.3 11.7 13.5 12.6 10.2
% Saturated Acids <(n-C20)
28.0 26.7 28.0 28.9 27.3 28.4 29.8 28.4 29.1 24.1 21.0 22.6 22.5 20.7 21.3 24.9 21.4 22.4
% Saturated Acids >(n-C20)
24.4 26.0 26.0 28.1 28.8 25.7 23.4 26.6 25.1 45.3 51.9 47.7 46.5 51.1 46.4 39.1 48.1 43.9
% Branched Saturated Acids
15.3 14.5 12.9 13.4 13.2 12.4 13.7 12.9 12.2 9.5 7.7 8.0 9.8 8.1 9.0 10.5 8.9 9.6
2.3.3 Alkanes
Odd and even numbered alkanes ranging between C19 and C31 were identified from
the surficial sediments (top 1 cm) at the upper and lower locations (Figure 2-2). Sediments at both locations showed a preference of long-chain (>C25) odd-numbered
alkanes and these peaked at C27. The total concentration of alkanes ranged between
142 and 343 ng g-1 at all sampling sites (Table 2-4). Long-chain odd-numbered alkanes (C25, C27, C29 & C31) ranged between 45.9 and 61.3% with an average of
53.5% of total alkanes at the lower estuary. In comparison, the upper estuary ranged between 54.9 and 62.8% and an average of 59.0% across all sampling periods.
Figure 2-2 Gas chromatogram of alkanes in sediment at the Upper estuary. Peak numbers refer to carbon chain length of the alkanes. The major peaks in this chromatogram are alcohols.
Time (mins)
10 20 30 40 50
0 20 80
40 60
R
el
at
ive
A
bunda
nc
e
C21
C27
C31
C29
C23
C25
Table 2-4 Distribution of odd-chain alkanes C19 – C31, total sum of alkanes (including
odd-numbered alkanes) and the percent contribution of odd-chained alkanes C25-31, at
both upper and lower locations sampled in March, July and November 2004.
Alkane Concentration (ng g-1) Total ∑C25,27, 29,31 (%)
C19 C21 C23 C25 C27 C29 C31 ng g-1
LW March July November 12.5 12.4 8.1 19.8 17.6 13.5 19.4 19.7 13.7 17.4 16.4 12.7 70.7 69.1 39.9 18.1 22.9 13.2 6.8 8.0 5.2 199.7 193.4 129.3 56.5 61.3 54.5 LC March July November 11.4 10.5 5.0 22.4 19.0 14.5 15.0 17.6 12.8 8.3 13.6 7.6 41.7 53.2 37.2 15.7 18.0 11.6 6.4 6.4 6.2 157.1 170.6 118.4 45.9 53.7 53.0 LE March July November 11.9 10.8 6.5 13.1 16.3 13.4 12.1 16.4 14.9 13.0 12.7 11.2 46.8 56.3 40.5 13.1 18.8 11.8 7.0 7.1 7.1 154.0 173.8 142.0 51.9 54.6 50.5 UW March July November 13.8 13.2 9.8 22.1 19.9 15.7 50.3 38.8 29.0 51.2 31.6 25.8 119.3 66.1 51.8 32.5 36.7 22.7 6.4 8.6 8.3 343.3 255.2 197.9 61.1 56.1 54.9 UC March July November 12.2 13.8 8.4 22.1 23.0 19.2 51.3 48.1 38.3 57.4 43.0 34.1 101.8 80.0 59.1 30.1 46.6 27.2 23.7 9.3 9.6 339.1 309.2 238.0 62.8 57.9 54.6 UE March July November 8.5 11.3 9.7 16.5 18.9 21.5 44.1 42.6 46.9 48.5 40.0 38.3 83.6 71.3 73.9 25.5 42.5 41.1 21.9 10.3 31.0 287.8 270.2 304.7 62.3 60.8 60.4 Average Lower Stations
9.9 16.6 15.7 12.5 50.6 16.1 6.7 160.2 53.5
Average Upper Stations
2.3.4 Fatty Alcohols
The fatty alcohols detected (Figure 2-3) are predominately even numbered
compounds ranging from C16 to C26. C28 and C30 were detected but not quantified as
they co-eluted with sterols. In all samples, the alcohols >C22 are more abundant than
those of short-chain homologues and typically maximised at C22 or C24. Total
concentrations of alcohols ranged between 1.1 and 1.8 µg g-1 at the lower estuary sites, and 2.3 and 4.3 µg g-1 at the upper estuary sites, an order of magnitude greater than total alkanes at the same sites (Table 2-5).
Time (min)
Figure 2-3 Gas chromatograms after saponification (as TMSi-ethers) of fatty alcohols. IS is the internal standard. Baseline rise in is due to column bleed at high temperatures.
Phytol was detected (Figure 2-3) in all samples. Absolute concentrations ranged between 0.2–0.4 µg g-1 dry sediment and averaging 0.3 µg g-1 at both locations across
Phytol
18:0 20:0
22:0 24:0
26:0
IS
10 20 30 40 50 20
40 80
60
R
el
at
ive
A
bunda
nc
e
16:0
28:0
concentrations found at the Upper estuary sites. No temporal or spatial trends were found at either location.
Table 2-5 Fatty alcohol composition (µg g-1 dry weight) at the lower and upper locations (note, C28:0 and C30:0 were identified but not quantified as they co-eluted
with sterols)
Phytol C16:0 C18:0 C20:0 C22:0 C24:0 C26:0 Total
Alcohol
Phytol/TOC
µg g-1 dw µg g-1 TOC
LW March July November 0.4 0.3 0.3 tr tr tr 0.1 tr tr 0.1 0.1 0.1 0.5 0.5 0.4 0.5 0.6 0.4 0.3 0.4 0.2 1.6 1.8 1.3 7.9 8.4 8.6 LC March July November 0.3 0.3 0.3 tr tr tr 0.1 tr tr 0.1 0.1 0.1 0.4 0.5 0.4 0.5 0.5 0.4 0.3 0.3 0.2 1.5 1.6 1.1 7.2 6.7 6.4 LE March July November 0.3 0.3 0.3 tr tr tr tr tr tr 0.1 0.1 0.1 0.4 0.5 0.4 0.4 0.5 0.4 0.2 0.3 0.2 1.2 1.6 1.1 8.5 7.9 7.9 UW March July November 0.4 0.4 0.3 0.1 0.1 tr 0.1 0.1 0.1 0.1 0.2 0.1 1.0 1.2 0.8 1.0 1.2 0.8 0.5 0.6 0.4 2.9 3.5 2.3 4.7 4.9 4.2 UC March July November 0.3 0.4 0.3 0.1 0.1 0.1 0.1 0.1 0.1 0.1 0.2 0.2 1.0 1.3 1.0 1.0 1.3 1.0 0.5 0.7 0.5 2.9 3.9 3.0 3.7 4.4 4.1 UE March July November 0.2 0.3 0.3 tr 0.1 0.1 0.1 0.1 0.2 0.1 0.2 0.2 0.9 1.3 1.4 0.9 1.4 1.4 0.4 0.7 0.7 2.6 4.1 4.3 2.5 3.1 3.6 Average Lower Stations
0.3 tr tr 0.1 0.4 0.5 0.3 1.4 8.0
Average Upper Stations
2.3.5 Sterols
The concentrations of sterol biomarkers (Figure 2-4) were generally similar throughout the study period (Table 2-7). Sterol concentrations were consistent between the sites at each location; however the two locations differed for some sterols. Sitosterol, sitostanol and lupeol were generally 2 –3 times more abundant at the upper location suggesting greater influence of terrestrial sources of organic matter. On the other hand, epi-brassicasterol (diatom marker) and dinosterol concentrations were generally higher at the lower location suggesting greater influence of algal material. The C27 stanol:stenol ratio ranged between 0.1 and 0.2 across both locations