doi:10.1016/j.biosystemseng.2005.03.006
IT—Information Technology and the Human Interface
Organic Farming Scenarios: Operational Analysis and Costs of implementing
Innovative Technologies
Claus G. Sørensen1; Niels A. Madsen2; Brian H. Jacobsen2
1Department of Agricultural Engineering, Danish Institute of Agricultural Sciences, Research Centre Bygholm, Schu¨ttesvej 17, 8700 Horsens, Denmark; e-mail of corresponding author: Claus.Soerensen@agrsci.dk
2Danish Research Institute of Food Economics, Rolighedsvej 25, 1958 Frederiksberg C, Denmark; e-mail: brian@foi.dk
(Received 21 May 2004; accepted in revised form 14 March 2005; published online 10 May 2005)
The objective of this study has been to design a number of farm scenarios representing future plausible and internally consistent organic farming enterprises based on milk, pig, and plant production and use these farm scenarios as the basis for the generation of generalised knowledge on labour and machinery input and costs. Also, an impact analysis and feasibility study of introducing innovative technologies into the organic production system has been invoked.
The labour demand for the production farms ranged from 61 to 253 h ha1
and from 194 to 396 h LU1 (LU is livestock units) for work in the animal houses. Model validation results showed that farm managerial tasks amount to 14–19% of the total labour requirement. The impact of introducing new technologies and work methods related to organic farming was evaluated using two innovative examples of weed control: a weeding robot and an integrated system for band steaming. While these technologies increased the capital investment required, the labour demand was reduced by 83–85% in sugar beet and 60% in carrots, which would improve profitability by 72–85% if fully utilised. Profitability is reduced, if automation efforts result in insufficient weed removal compared to manual weeding. Specifically, the benefit gained by robotic weeding was sensitive to the weed intensity and the initial price of the equipment, but a weeding efficiency of under 25% is required to make it unprofitable.
This approach demonstrates the feasibility of applying and testing operational models in organic farming systems in the continued evaluation and documentation of labour and machinery inputs.
r2005 Silsoe Research Institute. All rights reserved Published by Elsevier Ltd
1. Introduction
In Denmark, the potential for further conversion to organic farming in the next 8–10 years has been estimated as 15% of the cultivated area (Christensen & Frandsen, 2001). Previous projections have estimated a potential of 30% conversion in 10 years (Action Plan II, 1999). Most recently there has been a decline in the total organically farmed area in Denmark. Such discrepancies indicate that the premises on which these projections are based do not fully capture the factors that determine the rate of conversion. The deliberations of farmers to convert to organic farming range from pure production system considerations to conditions in the market (Christensen & Frandsen, 2001). By focusing on the
production system, there is aneed to get abetter understanding of the importance of the factors that determine the conversion rate and the economics of organic farming. The required increased knowledge on these factors include type of farm, labour situation and economic constraints.
Organic farming is generally considered more labour intensive than conventional farming, as it is assumed that chemical inputs are substituted by factors, such as increased management knowledge, new practices and techniques, capital and labour (Padel & Lampkin, 1994). However, the overall effect on labour and machinery usage when carrying out a transition from conventional to organic farming is difficult to predict. Most studies only provide aggregated data, even though labour and
1537-5110/$30.00 127 r2005 Silsoe Research Institute. All rights reserved
Published by Elsevier Ltd
machinery demand depend, in a complex way, on the type of production and different farm-specific factors such as crop selection, rotation systems, degree of mechanisation and degree of specialisation. The existing literature offers little detailed information about the use of evaluation tools capable of quantifying the labour and machinery demand at various farm levels as a function of internal and external organic farming conditions.
Studies of the labour and machinery usage in the transition from conventional to organic farming have generally assumed a significant increase in the labour demand and capital requirements (MacRaeet al., 1990;
Dubgaard, 1994; Klemola, 1997; Rapp, 1998). The increase in labour requirement has been assessed as ranging from 15 to 70% in plant production systems, due to, for example, more rotational crops, increased mechanical weed control and increased crop monitoring (MacRae et al., 1990). Limitations in the availability, quality and affordability of labour forces the organic farmer to discard the use of, for example, sugar beet in the rotation plan (Tersbøl et al., 2001). As aconse-quence, the farmer tends to adapt to the labour situation in a way that might not fulfil the biological demands of the nutrient cycle on the farm. The introduction of innovative technologies to reduce labour usage is seen as a way of obtaining more biological fulfilling crop rotations in organic farming.
With regard to organic vegetables, Danish growers spend 100–300 h ha1 on hand-weeding onions and carrots (Ascard, 1990; Melander & Rasmussen, 2001)
and a time allocation of up to 500 h ha1 is necessary under particularly weedy conditions. This commitment is financially demanding for organic growers, not only in terms of direct labour costs, but also in terms of the amount of time consumed for this single task, consider-ing all the other urgent tasks necessary durconsider-ing the growing season. Furthermore, it is difficult to acquire sufficient local labour to carry out the hand weeding.
Saunderset al. (1997)andDabbert (2001)emphasise that there is a lack of research data on ‘real’ farm system performance involving an identification and quantifica-tion of the technical constraints such as labour and machinery inputs. Also, the professional management principles of conventional farming are increasingly being adopted by organic farmers. This creates a need for acomprehensive knowledge base for the quantifica-tion and evaluaquantifica-tion of inputs of labour/technology resources in aholistic perspective (Tzilivakis & Lewis, 2001). The role of technology and knowledge is important, including the evaluation of the context of labour data as related to capital and farm type.
The objective of this study is to design and test farm scenarios representing possible organic farming
enter-prises based on milk, pig and plant production. Following the scenario construction, an integrated approach involving the determination of the technical production prerequisites, the establishment of labour budgeting and the derivation of labour profiles is invoked. The currently available knowledge base for operational analyses is supplemented with acquired labour data on managerial tasks and additional labour data on outdoor pig production. Also included is an impact analysis and feasibility study of introducing innovative technologies into the organic production system.
This approach demonstrates the feasibility of bringing operational models and cost estimations to bear on the evaluation and documentation of labour and machinery inputs in organic farm systems. If the image of organic farming is to be promoted to meet consumers’ expecta-tions for agood working environment, documentation of the conditions relating to the working environment must be available.
2. Methodology
2.1. Farm scenarios
A preliminary analysis forms the basis for the design of organic farm scenarios. Scenario planning involves combining factual data and expert evidence to create reasonable and credible scenarios envisioning possible future outcomes (Miller & Waller, 2003; van der Schilden, 2003). Participants in the scenario construc-tion included research experts and agricultural advisors capable of providing insight and perspective on the possible future of organic farming, while at the same time being aware of the current trends and key elements defining the organic farming environment. Through this interactive process, a technical and biological description of anumber of model farms representing different organic production systems (plant, cattle, pigs, mixed vegetables) was elaborated and the technical production characteristics detailed in Nielsen et al. (2003). The description involved organic farm types, which are plausible and internally consistent in terms of logically following what is currently known and expected in the near future (Account Statistics, 2001).
2.2. On-farm analyses
Empirical studies on managerial efficiency are scarce (Tripet al., 2002). In terms of allocating time and labour to the management of the technical and biological processes in agriculture, previous attempts have often included an arbitrary assessment of a particular addition to the manual labour input (Nielsen & Sørensen, 1993;
Achten, 1997;Sørensenet al., 2003). The data collection protocol for the managerial tasks in this study included afarm survey on 18 pre-selected groups of respondents divided evenly between organic crop, dairy and pig production. The surveys included targeted question-naires administered by an experienced researcher during each interview. The questionnaires included both closed and open-ended questions and followed established guidelines for surveys (Fink & Kosecoff, 1998). Efforts were made to avoid any bias in the process of interviewing farmers by introducing standardised lists of options to be answered. The results from the surveys allowed for the allocation of the labour requirements for tasks, such as production management in general, professional advancement, monitoring in the animal houses and the fields.
A survey of six organic pig farmers was conducted to determine the daily and periodic labour requirements for outdoor pig production.
The sampling method in both surveys was a combination of methods based on the assessments from agricultural advisers and the advantage of the respon-dent’s ability to identify the population under study. This non-random method is considered feasible in terms of the main objective being a pilot study engaged in an exploratory analysis (Lohr, 1999).
2.3. Analytical and modelling procedures
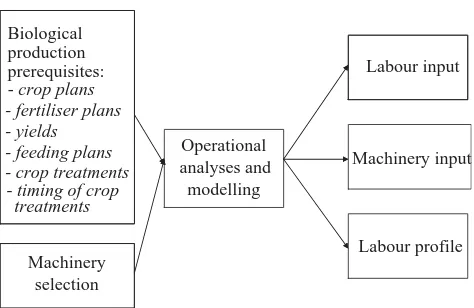
[image:3.595.55.544.97.363.2]Based on the information in Table 1, the model Ø-PLAN (Tvedegaard, 2002) was used to quantify a number of prerequisites constituting the basis for the subsequent operational analyses. This dynamic planning model evaluates the economic consequences during conversion to organic farming as a function of the production technical relations and prevailing organic provisions. By using selected parts of the model, many prerequisites including crop plans, fertiliser plans for animal manure, crop yields, feed production and feed Table 1
Farm scenario description (adapted fromNielsenet al., 2003)
Farm scenario
P0 P1y P2 P3 M1 M2 M3 S1
Crops, ha 10
Barley/undersown 10 10 20 25 10
Spring barley
Rye grass 05 05
Grass clover 05 05 60 75 60
Fallow grass clover 10
Oats/undersown 10 10 05 10
Sugar beet 04
Carrots 01
Peas 10 10 05
Triticale/catch crop 10 10
Potatoes 10 05 10
Lucerne 26
Fallow grass 04
Winter wheat 15
Spring wheat 25
Maize for silage 10 20 10
Barley/peas/whole crop 15 10 20 25 30
Lupin 10 10
Animals, number
Cows 10z 75 110 93
Sows 70
‘P’, ‘M’ and ‘S’ indicate arable, dairy, and pig producing scenarios, respectively.
plans, individual crop treatments and execution time for treatments were derived (Fig. 1). In addition, the machinery complement was selected and the capacity of individual machinery items was determined based on a requirement assessment fulfilling average timeliness thresholds as specified bySøgaard and Sørensen (2004). Upon quantification of all prerequisites, the technical operational analyses of expected labour requirements and machine performance were carried out using the generalised operations model DRIFT (Nielsen & Sørensen, 1993; Achten, 1997) supplemented with modules for specific operations (Sørensen et al., 2003;
Sørensen, 2003). These models enable the evaluation of operational performance to be adjusted to farm-specific conditions such as field size and shape, machinery capacity and transport distance. Specifically, the labour requirement for outdoor pig production was based on generalised data derived from a targeted study of six pilot farms (Nielsen et al., 2003). The model estimates detailed labour and machinery demands and evaluates the scheduling of the operations to be performed. The labour requirement may be estimated for an operation, aspecific enterprise, or the whole farm, given techni-cal–biological perquisites such as machinery system, machinery size, field size, crop yield and with the intention of only identifying system-related differences. According toNielsen and Sørensen (1993), an arbitrary addition covering the management tasks is included in the total labour requirement. This addition amounts to 157% of the direct operational work load (see Section 4.1).
The operational technical evaluation of the model farms includes both traditional working methods and innovative technologies such as band steaming and robotic weeding. The labour input, performance data and relevant economic parameters for these technologies are based on preliminary test data and expert
assess-ments. These data form the basis for analysing the costs and benefits. The economic consequences of implement-ing innovative technologies have been calculated usimplement-ing conventional methods for estimating depreciation, interest and maintenance of machinery (Madsen, 2003). The costs were distributed over a10-year-lifetime as well as over the number of hectares being treated by the machinery. A supplemental notion in terms of the maximum acquisition value(MAV) is also used to assign profitability, i.e. the capital amount that may be invested in the new technology to achieve the same net result as with the traditional technology.
3. Introduction of innovative technologies
The continued development of organic farming requires that innovative technologies are introduced in order to fulfil the perceived need for increased profes-sionalism, specialisation and use of rational production methods (Christensen & Frandsen, 2001). The technol-ogies for the organic sector need to be integrated and must conform to a number of sustainability factors instead of simply being redesigned conventional ma-chinery (Hagraset al., 2002). Reluctance to adopt novel technologies in organic farming requires special con-sideration (Bond & Grundy, 2001). Assuming full technology acceptance, two examples of technology adoption are envisaged, focusing on labour-intensive areas of organic production such as the substitution of manual weeding with mechanical weeding.
3.1. Band steaming for intra-row weed control
A new prototype of an integrated machinery system for weeding, which involves band steaming for intra-row weed control, has been developed (Melander et al., 2004). The soil is thermally treated in a narrow bandwidth of 8 cm around the crop rows at a depth of 5 cm prior to crop establishment in order to reduce weed seedling emergence. The subsequent sowing is carried out automatically following a track pre-set by the bandsteamer. The control of inter-row weeds is carried out by means of traditional hoeing. The system is intended to increase the yield of organically grown row crops such as outdoor vegetables, maize and sugar/ fodder beet.Table 2outlines the operational parameters for the system divided into two machinery sizes.
3.2. Robotic weeding
The ultimate objective of robotic weeding is to reduce the manual labour requirement for organic vegetables
Machinery selection
Operational
Labour input
Machinery input
Labour profile Biological
production prerequisites:
analyses and modelling - crop plans
- fertiliser plans - yields - feeding plans - crop treatments - timing of crop
[image:4.595.54.291.70.224.2]treatments
and sugar beet by 50–100% (Griepentrog & Søgaard, 2003). Current prototype technologies are based on a small autonomous vehicle, equipped with vision systems for precision guidance and for plant recognition, as well as active tools for weed removal (Astrand & Baerveldt,( 2002). In some cases, the technology requires that the positions of the individual seeds are logged prior to the weeding during sowing, as opposed to pure sensing of the target crop and weeds (Blasco et al., 2002). This approach enables the weeding robot to broadly recover the plant positions, while the precise position is retrieved by using computer vision, enabling weed removal close to the crop plant. Weeding between the rows is done using traditional hoeing, with or without automatic guidance (Tillettet al., 2002).
The operational capability of the weeding robot is based on experiences from the development of an autonomous platform (Bak & Jacobsen, 2004;Sørensen
et al., 2002) for monitoring in-field weeds as the basis for weed mapping, displaying the intensity and types of weeds distributed throughout the field. Based on an expected lower velocity of the weeding robot than when running in monitoring mode and experiences from the development of a weeding machine for maize ( Griepen-trog & Søgaard, 2003), the operational performance data shown inTable 3were derived.
[image:5.595.52.291.107.203.2]Recent research (Terawakiet al., 2003) indicates that the prerequisites with respect to velocity, and thereby area capacity, might be lower than the data presented in
Table 3. The economic consequences of such adeviation in capacity are discussed in Section 4.3.
4. Results and discussion
4.1. Labour and machinery input
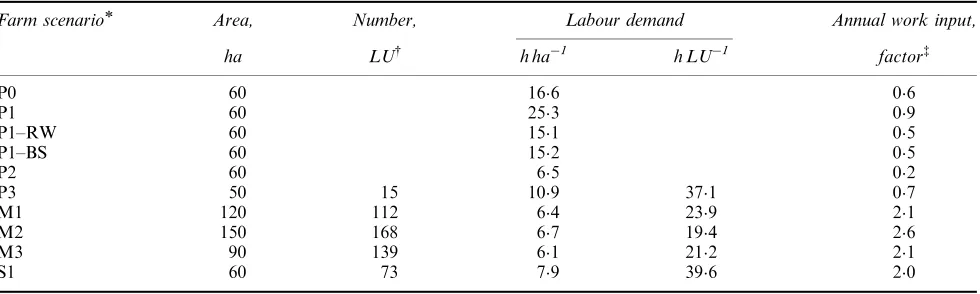
The labour demand was estimated for each of the farm scenarios (Table 4). The labour requirement is relatively high for the scenario P0. The considerable input of labour is caused by the growing of potatoes on 17% of the total adjoining area. In the case of farm scenario P1, potatoes, sugar beet, and carrots are grown on 83%, 67% and 17% of the area, respectively. The introduction of sugar beet and carrots to P1 increases the labour demand by 53% compared with P0 due to the manual weeding and the cleaning and sorting of the carrots. Maintaining the altered crop plan and introdu-cing robotic weeding and band steaming for weed management in sugar beet reduces the labour demand by 85% and 83%, respectively. The reduction in labour demand for carrots equals 60% for both technologies, because much manual labour must still be devoted to the cleaning and sorting of the carrots.
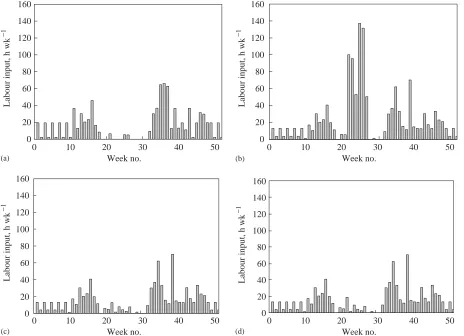
As observed, the amount of labour input differs considerably between the different production config-urations within the plant production system, and the allocation of the labour input during the year is also affected.Figure 2shows the labour profiles for the four farm scenarios (P0, P1, P1–RW and P1–BS). The scenario P1 demonstrates a high labour demand for manual weeding from week 22 to week 27 in contrast to the labour demand for P1–RW and P1–BS. In general, the farm scenarios P0, P1–RW and P1–BS reflect the seasonal pattern of work throughout the spring and autumn.
In the case of farm scenario P2, the labour require-ment is relatively low, caused by the fact that 50% of the area is cropped with lucerne and the rest is cropped with Table 2
Operational parameters and the price of a band steamer (adapted fromDyring, 2002)
Generator power
726 kW 1493kW
Capacity, ha h1 02 04
Bandwidth, cm 8 8
Velocity, km h1 11 22
Turning time, service time,etc., % 10 10
Investment,hy 40 323 56 152
The generator power is the rated output from the commercial
available steam generators.
[image:5.595.53.293.301.389.2]yCurrency conversion: 100h¼744 DKK.
Table 3
Expected performance data and price for a weeding robot
Performance Sugar beet Maize
Velocity, m s1 050 100
Field efficiency, % 80 80
Working width, cm (2 rows) 100 150 Area capacityy, ha h1
018 (net 023) 054 (net 068)
Service timez, % 15 15
Investmenty,h 26882
*,y
Field efficiency and area capacity are estimated by simulating the driving pattern on a2 hafield (100 by 200 m) using ageneralised operation model (Nielsen & Sørensen, 1993)
zThe service time includes labour allocated to maintain the robot operational analogous to traditional field operation (Nielsen & Sørensen, 1993).
y
cereals and fallow land. Since silo maize is included for scenario P3, supplemental labour input for weeding is required, causing a relatively high input of labour despite cropping mainly with cereals.
The yearly labour input for the arable farm scenarios ranges between 02 and 09 of the annual one-person work of 1665 h. The 60 ha arable farm scenarios are only capable of supplying part-time employment. In order to sustain a full-time employment more labour-intensive, and probably more profitable, crops are required.
The labour demand in the field is relatively low for the milk production scenarios, mainly because of the relatively large areas of grassland used for grazing and silage. No labour-intensive crops such as fodder beet are grown. The labour demand is fractionally higher at the pig farm, caused by the growing of silo maize and lupines and additional catch crops. The labour demand per livestock units (LU) in the livestock production systems ranges from 194 to 396 man hours, which provides the possibility of employing outside help and thereby makes it easier to achieve harmony in the overall workload.
The operations performed by a contractor in the various scenarios range from 7 to 65% of the overall field work (Table 5). The use of acontractor is more widely adopted in the milk production scenarios, where specialised machinery often is needed for manure handling, silage making, combine harvesting and other tasks with only seasonal utilisation. The high-cost operations allocated to contractors is evident from a comparison of the share of field work performed by contractors and total cost, since the share of total cost exceeds the share of field work.
4.2. Targeted model validation
The results of the empirical studies on the managerial efficiency for different organic production types indi-cated that the average management efforts ranged from 137 to 190% of the total labour input (Fig. 3) with a gross average of 157%. Statistical testing of the hypothesis that the management efforts for the different production systems are equal cannot be rejected
ðP4005Þ: Based on these findings, the gross average value of 157% is used in the labour input estimations.
4.3. Band steaming for intra-row weed control
The considerable reduction in labour demand con-tributes to asignificant improvement of the economic outcome. If the system is assumed to be a part of the machinery complement for farm scenario P1–BS, a decrease in gross margin by 270hha1
is expected, while an increase of 986hha1can be obtained if a contractor carries out the operation (Table 6). In the case of a contractor performing the operation the annual operat-ing hours are 135 h, while the actual utilisation for the farm scenario P1–BS only amounts to 125 h yr1. The potential operating hours of 135 h yr1 are based on Danish weather conditions, where during the seeding season an operational window of 15 days of 12 each and a workability of 75% is expected in a normal year (Madsen, 2003).
[image:6.595.54.544.97.244.2]A critical prerequisite with respect to the improved profitability is the efficiency with which the band steaming is able to replace manual weeding. If a weeding Table 4
Farm size, number of animal units (LU), labour demand and annual work input (Nielsenet al., 2003)
Farm scenario Area, Number, Labour demand Annual work input,
ha LUy h ha1 h LU1 factorz
P0 60 166 06
P1 60 253 09
P1–RW 60 151 05
P1–BS 60 152 05
P2 60 65 02
P3 50 15 109 371 07
M1 120 112 64 239 21
M2 150 168 67 194 26
M3 90 139 61 212 21
S1 60 73 79 396 20
‘P’, ‘M’ and ‘S’ indicate arable, dairy, and pig producing scenarios, respectively.
yLU, livestock unit.
efficiency of 75% is anticipated instead of 100%, which might be the case in specific practical implementations (Hansson & Svensson, 2004), the profitability is only increased by 642hha1
if the operation is carried out by acontractor (or 204hha1
using farm-owned machin-ery). A variation of 710% in capacity and price only affects the profitability by approximately 26hha1 and 13hha1, respectively. Despite the uncertainty, band steaming for intra-row weed control seems promising from an economic point of view if a high degree of utilisation is achieved. Even with a 6 yr lifetime on machinery, the band steaming is profitable for a contractor with 54 ha.
4.4. Robotic weeding
FromTable 7it appears that the weeding robot is less expensive to operate than the band-steaming system. Based on an expected price ofh 26882, atotal cost of
Labour input, h wk
−
1
0
0 10 20 30 40 50
20 40 60 80 100 120 140 160
Labour input, h wk
−
1
0 20 40 60 80 100 120 140 160
Labour input, h wk
−
1
0 20 40 60 80 100 120 140 160
Labour input, h wk
−
1
0 20 40 60 80 100 120 140 160
Week no.
0 10 20 30 40 50
Week no.
0 10 20 30 40 50
Week no.
0 10 20 30 40 50
Week no.
(a) (b)
[image:7.595.70.534.76.412.2](c) (d)
Fig. 2. Labour profiles for the different scenarios for arable production: (a) basic arable (P0); (b) alternative arable precision sown crops (P1); (c) alternative arable with robotic weeding (P1–RW); and (d) alternative arable with band steaming (P1–BS)
Table 5
Contractor share of field work and the total cost in the crop production system
Farm scenario Area, Contractor
ha %of field work %of total costy
P0 60 69 144
P1 60 84 113
P1–RW 60 140 146
P1–BS 60 159 124
P2 60 281 49
P3 50 219 245
M1 120 327 239
M2 150 290 205
M3 90 653 403
S1 60 194 223
‘P’, ‘M’ and ‘S’ indicate arable, dairy, and pig producing scenarios,
respectively.
[image:7.595.51.291.520.667.2]744hha1 could be expected for an organic farm scenario like P1–RW. A better utilisation of the capacity can be obtained if a contractor or a cooperative of organic farmers carries out the operation as more potential operating hours are utilised. In an average year, 20 days of acceptable weather conditions (of which 75% are workable) are expected, and if the weeding robot is able to operate for 12–20 h day1
, respectively, depending on the need for daylight, 180–300 h yr1
are available. The costs are reduced by 79 and 85% compared with manual weeding.
The profitability improvements shown inTable 7are based on a reduction of manual weeding by 100%. However, Nørremark and Griepentrog (2004) and
Lammet al. (2002)indicate that the weeding efficiency would presumably be lower and could easily be reduced by 20–25%. If an efficiency of 75% is assumed, the cost reduction is no longer around 80% but is reduced to 47–56% dependent on the degree of utilisation. Despite this reduction, the technology is still profitable to implement regardless of ownership. In an economic setting, the uncertainty of the purchase price is expected to significantly influence the profitability. Focusing on the uncertainty of costs and benefits by implementing robotic weeding, the weeding efficiency, weed intensity, purchase price of the machinery, utilisation and area capacity are key parameters. A reduction in the lifetime from 10 to 6 yr would change the total cost reduction from around 80 to 67%. In Fig. 4, the relationship between weeding efficiency and maximum acquisition value of the technology is illustrated at different levels of weed intensity and utilisation. The maintenance cost per hour is calculated as 004 pct of the acquisition value.
[image:8.595.55.290.73.239.2]FromFig. 4it can be seen that, even at a low level of weed intensity and utilisation, the maximum acquisition value for a rational organic farmer would be just under h40 000. However, in the case of high utilisation (300 h) Table 6
Cost of implementing band steaming for arable farm scenarios
4-row system/1493 kW
Owner Contractor
Utilisation
Annual operating hours, h yr1 125 135
Area, ha yr1 50 540
Benefit (manual weeding)
Workload, h ha1 900
Wage,hh1
153
Total benefit,hha1
1377
Variable cost Oil,hha1
117 Fixed cost
Tractor including driver,hha1
132
Maintenance,hha1 134
Depreciation and interesty,hha11385 128
Total cost,hha1 1647 390
Reduced costs, % 20 72
Cost estimations according toDyring (2002).
yThe lifetime is set at 10 yr and the interest is set at 4%.
Management effort, %
0 5 10 15 20 25 30
Arable Pig Dairy
[image:8.595.301.543.97.293.2]Fig. 3. Management effort measured as a fractional amount of labour to the total farm labour input for three different types of production; the error bars indicate 95% confidence intervals
Table 7
Cost of implementing robotic weeding for arable farm scenario
Own Contractor
Utilisation
Annual operating hours, h yr1 28 180 300
Area, ha yr1 50 162 270
Benefit (manual weeding) Workload, h ha1
90 Wage,hh1
153
Total benefit,hha1
1377
Variable cost Electricityy,hha1
75 Wages,hha1
129 Fixed cost
Maintenancez,hha1 603
Depreciation and interesty,hha1 663 204 122
Total cost,hha–1 744 285 203
Reduced costs, 46 79 85
The denoted area is the area treated twice yearly by the current
technology.
yThe power cost is set to 1
3hh1by analogy to the concept of a Christmas tree weeder (Blackmoreet al., 2002).
zMaintenance cost is estimated as 04 per thousand of the initial price per operating hour as compared with a modern combine harvester (Laursen, 1993).
y
[image:8.595.51.290.324.533.2]and high weed intensity, a maximum acquisition value of aroundh110 000 is estimated. If, on the other hand, the actually obtained working velocity is lower than expected, which might be the case under certain circumstances as indicated byTerawaki et al. (2003), a higher utilisation and weeding efficiency is required to pay off the expected investment cost.
5. Conclusion
Detailed operational analyses of organic farm scenar-ios formed the basis for predicting the labour and machinery input for all work operations in the field and the animal houses, selection of machinery types and the estimation of machinery sizes. The results show that the labour demand ranges from 61 to 253 h ha1 for fieldwork and from 194 to 396 h per livestock unit for work in the animal houses.
The introduction of sugar beet and carrots into a specific crop plan increases the labour demand by 53%, because of the manual weeding and the cleaning and sorting of the carrots. By maintaining an altered crop plan and introducing the new technologies such as robotic weeding and band steaming for weed manage-ment, the labour demand is reduced by 85 and 83%, respectively, for sugar beet production, and 60% when growing carrots.
The significant reduction in labour demand reduces the cost of growing carrots and sugar beet considerably. Assuming that the technologies are highly utilised, a gain in profitability of about 72–85% can be obtained. If the machinery utilisation is low (5 ha), the cost is reduced by 46% and increased by 20% in the case of robotic weeding and band steaming, respectively.
The cost reduction is 47–56% for both technologies if a weeding efficiency of only 75% is achieved instead of 100%, assuming high utilisation. Apart from the weeding efficiency and the level of utilisation, the profitability of both technologies is sensitive to weed intensity and the initial price in the case of robotic weeding. Assuming aweeding efficiency of 75%, yearly use of 180 h and low weed intensity, a maximum acquisition value of underh40 000 is estimated for the robotic weeding technology. In general, the analysis of the economic consequences of implementing the new technologies indicates that robotic weeding is preferable to the band steamer if uncertainty is neglected. There is more uncertainty related to robotic weeding, but even in the worst case the technology is still profitable.
Since the selected new technologies only reduce the inputs of labour and cost when growing beet and vegetables, a limited part of the organic sector is affected. As a consequence, the devised limited applica-tion of innovative technologies is not likely to cause a breakthrough in lowering of the production costs in the
Weeding efficiency, %
20 40 60 80 100
Maximum acquisition value,
[image:9.595.134.459.72.301.2]0 20000 40000 60000 80000 100000 120000 140000 160000
Fig. 4. The relationship between weeding efficiency and maximum acquisition value at different levels of weed intensity and utilisation. The horizontal black line indicates the expected capital requirements for a robotic weeder; the first number in the legend indicates whether the weed intensity is high (90) or low (40) measured by the number of hours that manual weeding would require,
and the utilisation is specified by the last number as either 180 or 300 h yr1
organic sector as a whole. However, the perspective is that other types of operations will be automated in a continued effort of having multiple operations giving the same promising results as obtained in this study. Also, automation presents itself as the only solution for farmers faced with labour unavailability for weeding special crops.
References
Account Statistics (2001). Account Statistics for Organic Farming. Series G, No. 6, Danish Institute of Agricultural and Fisheries Economics, Copenhagen, Denmark
Achten J(1997). Models, Methods and Database for Labour and Machinery in Agriculture. CIGR Working Group 17, Wageningen, The Netherlands
Action Plan II (1999). Developments in Organic Farming: English Summary. Ministry of Food, Agriculture and Fisheries, Danish Directorate for Development, Copenha-gen, Denmark
Ascard J(1990). Weed control in ecological vegetable farming. In: Proceedings of the Ecological Agriculture NJF Seminar 166 (Granstedt A, ed), pp 178–184. Scandinavian Associa-tion of Agricultural Scientists, Swedish University of Agricultural Sciences, Alnarp, Sweden
(
Astrand B; Baerveldt A-J(2002). An agricultural mobile robot with video-based perception for mechanical weed control. Autonomous Robots,13,21–35
Bak T; Jakobsen H(2004). Agricultural robotic platform with four wheel steering for weed detection. Biosystems Engi-neering,87(2), 125–136
Blackmore S; Have H; Keller B; Fountas S; Nielsen H; Theilby F (2002). Autonomous weeders for Christmas tree planta-tions—a feasibility study. (Have H, eds.). Pesticide Research No. 59, 2002, Danish Environmental Protection Agency Blasco J; Aleixos N; Roger J M; Rabatel G; Molto E (2002).
Robotic weed control using machine vision. Biosystems Engineering,83,149–157
Bond W; Grundy A C(2001). Non-chemical weed management in organic farming systems. Weed Research,41,383–405 Christensen J; Frandsen S E(2001). Økonomiske perspektiver
for økologisk jordbrug. [Economic perspectives for the development of organic farming.] Report No. 124, Danish Institute of Agricultural and Fisheries Economics, Copen-hagen, Denmark
Dabbert S (2001). Elements of a European action plan for organic farming. In: Proceedings of the European Con-ference: Organic Food and Farming, 10–11 May, Copenha-gen, Denmark
Dubgaard A (1994). Economics of organic farming in Den-mark. In: The Economics of Organic Farming: An Interna-tional Perspective (Lampking N H; Padel S, eds), pp 119–129. CAB International, Wallingford, Oxon, UK Dyring(2002). En foreløbig evaluering af de
markedsorienter-ede perspektiver for et integreret maskinsystem for termisk bandbehandling. [A preliminary evaluation of the market( oriented perspectives for an integrated machinery system for thermal band-heating.] Danish Institute of Agricultural Sciences and J. Drying International ApS
Fink A; Kosecoff J(1998). How to Conduct Surveys: A Step-by-Step Guide. Sage Publications, Thousand Oaks, USA
Garcia-Alegre M C; Ribeiro A; Garcia-Perez L; Martinez R; and Guinea D (2001). Autonomous Robot in Agriculture Tasks. In: 3rd European Conference on Precision Agricul-ture, June 2001, Montpellier, pp 25–30
Griepentrog H W; Søgaard H(2003). Robotic weeding in sugar beet. In: Proceedings of the NJF 22nd Congress, Nordic Agriculture in Global Perspective, 1–4 July, Turku, Finland Hagras H; Colley M; Callaghan V; Carr-West M (2002). Online learning and adaptation of autonomous mobile robots for sustainable agriculture. Autonomous Robots,13, 35–37
Hansson D; Svensson S E(2004). Steaming soil in narrow strips for intra-row weed control in sugar beet. In: Proceedings of the 6th EWRS (European Weed Research Society) Work-shop on Physical and Cultural Weed Control, Lillehammer, Norway, 8–10 March 2004, p 125
Klemola E (1997). Factors influencing labour usage in ecological farming. In: Proceedings of the XXVII CIOS-TA–CIGR Congress, Hungary, pp 185–190
Lamm R D; Slaughter D C; Giles D K(2002). Precision weed control system for cotton. Transactions of the ASAE,45(1), 231–238
Laursen B (1993). Omkostninger for landbrugsmaskiner i relation til maskinernes alder ogarlige anvendelse. [Machin-( ery costs as a function of machine age and yearly utilization.] Departmental Report. Danish Institute of Agricultural and Fisheries Economics, Copenhagen, Den-mark
Lohr S(1999). Sampling: Design and Analysis. Duxbury Press, USA
MacRae R J; Hill S B; Mehuys G R; Henning J(1990). Farm-scale Agronomic and Economic Conversion from Conven-tional to Sustainable Agriculture. EAP Publication 108, McGill University, Canada
Madsen N A(2003). En driftsøkonomisk analyse af økologisk jordbrug—med focus pany teknologi og regelændringer. [A( production economic analysis of organic farming—focusing on new technologies and legislative restrictions.] MSc Thesis, Agricultural Economics, Department of Economics and Natural Resources, The Royal Veterinary and Agri-cultural University, Copenhagen
Melander B; Jørgensen MH; Elsgaard L(2004). Recent results in the development of band steaming for intra-row weed control. In: Proceedings of the 6th EWRS (European Weed Research Society) Workshop on Physical and Cultural Weed Control, Lillehammer, Norway, 8–10 March 2004 Melander B; Rasmussen G(2001). Effects of cultural methods
and physical weed control on intrarow weed numbers, manual weeding and marketable yield in direct-sown leek and bulb onion. Weed Research,41,491–508
Miller K; Waller H G (2003). Scenarios, real options and integrated risk management. Long Range Planning, 36, 93–107
Nielsen V; Sørensen C G (1993). DRIFT: A Program for Calculation of Work Requirement, Work Capacity, Work Budget, Work Profile. Bulletin No. 53, National Institute of Agricultural Engineering, Horsens, Denmark
Nielsen V; Sørensen C G; Mortensen H S(2003). Scearieana-lyser vedr. driftsteknisk indsats i økologisk jordbrug. [Scenario analysis concerning labour and machinery input in organic farming.] Internal Report No. 188, Danish Institute of Agricultural Science, Horsens, Denmark Nørremark M; Griepentrog H W (2004). Analysis and
weeding. In: Proceedings of the 6th EWRS (European Weed Research Society). Workshop on Physical and Cultural Weed Control, Lillehammer, Norway, 8–10 March 2004 Padel S; Lampkin N(1994). Conversion to organic farming: an
overview. In: The Economics of Organic Farming: An International Perspective (Lampkin N H; Padel S, eds), pp 295–313. CAB International, Wallingford, Oxon, UK Rapp S (1998). Oko-Landbau schafft Arbeitsplatze! [Organic
farming provides employment.]. Bio-Land,2,34–35 Saunders C; Manhire J; Campbell H; Fairweather J (1997).
Organic farming in New Zealand: an evaluation of the current and future prospects including an assessment of the research needs. MAF Policy Technical Paper No. 97/13, MAF Wellington, New Zealand
Søgaard H; Sørensen C G (2004). A model for optimal selection of machinery sizes within the farm machinery system. Biosystems Engineering,89(1), 13–28
Sørensen C G (2003). A model of field machinery capability and logistics: the case of manure application. Agricultural Engineering International: CIGR Journal of Scientific Research and Development (Manuscript PM 03 004),V Sørensen C G; Jacobsen B H; Sommer S G (2003). An
assessment tool applied to manure management systems using innovative technologies. Biosystems Engineering,86, 315–325
Sørensen C G; Olsen H J; Ravn A P; Makowski P (2002). Planning and operation of an autonomous vehicle for weed inspection. In: ASAE Annual International Meeting/CIGR XVth World Congress, Chicago. Paper 02 1177. ASAE, St Joseph, Michigan, USA
Terawaki M; Kataoka T; Okamoto H; Hata S (2003). Development af automatic weeding thinner for sugar beet. 2003 ASAE Annual International Meeting, Las Vegas, USA, Paper number 03 3076
Tersbøl M; Mikkelsen G; Rasmussen I; Christensen S(2001). Preventive Measures Directed at Weeding Problems, Me-chanical Weed Removal and Effects on the Seed Pool. Danish Agricultural Advisory Centre, Danish Institute of Agricultural Sciences, Aarhus, Denmark
Tillett N D; Hague T; Miles S J (2002). Inter-row vision guidance for mechanical weed control in sugar beet. Computers and Electronics in Agriculture,33,163–177 Trip G; Thijssen G J; Renkema J A; Huirne R B M (2002).
Measuring managerial efficiency: the case of commer-cial greenhouse growers. Agricultural Economics, 27, 175–181
Tvedegaard N (2002). Organic Milk Production: Economic Analyses. Report No. 137, Danish Research Institute of Food Economics, Copenhagen, Denmark, [in Danish] Tzilivakis J; Lewis K A(2001). The development of software to
support planning conversion to organic agriculture. In: Proceedings of the Third European Conference on Precision Agriculture, 18–20 June, Montpellier, France, European Commission Agenda2000