A Dissertation on
“TWO YEARS STUDY OF WORK PLACE DEATHS AUTOPSIED IN GOVT. KILPAUK MEDICAL COLLEGE &HOSPITAL- CHENNAI”
Submitted to
THE TAMILNADU DR. M.G.R. MEDICAL UNIVERSITY
In partial fulfillment of the requirements
For the award of degree of
M.D. (FORENSIC MEDICINE) (Branch-XIV)
GOVERNMENT KILPAUK MEDICAL COLLEGE & HOSPITAL THE TAMILNADU DR. M.G.R. MEDICAL UNIVERSITY,
BONA-FIDE CERTIFICATE
This is to certify that this dissertation titled “TWO YEARS STUDY
OF WORK PLACE DEATHS AUTOPSIED IN GOVT. KILPAUK MEDICAL COLLEGE & HOSPITAL- CHENNAI” is a bona-fide original
work done by Dr. D.KARTHIK, Post graduate in Department of Forensic
Medicine Govt. Kilpauk Medical College Chennai, in partial fulfillment of the
regulations of the Tamilnadu Dr. M.G.R. Medical University for the award of
M.D. Degree in Forensic medicine (Branch XIV)
Dr. P. VASANTHAMANI, M.D., D.G.O., Dr. R. SELVAKUMAR, M.D., M.N.A.M.S, D.C.PSY, M.B.A., Professor & HOD,
DEAN Department of Forensic Medicine,
Govt. Kilpauk Medical College & Hospital, Govt. Kilpauk Medical College &
Chennai – 600 010. Hospital, Chennai – 600 010.
CERTIFICATE
This is to certify that this dissertation titled “TWO YEARS STUDY
OF WORK PLACE DEATHS AUTOPSIED IN GOVT. KILPAUK MEDICAL COLLEGE & HOSPITAL- CHENNAI” submitted by Dr. D.KARTHIK, is an original work done in the Department of Forensic Medicine, Government Kilpauk Medical College and hospital , Chennai in
partial fulfillment of regulations of The Tamil Nadu Dr. M.G.R. Medical
University, for the award of degree of M.D. (FORENSIC MEDICINE) Branch
– XIV, under my supervision during the academic period 2016-2019.
Dr. R. SELVAKUMAR M.D.,
Professor and HOD,
Department of Forensic Medicine,
Government Kilpauk Medical College and Hospital,
DECLARATION
I, Dr. D.KARTHIK, solemnly declare that the dissertation on “TWO
YEARS STUDY OF WORK PLACE DEATHS AUTOPSIED IN GOVT. KILPAUK MEDICAL COLLEGE & HOSPITAL- CHENNAI” is a
bona-fide work done by me during the period of January 2017 to December2017 at
Government Kilpauk Medical College and Hospital, under the expert
Supervision of Dr. R. SELVAKUMAR, M.D, Professor and Head of
Department of Forensic Medicine, Government Kilpauk Medical College,
Chennai. This thesis is submitted to The Tamil Nadu Dr .M.G.R. Medical
University towards partial fulfillment of the rules and regulations for the M.D.
degree examinations in Forensic Medicine to be held in April 2019.
Station: Chennai-10 Dr. D.KARTHIK,
ACKNOWLEDGEMENT
I wish to thank Dr. P. Vasanthamani, M.D.,D.G.O., M.N.A.M.S,
D.C.Psy, M.B.A., Dean, Govt. Kilpauk Medical College and Hospital, Chennai.
With sincere gratitude and I wish to acknowledge the expert guidance
and suggestions of my Professor and HOD, Dr.R.Selvakumar, M.D., without
whose permission and guidance this study would not have been possible.
I am deeply indebted and grateful to my Assistant Professors,
Dr.G.Manigandaraj, M.D., Dr.S.Karthigadevi, M.D., Dr.K.V.Vinoth,M.D., Dr.J.Visnu Rajkumar, M.D., Dr.R.Rajesh, M.D., Dr.S.Siva Kumar, M.D.,
for their valuable support and guidance and continuous encouragement
rendered at every stage of this study.
I wish to thank tutors, Dr.I.Jithender Singh and Dr.S.Devasena for their constant support.
I am deeply indebted to and highly grateful to my seniors,
Dr.S.Shankar, M.D., Dr.S.Sylvia, M.D., Dr.N.Karthikeyan, Dr.V.Suresh Kumar, M.D., as well as to my colleagues, Dr.J.S. Raghu deepan, Dr.M.Jeevagan, Dr.M.Shaik Abdul Sameer, Dr.P.Chandrasekar, Dr.A.Ahamed Sheikh without whom this work would not be in the present shape. I also wish to thank all the non-teaching staffs and mortuary technicians
CERTIFICATE - II
This is to certify that this dissertation work titled “TWO YEARS
STUDY OF WORK PLACE DEATHS AUTOPSIED IN GOVT. KILPAUK MEDICAL COLLEGE & HOSPITAL- CHENNAI” of the
candidate Dr. D.KARTHIK, with registration Number 201624151 for the
award of M.D. degree in the branch of FORENSIC MEDICINE. I personally
verified the urkund.com website for the purpose of plagiarism Check. I found
that the uploaded thesis file contains from introduction to conclusion and result
shows 3 percentage of plagiarism in the dissertation.
ABSTRACT Aims & objectives of the study:
1. To find out the most common cause of death encountered in occupation –
related deaths.
2. To find out the most common age group involved in occupation related deaths.
3. To find out the most predominant sex involved in occupation related deaths.
4. To find out the risk factors in occupation – related deaths.
5. To find out the manner of death.
Methodology:
The present work is a cross-sectional & descriptive study of occupational
deaths autopsies conducted in the Department of Forensic Medicine & Toxicology,
Govt. Kilpauk Medical College & Hospital between January 2016 and December
2017.
Results:
Maximum deaths occurred in the age group of 21-30 years (35 Cases) Which
constitutes 28% among the total deaths followed by age group between 41-50 Years
(29) Cases which constitutes to 23.1% of the total , Most predominant sex affected is
Males (112 Cases) which constitutes 88.9% of the total deaths. Most Predominant
religion belongs to Hindu Religion (107 Cases) which constitutes 85% of the total
deaths followed by Christian (8 Cases) and Muslim (8 Cases) religion which
constitutes 6% each of the total deaths, Regarding Marital Status number of deaths
was observed more in married a person (75 Cases) who constitutes 59.5% of the total
deaths. Regarding Socio Economic Status. Higher number of deaths were observed in
Lower Middle Class (15 Cases) which constitutes 11.9% of the total deaths, Number
of brought dead cases (80 Cases) was higher which constitutes to 63.5% of the total
deaths and treated cases were (46 Cases) which constitutes 36.55 of the total deaths.
Pertained to period of survival 13 deaths occurred in 6-12 hours which constitutes
28.2 % of the total death followed by 10 deaths in 12-24 hors which constitutes
21.7% of the total deaths, Most of the deaths occurred during 12.01 P.M to 6.00 P.M
(56 Cases) which constitutes 44.44% of total deaths followed by 6.01 A.M to 12.00
P.M (29 Cases) which constitutes 23.02% of the total deaths. Most of the deaths
occurred in summer season (63 Cases) which constitutes 50% of the total deaths
followed by rainy (24 Cases) which constitutes 19% of the total deaths. Most of the
deaths were observed in skilled labourers (hard working) (26 Cases) which constitutes
20.8% of the total deaths followed by Cooly (25 Cases) which constitutes 19.4% of
the total deaths, Regarding the method of occurrence more number of deaths were
seen in electric shock (46 Cases) which constitutes 36.6% of the total deaths followed
by match stick factory accidental burns (37 Cases) Which constitutes 29.2% of the
total deaths. Regarding Time Since Death less than 6 hours was high (48 Cases)
which constitutes 38.1% of the total deaths followed by 12-24 hours (36 Cases) which
constitutes 28.5 % of the total deaths. Regarding the Cause of Death Shock and
Haemorrhage due to multiple injuries sustained (33 Cases) was high which constitutes
26.1% of the total deaths followed by septicaemic shock (32 Cases) which constitutes
25.3% of the total deaths, Regarding the manner of death (122 Cases) were accidental
deaths which constitutes 96.8% of total deaths followed by natural deaths (3 Cases)
which constitutes 2.4% of the total deaths. followed by septicaemic shock (32 Cases)
Keywords: occupational fatality construction sector ,Industrial hazards, ". Routine disasters, methyl iso cyanate choking, Psychological problems Chasnala Disaster,
TABLE OF CONTENTS
1. Introduction... 1
2. Aims and Objectives... 5
3. Review of Literature... 6
4. Material and Methods... 27
5. Inclusion criteria...…... 27
6. Exclusion criteria... 27
7. Observations and Results... 29
8. Photographs... 46
9. Discussion... 50
10.Summary... 56
11.Conclusion………... 58
12.Future research... 65
13.Bibliography... 66
14.Annexure I: Proforma... 90
15.Annexure II: Ethical committee clearance certificate ... 91
16.Annexure III: Plagiarism certificate... 92
1
INTRODUCTION
According to the International Labour Organization (ILO), more than 2.3 million workers die every year as a result of occupational accidents or work-related diseases. To put this number in perspective, across the world 167,000 people died in armed conflicts in 2015, according to the latest edition of the IISS Armed Conflict Survey. In addition to this astounding number, each year 313 million accidents occur on the job resulting in extended absences from work.1
The ILO estimates that the annual cost to the global economy from accidents and work-related diseases alone is a staggering $3 trillion. Moreover, a recent report suggests the world‘s 3.2 billion workers are increasingly unwell, with the vast majority facing significant economic insecurity: 77% work in part-time, temporary, ―vulnerable‖ or unpaid jobs.1 What‘s more, the labour force is growing older and less healthy: 52% is overweight or obese and 38% suffer from excessive pressure on the job. In addition to the social and human costs of health problems and fatalities, the cumulative economic burden caused by a lack of wellness at work is enormous for both businesses and the global economy. This is especially true when productivity losses are added to direct medical expenses.3
2
the economy more than $2.2 trillion a year. In 2013, Klaus Schwab, Founder and Executive Chairman World Economic Forum, introduced the Forum‘s Workplace Alliance Report. He pointed out the importance and economic implications of workplace wellness: ―Employers have a great responsibility to nurture employee resilience; there is strong evidence that a healthy workforce is vital to a country‘s competitiveness, productivity and well-being. Over 50% of the working population spend the majority of their time at work, so the workplace provides a unique opportunity to raise awareness, as well as guide and incentivize individuals to develop healthier lifestyles. This has proven to have a multiplier effect, as workers integrate health and well-being into their families and communities.‖3
The causes of safety and health problems vary by sector. In the urban economy, for example, approximately one in six fatal workplace accidents reported globally takes place in the construction sector. This is mainly because of the intrinsically hazardous nature of this work, the challenging locations of construction sites, changing work environments and high rates of staff turnover. There are also health problems associated with building activities, such as musculoskeletal disorders and exposure to hazardous substances, such as asbestos.3
Construction is the most dangerous land-based work sector. The leading
safety hazards on site are falls from height, motor vehicle crashes, excavation
3
Some of the main health hazards on site are asbestos, solvents, noise, and
manual handling activities. Falls from heights is the leading cause of injury in
the construction industry. Protection is also required when the employee is at
risk to falling onto dangerous equipment. Fall protection can be provided by
guardrail systems, safety net systems, personal fall arrest systems, positioning
device systems, and warning line systems. 3
All employees should be trained to understand the proper way to use
these systems and to identify hazards. The employee or employer will be
responsible for providing fall protection systems and to ensure the use of these
systems. Motor Vehicle Crashes are another major safety hazard on
construction sites. It is important to be safety cautious while operation motor
vehicles or Equipment on the site. 3
Motor vehicles shall have a service brake system, emergency brake
system, and a parking brake system. All vehicles must be equipped with an
audible warning system if the operator chooses to use it. Vehicles must have
windows and doors, power windshield wipers, and have a clear view of site
from the rear window. Occupational factors make an important contribution to
the global burden of disease.4
Work-related morbidity and mortality not only results in suffering and
hardship for the Worker and his or her family, but also it adds to the overall
cost to society through lost productivity and increased use of medical and
4
national product in different studies in different countries. Construction
labourers face highest risk at workplace.4
Construction sites are increasingly unsafe in Chennai city, with the
department of factories, boilers, industrial safety and health recording one
death a month at these places. Workers face various hazards at workplaces. In
the recent times there is a lot of construction activity in the city, including
Metro rail, flyovers and multi storage buildings. Workers employed are from
5
AIMS & OBJECTIVES OF THE STUDY
1. To find out the most common cause of death encountered in occupation
– related deaths.
2. To find out the most common age group involved in occupation related
deaths.
3. To find out the most predominant sex involved in occupation related
deaths.
4. To find out the risk factors in occupation – related deaths.
6
REVIEW OF LITERATURE
An occupational fatality is a death that occurs while a person is at work
or performing work related tasks. Occupational fatalities are also commonly
called ―occupational deaths‖ or ―work-related deaths/fatalities‖ and can occur
in any industry or occupation.19
The mortality rate at workplaces in India has been increasing, the British
Safety Council has said at the opening of its first overseas office in the city to
raise awareness of the importance of health and safety. The British Safety
Council (India) LLP will be based in Lower Parel and offer services like
auditing, training, e-learning for the Indian market. The services will be offered
in partnership with NIST Institute, a leading safety training and consultancy
company.19
The council, which has been serving India for the past 30 years, said that
a recent report on workplace fatalities in the country showed that about 48,000
workers died due to occupational accidents. The report said that 38 fatal
accidents took place every day in the construction sector alone. In contrast, the
U.K. reported 137 incidents in 2016 in all employment sectors. A statement
issued by the British Safety Council said, ―In a country with a population of
1.25 billion, around 80% of workers of the estimated 465 million- strong
workforce are not protected by the existing health and safety legal framework.‖
Mike Robinson, chief executive of the British Safety Council, said, ―The
7
India. The death rate is 10 times higher in India as compared with the U.K. The
construction sector is where the focus needs to be.‖ Mr. Robinson said rural
areas covered a huge portion of the country and to reach out to the workers
there they had to start with the largest urban cities and businesses19
Major Industrial Disasters in India
Successful management of disasters mainly requires that society put into
price the ample stocks of knowledge and experience about them that already
exist. Surprises, which confound both expert and lay expectants, are quite
different and much less understood. They include disasters like Bhopal and
Chernobyl and Minamata events or their consequences or both - that lie outside
the realm of previous experience. Because surprises are unprecedented events,
it is difficult to design specific anticipatory measures of the kind that have
proved successful in reducing routine hazards.24
Industrial hazards are threats to people and life-support systems that
arise from the mass production of goods and services. When these threats
exceed human coping capabilities or the absorptive capacities of environmental
systems they give rise to industrial disasters. Industrial hazards can occur at
any stage in the production process, including extraction, processing,
manufacture, transportation, storage, use, and disposal. Losses generally
involve the release of damaging substances (e.g. chemicals, radioactivity and
genetic materials) or damaging levels of energy from industrial facilities or
8
explosions, fires, spills, leaks, or wastes. During the last several decades there
has been a growing awareness of the expanding risks and consequences of
major industrial disasters. This is reflected in official statistics, mass media
reports, and the appearance of new public institutions that address the
problem.24
The growth of industrial accident prevention companies and the
blossoming of literature on industrial risk assessment are other expressions of
the same trend. Industrial disasters are not simply safety problems that need to
be resolved: they also have wider significance because they offer important
opportunities to learn about the "goodness of fit" between society, technology,
and environment and about how that fit can be strengthened or weakened by
unexpected events. 24
This is the kind of information that will be invaluable to humanity
during an era of deep and far-reaching societal and environmental change.
However, if we are to make optimal use of such opportunities it may be
necessary to modify the way we think about industrial disasters. It is customary
to view industrial disasters as "extreme events" that are different mainly in
degree from more mundane disruptions to which industries and society have
become adjusted. 24
It is me to make a clear distinction between two types of industrial
9
understood by experts and susceptible to management using long established
principles and practices. They constitute the great majority of threats too.
The Bhopal Disaster:
It is also referred to as the Bhopal gas tragedy, was a gas leak incident in
India, considered the world's worst industrial disaster. It occurred on the night
of 2–3 December 1984 at the Union Carbide India Limited (UCIL) pescide
plant in Bhopal, Madhya Pradesh.
Over 500,000 people were exposed to methyl iso cyanate (MIC) gas and
other chemicals. The toxic substance made its way in and around the shanty
towns located near the plant. Estimates vary on the death toll. The official
immediate death toll was 2,259. The government of Madhya Pradesh
confirmed a total of 3,787 deaths related to the gas release. A government
affidavit in 2006 stated the leak caused 558,125 injuries including 38,478
temporary injuries and approximately 3,900 severely and permanently
disabling injuries. The cause of the disaster remains under debate.27
The Indian government and local activists argue slack management and
deferred maintenance created a situation where routine pipe maintenance
caused a backflow of water into a MIC tank triggering the disaster. Union
Carbide Corporation (UCC) contends water entered the tank through an act of
sabotage. In November 1984, most of the safety systems were not functioning
and many valves and lines were in poor condition. In addition, several vent gas
10
the pipes. Another issue was that Tank 610 contained 42 tons of MIC, more
than safety rules allowed for. During the night of 2–3 December 1984, water
entered a side pipe that was missing its slip-blind plate and entered Tank E610
which contained 42 tons of MIC. A runaway reaction started, which was
accelerated by contaminants, high temperatures and other factors. The reaction
was sped up by the presence of iron from corroding non-stainless steel
pipelines. The resulting exothermic reaction increased the temperature inside
the tank to over 200 °C (392 °F) and raised the pressure. This forced the
emergency vent of pressure from the MIC holding tank, releasing a large
volume of toxic gases. About 30 metric tons of methyl isocyanate (MIC)
escaped from the tank into the atmosphere in 45 to 60 minutes. The gases were
blown in south eastern direction over Bhopal. The initial effects of exposure
were coughing, severe eye irritation and a feeling of suffocation, burning in the
respiratory tract, blepharospasm, breathlessness, stomach pain and vomiting.27
People awakened by these symptoms fled away from the plant. Those
who ran inhaled more than those who had a vehicle to ride. Owing to their
height, children and other people of shorter stature inhaled higher
concentrations. Thousands of people had died by the following morning.
Primary causes of deaths were choking, reflexogenic circulatory collapse and
pulmonary oedema. Findings during autopsies revealed changes not only in the
lungs but also cerebral oedema, tubular necrosis of the kidneys, fay
11
up to 300% and neonatal mortality rate by around 200%. insufficiency, cardiac
insufficiency (cor pulmonale), cancer and tuberculosis.27
Chasnala Mining Disaster 1975:
The Chasnala Mine Disaster occurred on the evening of 27 December
1975, and killed 372 miners in Dhanbad, India. On 27 December 1975, an
explosion rocked the Chasnala Colliery in Dhanbad, India. The explosion was
most likely caused by sparks from equipment igning a pocket of flammable
methane gas. Even a small spark can ignite the surges of gas that may suddenly
fill a mine. Clouds of coal dust raised by the explosion and accompanying
shock wave contribute to these sorts of mine explosions, making the flames
self-sustaining. The Chasnala Colliery explosion was so severe that the mine
collapsed, and millions of gallons of water from a nearby reservoir rushed into
the pits at a rate of seven million gallons per minute. Those miners who weren't
killed in the blast now found themselves trapped under debris, or drowned as
the water quickly filled the mine. Rescue workers connoted their efforts to dig
out bodies and survivors until 19 January 1976. 27
Sadly, there were no survivors, and most of the bodies were never
recovered. The local workers' union claimed a total death toll of almost 700
people. The government's official death toll, however, is 372. The Chasnala
Colliery's records were poorly kept, and many bodies were never recovered, so
there is no way of knowing how many miners actually perished in the Chasnala
12
immediate aerate, the plant was closed to outsiders (including UCC) by the
Indian government. The initial investigation was conducted by the Council of
Scientific and Industrial Research (CSIR) and the Central Bureau of
Investigation.27
Union Carbide organized a team of international medical experts, as
well as supplies and equipment, to work with the local Bhopal medical
community, and the UCC technical team began assessing the cause of the gas
leak. The health care system immediately became overloaded. Medical staffs
were unprepared for the thousands of casualties. Doctors and hospitals were not
aware of proper treatment methods for MIC gas inhalation. Long-term health
effects some data about the health effects are still not available. A total of 36
wards were marked by the authorities as being "gas affected," affecting a
population of 520,000. Of these, 200,000 were below 15 years of age, and
3,000 were pregnant women.27
The official immediate death toll was 2,259, and in 1991, 3,928 deaths
had been officially certified. The government of Madhya Pradesh confirmed a
total of 3,787 deaths related to the gas release. Later, the affected area was
expanded to include 700,000 citizens. A government affidavit in 2006 stated
the leak caused 558,125 injuries including 38,478 temporary injuries and
approximately 3,900 severely and permanently disabling injuries. A number of
clinical studies are performed. The quality varies, but the different reports
13
Chronic conjunctivitis, scars on cornea, corneal opacities, early cataracts
Respiratory tracts: Obstructive and/or restrictive disease, pulmonary fibrosis,
aggravation of TB and chronic bronchitis Neurological system: Impairment of
memory, finer motor skills, numbness etc. Psychological problems.
Post traumatic stress disorder (PTSD) Children's health: Peri- and
neonatal death rates increased. Failure to grow, intellectual impairment etc.
Missing or insufficient fields for research are female reproduction,
chromosomal aberrations, cancer; immune deficiency, neurological sequelae,
post traumatic stress disorder (PTSD) and children born are the disaster.27
Jaipur Oil Depot Fire, 2009:
The Jaipur oil depot fire broke out on 29 October 2009 at 7:30 PM (IST)
at the Indian Oil Corporation (IOC) oil depot's giant tank holding 8,000
kilolitres (280,000 cu ) of oil, in Sitapura Industrial Area on the outskirts of
Jaipur, Rajasthan, killing 12 people and injuring over 200. The blaze connoted
to rage out of control for over a week is it started and during the period half a
million people were evacuated from the area. The oil depot is about 16
kilometres (9.9 mi) south of the city of Jaipur. The incident occurred when
petrol was being transferred from the Indian Oil Corporation's oil depot to a
pipeline. There were at least 40 IOC employees at the terminal, situated close
to the Jaipur International Airport) when it caught fire with an explosion. The
Met department recorded a tremor measuring 2.3 on the Richter scale around
14
windows nearly 3 kilometres (1.9 mi) from the accident site. The Chasnala
Disaster inspired the 1979 film Kaala Pahar, directed by Yash Chopra. The
Chasnala Disaster was one of the worst in Indian history. The nationalization of
Indian mining since then has contributed to a significant decrease in the
incidence of mining accidents in that country.27
The fire was a major disaster in terms of deaths, injury, loss of business,
property and man-days, displacement of people, environmental impact in
Jaipur. As per eyewitnesses having factories and hotels around Indian Oil's
Sitapura (Jaipur) Oil Terminal they felt presence of petrol vapour in the
atmosphere around 4:00 p.m. on 29 October 2009. Within the next few hours
the concentration of petrol vapour intensified making it difficult to breathe. The
Ayush Hotel in the vicinity of the terminal asked all its guests to vacate the
Hotel to avert any tragedy. Adjacent to the Terminal wall was the workshop of
Morani Motors (P) Limited whereas per eyewitnesses the Cars parked on the
roof top were thrown up in Air to about 10 feet and 35 new Hyundai brand cars
were completely damaged. The police, civil administration and fire emergency
services were oblivious of the situation developing in Indian Oil Terminal.
Around half past six the staff in the terminal had contained the leak and flow of
petrol panicked and reported the matter to nearby Sanganer Sadar Police Staon.
Within the next 30 minutes the local police chief and District Collector were on
the spot along with Indian Oil general manager, but with no plan to deal with
the situation. The nearby industries, which were running second ships, were
15
explosion broke out engulfing the leaking petrol tank and other nearby petrol
tanks with cernuous fire with flames rising 30–35 m (98–115 ) and visible from
a 30 km (19 mi) radius. The traffic on adjacent National Highway No. 12 was
stopped leading to a 20 km (12 mi) long traffic jam. The Jaipur International
Airport is just 5 km (3.1 mi) away from the accident site. Both the Army and
experts from Mumbai were employed on 30 October 2009 to contain the fire,
which started when an oil tanker caught fire at the depot in the Sitapura
Industrial Area. The district administration disconnected electricity and
evacuated nearby areas to limit the damage.27 The fire sill raged on 31 October
2009, in the Indian Oil Corporation Depot, at Jaipur, are a defective pipe line
leak that set fire to 50,000 kilolitres (1,800,000 cu ) of diesel and petrol out of
the storage tanks at the IOC Depot. By then, the accident had already claimed
11 lives and seriously injured more than 150. The District Administration and
Indian Oil Corporation had no disaster management plan to deal with this kind
of calamity. The local fire officers were ill equipped to deal with fire accidents
of this magnitude. They remained onlookers and no efforts were made to
breach the terminal wall to get closer to kerosene and diesel tanks to cool them
with water jets.27
Korba Chimney Collapse:
The 2009 Korba chimney collapse occurred in the town of Korba in the
Indian state of Chhatisgarh on 23 September 2009. It was under construction
were under contract for the Bharat Aluminium Co Ltd (BALCO). Construction
16
workers who had been taking shelter from a thunderstorm, at last 45 deaths
were recorded.27
Plans specify a 275-metre (902) chimney for the construction of a
thermal power plant by BALCO, which is owned by Vedanta Resources. The
incident happened during extreme weather conditions involving lightning and
terrene rainfall.
Workers sought shelter from the rain in a nearby store room, and a
lightning strike at approximately 16:00 brought the chimney down on top of
them. A rescue attempt was initiated following the collapse. Ongoing rain
obstructed efforts to retrieve the trapped workers. At least seven of the
wounded were hospitalised. An investigation is ongoing to determine the cause
of the collapse. BALCO initially did not discussed the incident at length, stung
only that ‗there is an accident and some people are injured‘ claiming to be too
busy with the rescue effort to make a longer statement. The state government
believes that BALCO had been "overlooking security aspects". In November
2009, the project manager from GDCL was arrested, as well as three officials
from Vedanta Resources which manages BALCO. Later the National Institute
of Technology (NIT) Raipur observed that the materials were of substandard
quality and technically faulty in design. NIT also concluded that there was
improper water curing and that soil at the site was not up to code. Addionally,
17
Mayapuri Radiological Incident:
In April 2010, the locality of Mayapuri was affected by a serious
radiological accident. An AECL Gammacell 220 research irradiator owned by
Delhi University since 1968, but unused since 1985, was sold at auction to a
scrap metal dealer in Mayapuri on February 26, 2010. The orphan source
arrived at a scrap yard in Mayapuri during March, where it was dismantled by
workers unaware of the hazardous nature of the device. The cobalt-60 source
was cut into eleven pieces. The smallest of the fragments was taken by Ajay
Jain who kept it in his wallet, two fragments were moved to a nearby shop,
while the remaining eight remained in the scrap yard.
All of the sources were recovered by mid-April and transported to the
Narora Atomic Power Station, where it was claimed that all radioactive
material originally contained within the device was accounted for. The material
remains in the custody of the Department of Atomic Energy.27
One of the main business at Mayapuri is the recycling of metal scraps
and sale of salvage vehicle parts. It is, arguably, the biggest market for used
automotive and industrial spare parts in India. Many traders from all over India
come here to sell or purchase old auto parts. Many small workshops specialized
in different metals are active in the Mayapuri area. The safety of the scrap
yards became a concern are the radiological accident which occurred in April
18
being a common practice in steel recycling factories in the US and in most of
the European countries.27
The presence of toxic heavy metals and of harmful chemicals in the
waste generated by these activities presents a direct menace for the health of
several ten thousands of people living in the area. hp://en.wikipedia.
org/wiki/Mayapuri Eight people were hospitalized as a result of radiation
exposure, where one later died. Five patients suffered from the haematological
form of the acute radiation syndrome and local cutaneous radiation injury as
well. While four patients exposed to doses between 0.6 and 2.8 Gy survived
with intensive or supportive treatment, the patient with the highest exposure of
3.1 Gy died due to acute respiratory distress syndrome and multi-organ failure
on Day 16 are hospitalization. The incident highlights the current gaps in the
knowledge, infrastructure and legislation in handling radioactive materials.
Medical institutions need to formulate individualized triage and management
guidelines to immediately respond to future public radiological accidents.27
Bombay Docks Explosion, 1944:
The Bombay Explosion (or Bombay Docks Explosion) occurred on 14
April 1944, in the Victoria Dock of Bombay (now Mumbai) when the freighter
SS Fort Skine carrying a mixed cargo of coon bales, gold, and ammunition
including around 1,400 tons of explosives, caught fire and was destroyed in
two giant blasts, scaring debris, sinking surrounding ships fired to the area
19
freighter built in 1942 in Prince Rupert, British Columbia, under a lend-lease
agreement, and was named aer Fort Skine, a former outpost of the Hudson's
Bay Company.
Sailing from Birkenhead on 24 February via Gibraltar, Port Said and
Karachi, she arrived at Bombay on 12 April 1944. Her cargo included 1,395
tons of explosives including 238 tons of sensive "A" explosives, torpedoes,
mines, shells, ammunitions, Super marine Spire fighter aircraft, raw coon bales,
barrels of oil, chamber, scrap iron and approximately £890,000 of gold bullion
in bars in 31 crates. The 87,000 bales of coon and lubricating oil were loaded at
Karachi and the ship's captain, Alexander James Naismith, recorded his protest
about such a "mixture" of cargo. The transportation of coon through sea route
was inevitable for the merchants, as transporting coon in rail from Punjab and
Sindh to Bombay was banned at that me. The vessel had berthed and was still
awaiting unloading on 14 April, are 48 hours of berthing. In the mid-afternoon
around 14:00, the crew were alerted to a fire onboard burning somewhere in the
No. 2 hold. The crew, dockside fire teams and fireboats were not unable to
extinguish the conflaguration, despite pumping over 900 tons of water into the
ship, nor were they able to find the source due to the dense smoke.27
The water was boiling all over the ship, due to heat generated by the
fire. At 15:50 the order to abandon ship was given, and sixteen minutes later
there was a great explosion, clung the ship in two and breaking windows over
20
by seismographs at the Colaba Observatory in the city. Sensors recorded that
the earth trembled at Shimla, a city located at a distance of over 1700 km. The
shower of burning material set fire to slums in the area. Around two square
miles were set ablaze in an 800 m (870 yd) arc around the ship. Eleven
neighbouring vessels had been sunk or were sinking, and the emergency
personnel at the site suffered heavy losses. Attempts to fight the fire were dealt
a further blow when a second explosion from the ship swept the area at 16:34.
Burning coon bales fell from the sky on docked ships, on the dock yard, and on
slum areas outside the harbour. The sound of explosions was heard as far as 50
miles (80 km) away. Some of the most developed and economically important
parts of Bombay were wiped out because of the blast and resulting fire. The
total number of lives lost in the explosion is estimated at more than 800,
although some estimates put the figure around 1,300. The results of the
explosion are summarized as follows: 231 people killed were attached to
various dock services including fire brigade and dock employees. Of the above
figure, 66 firemen were killed. More than 500 civilians were killed. Some
estimates put total deaths up to 1300. More than 2500 were injured, including
civilians 13 ships were lost and some other ships heavily or partially damaged
Out of above, three Royal Indian Navy ships lost 31 wooden crates, each
containing four gold bars, each gold bar weighing 2 stones27
The educational visits of the nurses of BJ Medical College Ahmedabad
and JG Nursing College Ahmedabad were held on 10th and 12th November
21
NIOH A presentation about ENVIS NIOH centre activities were given by Ms
Annie Soju, Programme Officer and Ms. Prarthana Trivedi, Information
Officer. Mr. Deepak Purohit, IT Assistant gave an overview about the ENVIS
NIOH Website. Ms. Shru Patel helped in getting the questionnaire filled by the
visitors. of shipping destroyed and another 50,000 tonnes of shipping
damaged Loss of more than 50,000 tonnes of food grains, including rice, gave
rise to black-marketing of food grains The inquiry into the explosion identified
the coon bales as probably being the seat of the fire. It was crucial of several
errors: storing the coon below the munions, not displaying the red flag required
to indicate a dangerous cargo on board, delaying unloading the explosives, not
using steam injectors to contain the fire and a delay in alerting the local fire
brigade. 27
An Awareness programme was held in the ceramic units of Ahmedabad
on 8th November 2014 to impart awareness about the occupational health
problem in them. They were also told about the health hazards due to exposure
to heat, warning signs of heat strokes and the protective measures need to be
taken. 27
Common Causes:
Common causes of occupational fatalities include falls, machine-related
incidents, motor vehicle accidents, electrocution, falling objects, homicides and
22
In the United States in 2007, 42% of occupational fatalities occurred during a
transportation incident, 16% occurred after a worker came into contact with an
object or equipment, 15% occurred as a result of a fall, 15% occurred as a
result of assaulter other violent acts in the workplace, 12% were the result of
chemical or environmental exposures (9%) and 3% were the result of fires or
explosions.6
Risk Factors:
Many factors contribute to a fatal incident at work. Lack of appropriate
employee training and failure to provide and enforce the use of safety
equipment are frequent contributors to occupational fatalities. In some cases,
employees do receive safety training, but language barriers prevent the
employee from fully understanding the safety procedures. Incidents can also be
the result of insufficient supervision of inexperienced employees or employees
who have taken on a responsibility for which they are not properly trained.
Poor worksite organization, staffing and scheduling issues, unworkable policies
and practices and workplace culture can all play a role in occupational
fatalities. An incident leading to an occupational fatality is generally not the
fault of a single person, but the result of a combination of many human and
environmental factors.6
Demographics:
In distinction to "risk factors", which may be thought to imply a causal
23
Bureau of Labor Statistics on the demographics of deaths at work do not imply
that age and gender are in themselves causative factors of fatality, but simply
show that fatalities occur more frequently among certain groups.6
Age:
Although all workers are at risk for occupational fatalities, elderly
workers age 65 and older are roughly three times more likely to die at work. 6
Gender:
A large majority of occupational deaths occur among men. In one U.S.
study, 93% of deaths on the job involved men with a death rate approximately
11 times higher than women. The industries with the highest death rates are
mining, agriculture, forestry, fishing, and construction, all of which employ
more men than women. Deaths of members in the military is currently above
90% men.6
Prevention:
Occupational fatalities are preventable. Prevention of occupational
fatalities depends on the understanding that worker safety is not only the
responsibility of the worker, but is the primary responsibility of the employer.
Employers must train all employees in the appropriate safety procedures and
maintain a safe working environment so that fatalities are less likely to occur.
An occupational fatality is not just the fault of the deceased worker; instead, it
is the combination of unsafe work environments, insufficient safety training,
24
it is imperative that an employer address all the potential [risk] factors at the
workplace and educate all employees in safe work practices and risk
awareness.6
In order to perform adequate risk assessment of injuries that occur in the
workplace, health and safety professionals use resources such as the Haddon
Matrix. This model assesses the risks leading up to, during, and after a death in
order to prevent future incidents of a similar nature. Employers and employees
can learn how to identify risk factors in their work environment in order to
avoid incidents that may result in death.6
Research regulation reporting and recommendation:
The regulatory organization for occupational injury control and
prevention is the Occupational Safety and Health Administration (OSHA).
Formed in 1970 as an agency of the United States Department of Labor under
the Occupational Safety and Health Act, OSHA exists to prevent occupational
injuries and deaths by creating and enforcing standards in the workplace.
OSHA standards address employee training programs, safety equipment,
employer record keeping and proper maintenance of the work environment.
Failure to comply with the OSHA standards can result in workplace inspections
and legal action including citations and fines. In very severe cases of employer
misconduct, OSHA can ―red flag‖ an operation and send the employer to legal
25
To regulate the millions of workplaces in the United States, OSHA
requires that all employers maintain a record of occupational injuries, illnesses
and fatalities. Occupational fatalities must be reported to OSHA within eight
hours of the incident. Failure to do so can result in legal action against the
employer. Employers are responsible for staying current on OSHA standards
and enforcing them in their own workplace. State OSHA organizations exist in
twenty-eight states and are required to have the same or more rigorous
standards than the federal OSHA standards. In these states, employers must
abide by their state‘s regulations. It is not the responsibility of the employee to
stay current on the OSHA standards.8
In addition to OSHA, the National Institute for Occupational Safety and
Health (NIOSH) was formed under the Occupational Safety and Health Act as
a federal research agency to formulate industry recommendations for health
and safety. NIOSH is part of the Centers for Disease Control and
Prevention (CDC) in the United States Department of Health and Human
Services (DHHS). NIOSH analyzes workplace injury and illness data from all
fifty states as well as provides support for state-based projects in occupational
health and safety.8
Under NIOSH, the Fatality Assessment and Control Evaluation
(FACE) Program tracks and investigates occupational fatalities in order to
provide recommendations for prevention. A voluntary program for individual
26
Massachusetts, Michigan, New Jersey, New York, Oregon, and Washington.
The primary responsibilities of the state FACE programs are to track
occupational fatalities in their state, investigate select fatalities, and provide
recommendations for prevention. As part of the prevention efforts, FACE
programs also produce extensive prevention education materials that are
disseminated to employees, employers, unions, and state organizations.8
Nationally, the Census of Fatal Occupational Injuries (CFOI), within the
U.S. Department of Labor, compiles national fatality statistics. CFOI is the key,
comprehensive system in the surveillance of occupational fatalities in the
United States.8
Many other non-governmental organizations also work to prevent
occupational fatalities. Trade associations and unions play an active role in
protecting workers and disseminating prevention information. The National
Safety Council also works to prevent occupational fatalities as well as provide
27
METHODS AND MATERIALS
Study group : All the cases of occupational deaths autopsied at Government
Kilpauk Medical College & Hospital, except the skeletonised
and exhumed bodies.
Study design : Descriptive, Observational, Cross-Sectional study
Place of study : Government Kilpauk Medical College.
Duration of study : 24 months.
Conflict of interest : Nil.
Hazards of study : Nil.
MATERIALS:
1. Police History.
2. Photographs taken by police at the scene of crime.
3. Medical/Treatment Records.
4. Autopsy Findings & photographs taken at autopsy.
5. Chemical analysis report.
6. Histo - Pathological report.
INCLUSION CRITERIA:
1. All the cases of occupational deaths autopsied at Government Kilpauk
Medical College & Hospital from January -2016 to January – 2018.
EXCLUSION CRITERIA:
28
2. Exhumed bodies.
DATA COLLECTION :
In this study, all the cases of occupational deaths autopsied at
Government Kilpauk Medical College & Hospital will be analyzed. Data‘s will
be collected in a format, from the Police Inquest reports and Post-mortem
reports, Hospital reports if any. The emphasis will be on age, sex, marital
status, religion, time of sustaining injury, time of death, occupation, fatal body
part, cause of death, migratory or non-migratory population, protective gear,
distance from site of injury to hospital, time taken to shift the deceased to
29
[image:39.595.84.514.166.643.2]OBSERVATION & RESULTS
TABLE – 1: AGE WISE DISTRIBUTION
AGE Total No. of work place deaths Percent
<10 yrs 3 2
11 to 20 16 12.8
21 to 30 35 28
31 to 40 20 16
41 to 50 29 23.1
51 to 60 11 8.7
61 to 70 6 4.7
>70 yrs 6 4.7
Total 126 100
0 5 10 15 20 25 30 35
[image:39.595.93.511.485.755.2]<10 yrs 11 to 20 21 to 30 31 to 40 41 to 50 51 to 60 61 to 70 >70 yrs 3 16 35 20 29 11 6 6
Figure -1: Age-wise distribution of work
place deaths
<10 yrs
11 to 20
21 to 30
31 to 40
41 to 50
51 to 60
61 to 70
30
TABLE -2: SEX WISE DISTRIBUTION
SEX Total No. of work place deaths Percent
Male 112 88.9
Female 14 11.1
Total 126 100
112 14
Figure - 2: Sex distribution of work place
deaths
Male
[image:40.595.91.524.305.663.2]31
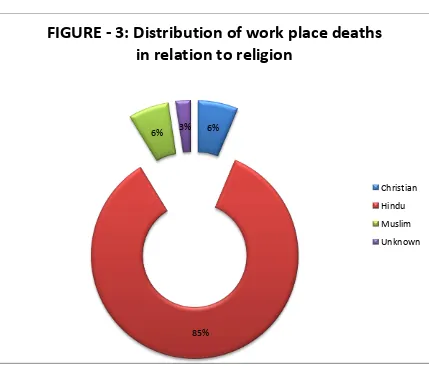
TABLE-3: RELIGION WISE DISTRIBUTION
RELIGION Total No. of work place deaths Percent
Christian 8 6.0
Hindu 107 85.0
Muslim 8 6.0
Unknown 3 3.0
Total 126 100
6%
85%
6% 3%
FIGURE - 3: Distribution of work place deaths
in relation to religion
Christian
Hindu
Muslim
[image:41.595.93.522.361.727.2]32
TABLE-4: MARITAL STATUS
Marital status Total No. of work place deaths Percent
Married 75 59.5
Unknown 3 2.4
Unmarried 48 38.1
Total 126 100
75
3 48
Figure - 4: Distribution of work place deaths
in relation to marital status of the deceased
Married
Unknown
[image:42.595.95.516.313.649.2]33
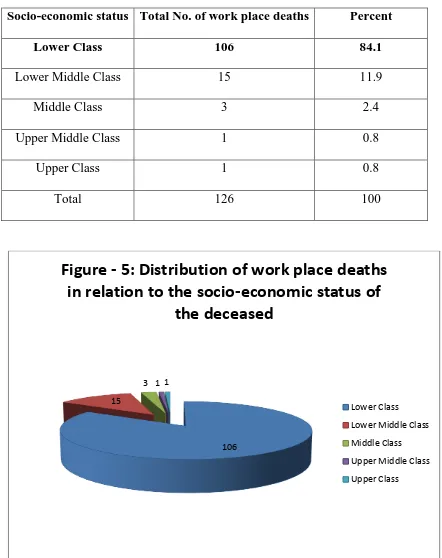
TABLE-5: SOCIO ECONOMIC STATUS
Socio-economic status Total No. of work place deaths Percent
Lower Class 106 84.1
Lower Middle Class 15 11.9
Middle Class 3 2.4
Upper Middle Class 1 0.8
Upper Class 1 0.8
Total 126 100
106 15
[image:43.595.85.513.132.347.2]3 1 1
Figure - 5: Distribution of work place deaths
in relation to the socio-economic status of
the deceased
Lower Class
Lower Middle Class
Middle Class
Upper Middle Class
34
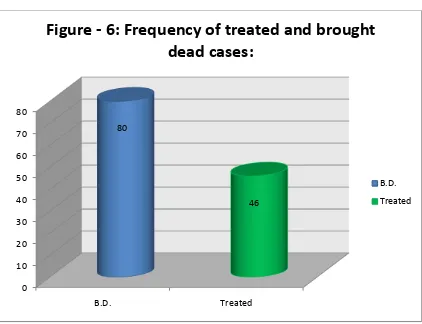
TABLE – 6: FREQUENCY OF TREATED AND BROUGHT DEAD CASES
TREATED Total No. of work place deaths Percent
B.D. 80 63.5
Treated 46 36.5
Total 126 100
0 10 20 30 40 50 60 70 80
B.D. Treated
80
46
Figure - 6: Frequency of treated and brought
dead cases:
B.D.
[image:44.595.92.514.333.657.2]35
TABLE – 7: PERIOD OF SURVIVAL
Duration of survival Total No. of work place deaths Percent
6-12 hours 13 28.2
12-24 hours 10 21.7
1-2 days 8 17.3
2-7 days 4 8.6
7- 28 days 7 15.2
More than 28 days 4 8.6
Total 46 100.00
0 2 4 6 8 10 12 14 6-12 hours 12-24 hours
1-2 days 2-7 days 7- 28 days More than 28 days 13 10 8 4 7 4
Figure-7: Survival period of the treated work
place victims
6-12 hours
12-24 hours
1-2 days
2-7 days
7- 28 days
[image:45.595.89.525.145.716.2]36
TABLE-8: TIME OF OCCURENCE
Time of occurence Total No. of work place deaths Percent
12.01 am- 6 am 19 15.08
6.01 am - 12 noon 29 23.02
12 .01 pmto 6 pm 56 44.44
6.01 pm - 12.00 midnight 22 17.46
Total 126 100.00
19
29
56 22
Figure - 8: Time of occurrence of the work
place deaths
12.01 am - 6 am
6.01 am - 12 noon
12 .01 pmto 6 pm
[image:46.595.85.516.136.672.2]37
TABLE-9: SEASON OF OCCURENCE
Season of occurrence
Total No. of work place deaths
Percent
Summer 63 50.0
Rainy 24 19.0
Winter 18 14.3
spring 21 16.7
total 126 100.0
63
24 18
21
Figure-9: Seasonal distribution of the work
place deaths
Summer
rainy
winter
[image:47.595.83.513.129.348.2]38
TABLE-10: TYPE OF OCCUPATION
Type of occupation Total No. of work place deaths Percent
AC Service Helper 1 0.8
Agriculture and Coolie 1 0.8
Binder 1 0.8
Building worker 1 0.8
Business 1 0.8
child labourer 1 0.8
Coffee shop owner 1 0.8
Contractor 1 0.8
Cooley 25 19.4
Cracker Business 1 0.8
Daily wager 1 0.8
Dosa master 1 0.8
Driver 3 2.4
Duck rearing 1 0.8
Electrician 2 1.6
Engineer 1 0.8
Farmer 1 0.8
hotel in charge 1 0.8
house wife 3 2.4
Skilled Labourer(Hard working) 26 20.8
39
Maid 1 0.8
Mason 4 3
Match box worker 2 1.6
Painter 7 5.6
Pipe Machine Operator 1 0.8
Pizza delivery boy 1 0.8
Plumber 3 2.4
Private Security 2 1.6
Retired 5 4
Roomboy 1 0.8
Security 1 0.8
shop owner 1 0.8
Student 8 6.4
studio owner 1 0.8
Supervisor 1 0.8
Sweeper 1 0.8
Tailor 1 0.8
Technician 1 0.8
Unemployed 4 3.2
Watchman 1 0.8
Welder 4 3.2
40
Figure-10: TYPE OF OCCUPATION
AC Service Helper Binder Business Coffeshop owner Cooley Daily wager Driver Electrician Farmer house wife Lorry Driver Mason Painter Pizza delivery boy Private Security Roomboy shop owner studio owner Sweeper Technician Watchman
0 5 10 15 20 25 30
1 1 1 1 1 1 1 1 25 1 1 1 3 1 2 1 1 1 3 26 1 1 4 2 7 1 1 3 2 5 1 1 1 8 1 1 1 1 1 4 1 4 Axis Title Axis Title
Distribution of work place deaths among various occupations
41
TABLE-11: METHOD OF OCCURENCE
Method of occurence Total No. of work place deaths Percent
Crackers bursting 2 1.6
Cardiac cause 2 1.6
Electric shock 46 36.6
Fall from height 29 23
Fire accident 1 0.8
Hanging 1 0.8
Heat boiler accident 1 0.8
Lightning strike 1 0.8
Match stick factory 37 29.2
Object fall in workplace 1 0.8
poisoning 1 0.8
suffocation 4 3.2
[image:51.595.86.510.95.766.2]Total 126 100
Figure-11: METHOD OF OCCURENCE:
2 2 46 29 1 1 1 1 37 1 1 4 Crackers bursting Cardiac cause Electric shock Fall from height Fire accident Hanging Heat boiler accident Lightning strike Match stick factory Object fall in workplace poisoning suffocation
0 10 20 30 40 50
42
TABLE-12: TIME SINCE DEATH
Time since death Total No. of work place deaths Percent
Upto 6 hours 48 38.1
6 – 12 hrs 28 22.2
12-24 hrs 36 28.5
24-36 hours 9 7.1
More than 36 hours 5 3.9
Total 126 100
48
28 36
[image:52.595.89.508.105.676.2]9 5
Figure-12: Time since death of various
work place deaths
Upto 6 hours
6 – 12 hrs
12-24 hrs
24-36 hours
43
TABLE-13: CAUSE OF DEATH
Cause of death
Total No. of work place deaths
Percent
Asphyxia due to hanging 1 0.7
Electrocution 12 9.5
Neurogenic shock due to
burns
18 14.2
Septicemic shock due to burns 32 25.3
Shock & hemorrhage due to multiple injuries
33 26.1
Intracranial hemorrhage due to
head injury sustained
20 15.8
Snake strike 1 0.7
Alprazolam poisoning 1 0.7
Coronary artery disease 2 1.5
Lightning 1 0.6
Traumatic asphyxia 1 0.7
Asphyxia due to carbon
monoxide poisoning
4 3.1
44
0 5 10 15 20 25 30 35
1 12
18
32 33
20
1 1 2 1 1
[image:54.595.78.541.134.581.2]4
45
TABLE – 14: MANNER OF DEATH
Manner Of Death Total No. of work place deaths Percent
Accidental 122 96.8
Natural 3 2.4
Suicide 1 0.8
Total 126 100
122 3
1
Figure-14: Manner of death of various work
place deaths
Accidental
Natural
[image:55.595.91.523.344.666.2]46
POST – MORTEM PHOTOGRAPHS PERTAINED TO WORKPLACE DEATHS
48
SEPTICAEMIA DUE TO BURNS
49
EXIT WOUND IN ELECTROCUTION
50
DISCUSSION
Maximum deaths occurred in the age group of 21-30 years (35 Cases)
Which constitutes 28% among the total deaths followed by age group between
41-50 Years (29) Cases which constitutes to 23.1% of the total deaths. Where
are is in the study conducted by Olivia S.Mitchell age group above 65 years
were more prone to death at work place which is different when compared to
my study. This indicates that most of the work place deaths were due to natural
death in the study conducted by Olivia S.Mitchell where as in my study most of
the deaths were accidental.33
Most predominant sex affected is Males (112 Cases) which constitutes
88.9% of the total deaths. In the study conducted By Sachil Kumar, Anoop K.
Verma also indicated the predominant sex involved is males in work place
deaths. This clearly indicates that skilled and difficult works in factories are
done by males and more or less they become the host for the livelihood of their
family.37
Most Predominant religion belongs to Hindu Religion (107 Cases)
which constitutes 85% of the total deaths followed by Christian (8 Cases) and
Muslim (8 Cases) religion which constitutes 6% each of the total deaths. No
such study was made by others for comparison. However this study was made
51
Regarding Marital Status number of deaths was observed more in
married a person (75 Cases) who constitutes 59.5% of the total deaths. No such
study was made by others for comparison. However this study will clearly
emphasize that married people are at a higher risk factor pertained to workplace
deaths because they are bound to work at any place and ready to take up any
risk hazards for the benefit of the family. This explains the bonding
relationship and concern of Indians regarding their families.
Regarding Socio Economic Status. Higher number of deaths were
observed in Lower Class (106 Cases) which constitutes 84.1% among the total
deaths followed by Lower Middle Class (15 Cases) which constitutes 11.9% of
the total deaths. This is similar to the study conducted by G.Biswas and M.Ali
were work place deaths were more in lower class (146 Cases) which is higher
when compared to my study. This indicates that people in lower class are more
prone to work place deaths because they go as daily wages do bonded labour
and work even in high risk sector for their livelihood.
Number of brought dead cases (80 Cases) was higher which constitutes
to 63.5% of the total deaths and treated cases were (46 Cases) which constitutes
36.55 of the total deaths. Where as in the study conducted by SG Gerberich,
TR Church at Minnesota number of brought dead cases were only 6 % of the
total deaths. This indicates about the safety and preventive measures in various
52
followed in the respective workplaces which we are deficient in the most of the
work places at india.34
Pertained to period of survival 13 deaths occurred in 6-12 hours which
constitutes 28.2 % of the total death followed by 10 deaths in 12-24 hors which
constitutes 21.7% of the total deaths. Whereas as in the study conducted by MS
Geisser, AD Ryan, GD Walt. Number of mortality pertained to workplace
deaths were only 13%. This indicates the infra structure and quality of tertiary
care hospitals. The most common problem encountered in India is the tertiary
care hospital is situated far away from the occupational sector places which
cause difficulty in treating the victimised patients thereby resulting in a delay
for the treatment. 34
Most of the deaths occurred during 12.01 P.M to 6.00 P.M (56 Cases)
which constitutes 44.44% of total deaths followed by 6.01 A.M to 12.00 P.M
(29 Cases) which constitutes 23.02% of the total deaths. Where as in the study
conducted by G.biswas, Ravi Shankar 6.00 A.M to 12.00 P.M was the fatal
time which constitutes 27% of the total deaths. This indicates day shift or day
time is more dangerous when compared to that of night time or night shift. This
increased mortality in day time may be attributed to the climate – hot climate in
the areas of different workplace37
Most of the deaths occurred in summer season (63 Cases) which
constitutes 50% of the total deaths followed by rainy (24 Cases) which
53
Shankar Singh most of the deaths occurred in rainy and winter season which
constitutes 58% of the total deaths due to electrocution. However in his study
deaths due to electrocution was only taken in into account which is not similar
to my study where all occupational related deaths were taken into account. This
also includes working in boilers alloy factory etc where more heat is generated
and Chennai summer with more humidity which causes dehydration and
excessive sweat making the areas wet suitable for electrocution could be a
reasonable cause for more number of electrocution deaths pertained to
workplace.37
Most of the deaths were observed in skilled labourers (hard working)
(26 Cases) which constitutes 20.8% of the total deaths followed by Cooly (25
Cases) which constitutes 19.4% of the total deaths. This is similar to the study
conducted by Dana P. Loomis, David B. Richardson where most of the deaths
occurred in the construction labourers which constitutes 26% of total deaths.
This clearly indicates the risk involved in construction related work place. So
proper preventive measures and a standard operating procedure has to be set
world to prevent construction related workplace deaths. 33
Regarding the method of occurrence more number of deaths were seen
in electric shock (46 Cases) which constitutes 36.6% of the total deaths
followed by match stick factory accidental burns (37 Cases) Which constitutes
29.2% of the total deaths. Where as in the study conducted by Dana P.Loomis,