The microbiological assay of aflatoxin : a thesis presented in partial fulfilment of the requirements for the degree of Doctor of Philosophy in Microbiology at Massey University
152
0
0
Full text
(2) The Microbiological .Assay of Aflatoxin A thesis presented in partial fulfilment of the requjrements for the degree of. Doctor of Philosophy. in. Microbiology. at :t;;assey University. CEPJSTOPrlER DENNIS FRE!�. 1974.
(3) ii. ABSTRACT A number of possible bases for a biological assay for the aflatoxins v1ere examined, of these two were selected for further study. An inhibition assay using Bacillus megaterium was developed in corebina tion with thin layer chromatographic analysis.. This cethod was capable. of detecting 0.1 �g of aflatoxin B and of differentiating between 1 various mycotoxins. An induction assay using a lysogenic strain of Bacillus megaterium was also developed.. This assay has a sensitivity of 2-4 �g/ml aflatoxin. B and is claimed to be more specific than the inhibition assay. 1 A nureber of other mycotoxins were examined to test the versatility and specificity of the assays.. The inhibition assay was able to detect. and differentiate between most of the toxins.. The induction assay. detected only those mycotoxins reported or suspected to be carcinogenic..
(4) iii. PREFACE It has been known for many years that certain fungi prod�ce substances toxic to human beines and livestock.. Toxic Basidiomycetes. and ergotism have been responsible for the loss of many lives.. It is. only comparatively recently however that a�;tention has been directed to. the imperfect fungi as sources of toxins.. In particular, a dramatic. outbreak of an unknown disease among poultry in the United Kingdom,. called. Turkey X Disease, was eventually traced to a substance produced. by .Aspergillus parasiticus.. This active principle was named 'aflatoxin'. after the Asperr,illus flavus-oryzae group to which Aspergillus parasiticus belongs. 'Aflatoxin' was soon shown to be in fact a number of related. compounds which were designated B1,. B2, G1 and G2 due to the blue or. green colour of their fluorescence under ultra-violet light and the relative positions they reach on thin layer chro�atographic plates. Not all the aflatoxins are of equal potency, B1. G2 the least.. being the most potent and. The aflatoxins are of especial inteiest since they have been shown to. be carcinogenic in very low concentrations in addition to their hepatotoxic effect at higher concentrations.. Aflatoxins have been reported from. a. wide. variety of fungi, chiefly Aspergillus and Penicillium species though other fungi, including a Rhizopus species, have been implicated.. It was also. shown that the toxins could be formed on a wide range of substrates and could easily occur. in. human food�tuffs if .the fungus was allowed to grow. on them. Chemicophysical methods of detection and quantitation have been developed,. based mainly on extraction by an organic solvent followed by. concentration, separation on thin layer chromatographic plates and fluorodensit ometric estimations of the spots.. Chemical assays are rapid, sensitive and very precise but may not. always accurately reflect the biological activity of the substance under. test.. This is particularly the case where very small chemical differences.
(5) iv can make very large changes in activity. least nine different. aflatoxins. There have be en shown to be at. with biolog ical activit ies varying from. extreme toxic ity to practically no effect .. It i s therefore desirable t o. have a biological a ssay to complement the results o f The. th�. chemical assay.. ideal bioassay would be s imple, speedy , sensitive, spe cific and,. Early bioa s say Glethods were based on the. of course , reproduc ible.. toxicity of aflatoxin to vertebrates;. the mos t sensitive and spe c ific. assay be ing t hat using ducklings . Fish larvae and fertile eggs have been used. Later an inhibition-zone microbiological bioassay using. also. Bac illus me�t erium was developed and put forward a s a standard method in the Journal of the Assoc iation of Offi c i�l Analytical Chemists.. There. have been reports in the literature of othe r e ffe c t s of aflatoxin which m ight be suitable for a bioassay system.. Among the se. are. t issue-culture. abnormalities, induction of lysogenic bacteria and suppression of chloroplast development in germinating cress seeds . The a ssay based on duckl ings is relatively specific but requires skill to perform and methods.. The. not nearly as rapid or sens i t ive as chemical. inhibition assay using B. megaterium is more. to perform but i s not assays. is. very. spec ific and i s also. though it requires much le s s ma terial. less. than. sensit ive. specific as. the. biological assay. by various. authors. assay.. look for an assay. duckling assay but with the advantages of A. easier. than chemical. does the duckling. For the se reasons it v;as considered worthwhile to as. rapid and. a. m icro. nuober of possibilit ies had already been suggested. and it was these that. I. proposed to investigate..
(6) V. A CKNO','/LEDGE_,iENTS I would like to thank the Dairy Division of the ��inistry of. Agriculture and Fisheries, for giving me leave to undertake this work and the State Services Commission for supporting me financially over this period. •. .Mrs Gradolf, my typist, for her unfaili!'lg speed and accuracy. Professor R. Hodges for the mass spectroeraphic analysis of a number of compounds. Dr R. Brookes for atomic absorption and spectrographic analyses. of agar extracts and ash.. Dr A. Tyree for mathematical analysis of the dynarr.ics of induction. by aflatoxin.. Dr �'l. Haynes of the Northern Regional Research Laboratories for. cultures of Eacillus meeaterium strains KM, 899a and 1368. Dr M.. Chick, Miss S. Harvey and .Mr J.. Shaw for samples of mycotoxins.. Professor· E. Carell, Dr V. Mayer and ?.�rs A. Jarvis for cultures of. a number of micro-organisms.. My. vlife for her uncritical acceptance of oy moods and her unceasing. encouragement. Finally I would like to record my very r e a l gratitude to my. Supervisors, Professor D. Bacon and Dr G. Pritchard for their kindness in helping me , their patience with my more unlikely hypotheses and their encouragement when things occasionally went ver-.J wrong.. To all these and to everyone else who helped in big or small ways by advice or technical assistance,. I would like to acknowledge my debt..
(7) vi CO:NTENTS. ii. Abstract. iii. Preface. V. Acknowledgements. vi. Table of Contents. Introduction. vii. Materials and Methods. 14. List of Figures. Section I. 1. Examination of a number of biological systems as possible bases for bioassay. Section II. Development of an inhibition bioassay system. 22. 45. Section III Investigation of the properties of Bacillus �zat� and its bacteriophage Section IV Section V. 57. Development of a bioassay for afl�toxin based on 86. induction of megaphage 899a Application of the bioassays to extracts of aflatoxins. 106. and other mycotoxins. 11 6. Discussion. 128. Notes on Appendices Appendix 1.!. Modification by adenosine. 3.' :5.'. cyclic monophosphate. of megaphage 899a inuuction by aflatoxin B 1 B. The. •. 1 29. effect of age of culture on induction of. megaphage 899a by aflatoxin B 1. .. 130. Appendix II Mathematical analysis of the dynamics of induction. 133. References. 135.
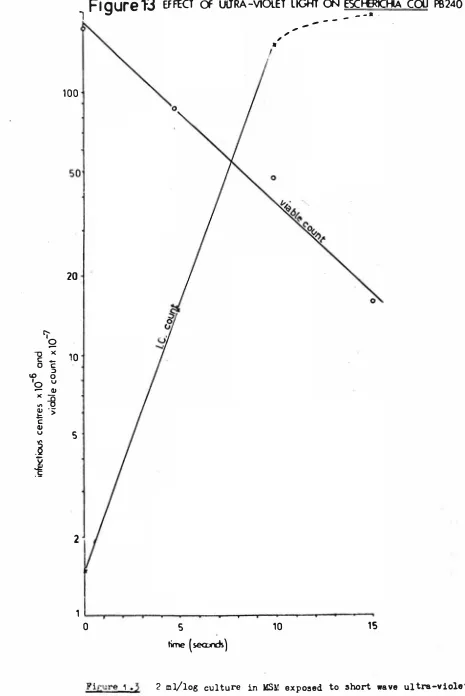
(8) vii LIST OF FIGURES. 0.1. Structures of the aflatoxins. 1 .1. A. � 3. comparison of optical density and viable colalt of Sa.lrr.onella. typhir:mrium ( F22T) during gro\v.t� 1.2. Cell numbers vs Klett units for Salmonella ty-;:>--i::lUrium. 1.3. Effect of ultra-violet light on Escherichi"'. coli PB240. 1.4. Growth of E. aflatoxin B. (P22T). 29 30 36. coli PB240 in the presence of 10 JJg/ml 39. 1. 2.1. Inhibition of Bacillus megaterium by aflatoxin B. 2.2. Effect of seed density on zone si?.e. 53. 2.3. Relationship between densitometric and iQhibition assays. 54. 2.4. Relationship between inhibition zone size end amount of. aflatoxin B 3.1. 1. /. 1. spot. Maximum growth of Bacillus megateriurn. in. 51. 55. varying. concentrations of glucose 3.2. Cor�ection curve for optical density measurements. 3.3. Relationship between optical density and bacterial protein. 3.4. Effect of tryptone on growth rate of Bacillus me.'=:aterium. 3.5 3.6. 3.7. Adsorption of bacteriophage 899a to B. meeaterium strain ID�. 62. 64. 65 68. Effect of agar extract on the phage lysis of B. megaterium strain KM. 70. Effect of agar extract on phage production by B. �egaterium. 3.8. strain KM. Effect of agar ash extract on phage production. 73. 3.9. Effect of agar ash on plating efficiency. 75. 3.10. Effect of magnesium and copper ions on plating efficiency. 78. 71.
(9) viii. 3.11. 3.12 3-13 4·1. Inhibition of plating efficiency by allliuiniL� and calcium ions. 79. Megaphage 899a. 82. Megaphage 899a adsorbed to B. megaterium strain KM. Growth of B. mega terium strains 899a and K:.: in the presence. of aflatoxin B. 1. 83. 90. 4.2. Induction of bacteriophage 899a by aflatoxin B 1. 92. 4.3. Optical density and phage counts after induction. 94. 4.4. Time course of phage production after induction by aflatoxin. 95. 4.5. Phage production after the initial burst. 97. 4.6. Collected induction assay results from seven experiments. 105. 5 .1. Structures of compounds used in bioa ssays. 111. 6.1. The use of optical density to measure the ratio of lysed cells. 121. 7.1. Effect of age of culture on lag phase and lysis. 132. ·.
(10) ------ ---- -1. •. INTRODUCTION ------. 1!ycotoxins:. The word 'mycotoxin' is formed from the two roots 'myco'. from the Greek 'mykes', a mushroom, and 'toxicon', a poison, originally as applied to arrow heads.. Poisons and intoxicants derived from a variety of fungi have been known and used for many centuries. Ergotism caused frequent epidemics in Europe and is still not unknown, and doubtless other local outbreaks of unexplained disease were also due to toxins of mycological origin.. It was not until the last two decades, however, that. serious attention has been directed toward the fungi as a source of substances likely to be harmful to man and domestic animals. History of Aflatoxins: Interest in aflatoxins was first aroused by an outbreak of a mysterious disease affecting turkey poults in Great Britain. birds died as a result of the disease.. Tens of thousands of. Study of the problem revealed that. all the affected birds had been fed on rations containing peanut meal and that other animals fed the same meal could be made to show the same symptoms. (Blount 1961 , Asplin and Carnaghan 1 961 ). •. In the same year outbreaks of. a. disease of pigs and calves were also shown to be associated with the presence of. peanut. meal. in the ration.. ( Lo o o e and Harding 1961 , Loosmore and sm. r. hlarkson 1 961 ) A biological assay using ducklings was devised (Sargeant � !1· 19�a) to test samples of peanut meal and compounded feeds and later. •. Sargeant and his eo-workers (1961a) were able to show that the toxic factor was. formed by the common mould, Aspergillus flavu2, a member of the Aspergillus flavus-oryzae group. In view of its origin the toxic factor was given the name of 'aflatoxin'.. Not long afterwards the structure of. aflatoxin was elucidated by Asao � �· (1963).. The toxin was shown to. consist of a group of similar compounds rather than a single compound. As information on the toxic effects of the aflatoxins accumulated it became apparent that previous reports of unexplained disease, such as those in laboratory anin:als (Shand 1957) and in rainbow trout hatcheries (Wales and Sinnhuber 1966) were also, almost certainly, due to the presence of afla toxins in the feed. Aflatoxins have not, as yet, been found to be of great economic importance in New Zealand.. This is probably due to the relatively small.
(11) 2. size of the poultry induGtry in this country and the fact that few pig or dairy farmers rely very heavily on stored feed for their animals. Nevertheless as farming becomes more intensified the possibility of mould damage to stored animal feeds will increase.. In addition the bulk·of our. dairy produce is exported, some of it to countries which have been deeply concerned about the possible damage to health caused by mycotoxins.. Such. countries may well consider imposing a requirement that our exports be tested and declared free of particular mycotoxins, especially aflatoxin, and for this reason a brief examination of the problem was earlier made by the author. Toxigenic strains of Aspergillus flavus were isolated during a survey (Freke and Richardson, unpublished) and thus a potential problem was revealed.. The. present work was prompted by these isolations and the reasons outlined above. The Structure of Aflatoxin: The structures of the four aflatoxins formed by Aspergillus flavus are given in Figure 0.1. •. In 1962 Allcroft and Carnaghan found that the milk. from cows fed aflatoxin-containing rations contained a toxin with properties similar to the aflatoxins themselves and later (1966) Allcroft. ��·. suggested the name aflatoxin M (for milk toxin) for this toxic factor. Holzapfel. � �·. (1966) were able to characterise this factor as consisting. and B • Aflatoxins M and M can 2 2 1 1 also be isolated from the urine of animals fed aflatoxin-containing feeds and. of hydroxy derivatives of aflatoxins B. from cultures of the mould itself.. Two further aflatoxins (B. described by Dutton and Heathcote ( 1 966 and 1 968).. and G ) were 2a 2a These are very mu�h less. Later and G • 2 2 aflatoxins work by Dutton and Heathcote ( 1969) suggested that the B and G 2a 2a may be derived from B and G during extraction as they are very easily formed 1 1 in the presence of alcohols under acidic conditions. They also described toxic than other aflatoxins and are hydroxy derivatives of B. two further aflatoxins, B and GM • In 19� Dalezios �al. reported yet 3 1 another derivative of aflatoxin which they had isolated from the urine of The structures and called aflatoxin P 1 1 of these various aflatoxin derivatives are also given in Figure 0.1 monkeys injected with aflatoxin B. •. •.
(12) 3. Figure 0·1. 0. 0. HO. STRUCTURES. OF. THE AFLATOXINS. 0. 0. 0. 0. 0. 0. 0. 0. �0. 0. C�·C�OH. 0. 0. 0. 0. 0. 0. 0.
(13) - - -�------�. 4.. Formation of aflatoxins: A. nunber of other fungi apart from. A.. flavus were reported as being. able to produce aflatoxin, for example other ��ergilli, some Penicillium. ( Kulik and Holaday 1 967) and Rhizopus. species (Van Walbeck et �· 1 968). Other workers ( Mislivec et al. 1 968, Wilson et �· 1 967, Parrish et al. 1 966) including the present author ( unpublished 1 969) have been species. unable to substantiate these reports, however, and it seems probable that aflatoxL�s are only produced by members of the Aspergillus flavus-oryzae A.. group.. Not all members of the. 1966).. Those strains which do produce the toxin vary in the amount and in. flavus-oryz� group produce aflatoxin nor do all individuals of the toxigenic species produce it ( Parrish � �· the number of different aflatoxins which they produce The substrate and conditions of gro;rlh also tion.. ( Diener and Davis 1966).. � ffect aflatoxin produc-. In synthetic media carbohydrates were reported as being necessa�. as a carbon source for the production of aflatoxin.. The most productive. media were those containing sucrose, glucose, fructose, xylose, ribose and glycerol. ( 1�ateles and Adye 1 965).. Krebs cycle intermediates were not able. to act as carbon sources according to Davis and Diener (196?) but the incorporation of radioactively labelled acetate into aflatoxin by A.parasiticus in the presence of glucose has been reported by Hsieh and Mateles (1971 ).. Various organic and inorganic nitrogen sources have been. shown to be capable of supporting aflatoxin production but highest yields were obtained when yeast extract was used as the nitrogen source 1 967).. The only metal shovm to be of importance for optimal aflatoxin. production is zinc. by. ( Davis et. Davis. Concentrations of up to. et al. (1967) as necessary for. Schindleret. al.. 2. maximum. al.. �g/ml have been reported yields.. (1967) and Diener and Da�is (1966) both came to the. conclusion that optimum aflatoxin yields are obtained by incubation at 25°C and that peak production occurs at 7 - 9 days. The requirement for aeration With strain ATCC 1 551 7. seems to vary in different strains.. (V - 3734/1 0) Mateles and. Adye. ( 1 965) obtained better. aflatoxin yields in shake flasks than in stationa� submerged culture but Diener and Davis (1969) found that this was one of few strains that did produce aflatoxin in shake flasks..
(14) 5.. Bio�'mthe:: is of n.fla toxin: Tne c or::pl e t bio synt hetic patrn.-ay of the aflo.tox:ins is not yet !mown. Donkersloot et c.l. ( 1 968) c oncl ud e that 2.ceb.te is the ma j or prime:.ry precursor of aflo.toxin. Sc!:emes such as those sugge st e d by Holker and Underwood (-1 9�-) a nd Thomas ( 1 965) se e m mo st probable. Acetate condense s to form an anthr a quin o n e of some kind from which steriglllD.tocystin is formed. Elsv10rthy � al. ( 1 970) Aflatoxin is then synthe s ised fron: sterivnatocystin. de�onstrated the incorporation of radioactively labelled 5-hydroxy e. sterigmatocystin into aflatoxins B1. and G1. by Asper�Jillus f la v us, which lends. to this suggestion. Toxicity of aflatoxins: The toxic effects of aflatoxins were first noticed in turkey po ult s and very s hor t ly afterv:o.rds in ducklil1f;S and young pheasants ( ..Ulcroft 1 969). The order of suscept:i bility in birds was r e po rte d o.s b e in g duc klin g > t urke y weight. and pheasant chicks. >. quail chicks.. In domestic mammals. is 3--: 2 l'ieek-old pies and preerunt so i S ) calves ) rattening pigs mature cattle )> sheep. Sheep seem to be the rr.ost resistant farm animals. the order. and. domestic c hic ke n o.nd. I. '. examined.. A s imila r r::..nge of susceptibility is shovrn by labora to ry anirr:als.. Guinea. pigs. and fe rret s are very susceptible,. rats and do gs less so, monkeys are quite resistant (Butler 1969 ).. and h�mpsters some;'ihat less again and mi e Trout ( Halver 1 965) and z ebra fish larvae ( Abedi and Scott 1 9 6 9 ) hav e also Carcinogenic effects were reported been shol'rn to be affected by aflatoxins. for rr.o�;t of' the sp e cie s examined, the org:;.n gener::tl1y aff ect ed being the liver. c. 1eports of effects in ot he r organisms o.re more. e ffe c t s have been reported in bG.cteria. LilJy. ( 1 %5). C\me s et. sparse but mutagenic. al. 1. 973). and fungi. ( Ong 1 971 ). re_r:orted chromosomal abberations. in the roots of Vicia faba. Schoental 2.nd ''hitc ( 1 965) reported inhibition of chlorophyll pro duc t ion in w:;.tercress seedlings but Rit;s (-1 %9) was not able to substantiate this claim. Crison ( 1 973) reported that the grorith of deveJ.oping l e ttuce seedlin gs was inhibited by aflatoxin B1 but could find no effect on germination or chlor op!:yll f,-;,1�.1:: tion. :Si'fects of afl:<toxin in cell cultm·�;s ho�ve been. cxarr:il1f�d and inhibition. of a wide ranee of. '.'fithroN. (1964). cell. repoctf)cl. type::> lns been reported. reducb.Oi1. lung cells by afh toxin B1 . sho·.m to be. L1hibi ted. of t hu mitotic. ( ·.--o.:.;.:.m ·i 969). rc,te. Legator and. in. human embryonic. The i ncorpor·,, tion of thymidine and uridine was. by afla todns B. 1. o.ml G. 1. ancl by sterigmato cyst in and. •.
(15) 6. some. (Enc;elbrecht. of its analosues.. C.r.mpbell. aflatoxin. (1. and Uten��ir�. Portman and. and dcinonstratetl thett histone p r ot e in must be present for the. B1. in vitro. ---. There are not many reports. afhtoxins.. v1ere _made by. (1963). B1 , B2, G1. and. and further reports on. Holtz-::tpfel et al.. the different. of the relative toxicity- of. Those of aflatoxins. Cart�ghan -et al.. ( 1 9GG). and. on. G2. , �2 and sterigmatocystin B2a, G2a by Dutton and Heathcote B , 1. �. ;\·ere reported by. 1. All these r8ports llealt with toxicity to d1.:.d:lings.. (1969).. and Altenkirk. (1 972). compared the effect s of a:'latodns B. 1. of sterit;matocystin analogues on cell cultures.. were u�>ed by Bucke1ew. G 1. S'72).. reported inhibition of �t\ polyr.:er.:.se trar.scription by. 970). inhibition to be effective. B2,. 1. rt n l .. ( 1 972 ). to co;�p3.re. E:·.cillu.s. :2ngelbrecht. and. me. G1. and a number. .. o-::cteriwn spores. B , 1 (1 969). the to::d:::ity of aflatoxins. and G2 and a v:ide variety of other compounds.. ;:bedi a:1.d Scott. also examined a range of mycotoxins usir-t('; zebra fish b.rvae as the test The results of these studies are. organism.. T<J.bJe 0.2. aflatoxin. B 1. aflatoxin. B2 B3. aflat o x in. Relative todcit;z of aflatoxins in V2.!'i.;ug biolc=;ical systems. 1 Dncklincs �����. 11 2. aflatoxin. e.. flato xin. c eJ.. ,1. 49. not stated. 1 5. 7 69. G2 ..! 1. 1 6.6. M2. 62. C:.I lt ures3. 29. z eb ra f �s . l 14. o.s. 1 .o. 11 6. 0.8. 20 4. not stated. aflatoxin. non-toxic. a f l ato x in. non-toxic. aflatoxin. not stated. toxic but less. steriematocystin. Notes:. 141+. 34. 1. aflatoxin. .. 2 B.m�.o:atP.ruun. �-------. •. aflatoxin G aflatoxin. given in 'l'?.ble 0.2.. than. 1. •. 2. l,.... L.D.. 9. B1. 50 (�g/bird). A rea of inhibition zone caused by 2 �g. ( mm ). Thymidine i:ncorporat::..on in arbibry units. Lethal concentration. 50 (�g/rn1). 2. 0.24. control. =. 1lJ-5.
(16) 7.. Although the data are. aflatoxin B. '1 followed by. inc o GJ plete i t can b e seen from Table 0.. is the most toxic of the afln.toxins with U. 1. and G. that. next,. Sterigrr.atocystin, a probable precursor of the. B2, G2 and M2•. aflatoxins, is of tho same order of toxicity as aflatoxin. B2 and G2 a a. 1. 2. B• 1. Aflatoxins. are re port e d as be i ng non-toxic to ducklings and have not. been e xam ined in other system s .. Methods of d e t e c t ion of afln.toxins:. Clearly the reports of aflatoxin to xicity in a >fide variety of. organisms and its ability to be carcinoge1uc in a number of domestic. and l a bor atory animals m ak e it imperative that foodstuffs likely to. support the growth of the toxigenic mould should be ex amine d for toxin.. To th i s end a number of as s ays have been devised. types:. These fall into two. physicochemical and b iolog ical .. The earliest metho ds. ,. so on a dopt e d as o ff icia l by the A ss ocia tion of. Official Analytical Che:nists, ·nere of the physicochemical type.. They. consist of extraction, p urif ic a t i on and concent.:::-ation procedures followed by thin layer clrroma.tography.. they. c1n be. Since tte uflatoxi�s are all fluorescent. loc:-1.ted under J.ong wave u1tr:.l'-'l:i.ol.nt J'.r.:ht.. The l.!lethod was. r·:1pilUy iffil)rovcd oild the opt:ir:lWJI condiU.o<1S defL"led by a host of workers. including Pons et al.. Pohhnd et. ( 1 968),. Engstrom. ( 1 969),. .Nesheim. �· ( 1 970). The l i.mit of d·�tection is 0.01 �lg/sp ot (Van Duuren �al. 1968) though. probably the pr�ctic�l limi t .. (1 96·1 ). ( 1 969),. clai:ned for this metho d. O.i. to. 0.2. f.l.e/spot is. The f i rst biolo;sical assay was th<:.t d.eveloped by A sp lin and Carnaghan using ducklings.. This is st i ll probably the most widely used and. accepted methoi cf bioassay.. The method has the advuntages of a degree of. specificity when the livers e.re examined... Bile duct proliferation is not an. entirely specific response to afJatoxin dt-:;..mage but is strongly linked to hepatocarcinogenicity afle:toxin B.1. ( Legator 1 969).. at levels of. 2. ThP. bioassay is capab le of dete ct in g. l.lg/bird in five cb.ys.. It is essentially.
(17) 8. a qualitative method however as Legator. (1969). that a dose-response curve can be constructed. Clements. (1968). con s ide rs it questionable. suggested a microbiological ass ay based on the. inhibition of B. megaterium.. The method is a simple. assay of t he type used to screen antibiotics.. disk. inhibition. It is more rapid and. easier to perform than the duckling assay but lacks its specificity.. The. sensitivity claimed for it is 1 �g disk.. /. The three assays described above, TLC, ducklings and disk inhibition,. are in widespread use.. Other assays, particularly bioassays, have been. described and som e may be in routine use in a few laboratories.. These. will be examined in the next part of this introduction. Suggested bases for Bioassay syste ms:. A SWlli�ry of suggested bases for bioassay systecs is given in Table 0.3.. __. The list is ·not intended to be exhaustive but only to give an. indication of the range of bio logical effects that rright be used. Table 0. � Sum�EY of. mammals. birds. fish. plants. bacteria. suggested bases for bioassay syste�s for aflatoxins. Organism. Effect determined by. Rat. L.D.50. Rat. liver changes. Duckli.11g. L.D.50. Duckling. liver changes. Chicken. distortion of embryo. Chicken. mortality of embryo. Trout. liver changes. Zebra fish larvae. L.C.50. Watercress. chlorosis of seedlings. Lettuce. inhibition of grorlh. B._ megaterium. E. coli, Staph. cell culture. inh�bition, induction of lysogenic strains. aureus. induction of lysogenic strains. E. coli. formation of filamentous forms in hibition mitotic inhibition.
(18) 9. Rats are more c ommonly availab le than duc kling s and might be used i n the ir stead.. The onse t of liver dist urbances is s lowe r i n rat s than in. duckling s ( Legat or 1 9 69 ) and rats are ab out thre e t ime s less sensit ive to aflat oxin B than duc klings 1 .As the trout wa s one of t he c crr:me rc ia lly p roduced animals affe cted by •. aflatoxin it ha s been c onsidered a s a test ani ma l ( Le gator 1 969 ) .. It ha s. the disadvantage howeve r that it may take up t o a year befo re any effe ct o f the toxin can be ob ser ved. A. potentia lly more u seful o rgani sm for a ssay purpose s is the chick. embryo .. Fertile e ggs can be t reated with aflatoxin and the i r incubation. c ont inued till hat ching. m ortality. The effect can be mea sured e ither by the. of the e mbryos or by an examinat ion of the embryos for various. developmental di st urbances at a se t t i me after t re at ment .. Jayara man et !!•. (1 968) report ed 1 00% kill of the e mbryos in 24 .hours with only 0 .01 j..lg/egg. Ve rrett et a l . (1 964) a s revie wed by Legat or (1 969 ), produc ed a do se -re sponse curve for aflatoxin B in the range 0.01 j..lg to 0 .1 j..lg/e gg. The method i s 1 very sensitive and relatively easy to perf orm b ut i s not ve ry specifi c . Jayaraman � �· ( 1968 ) showed that a number of different compounds could cause mortality in the chic k emb ryo . Abedi and Scott ( 1 969 ) desc ribed an assay using zeb ra fish larvae. Be cause o f the ir small size 20-30 individuals could be treated in only 2 o f solut ion .. m1. The mortality of the larvae was re corde d after 24 hour treat . ment and a dose -re sponse relat ion ship o ver the range 0 . 25 t o 1 . 2 j..lg/ml aflatoxin B was c la ime d . The a ssay iself is not very spe c ific but the 1 a utho rs reported that the appearance of the dead larvae wa s typical of the toxin. unde r t e st . The obse rvat ion of Schoental and V/hi te ( 1 965) that wat ercre ss see dlings. we re b leached of the ir c hlorophyll by c oncentrations of aflat oxin lower than tho se causing inhibition of germina tion offered anothe r po ssible ba si s for an a ssay .. The effect app eared more spe c ific than some of the othe r phenomena. but somewhat le ss se nsit i ve. A. number o f authors revie we d by Legator ( 1 969 ) had ob served the. formation of filaments by diffe rent bacteria in the pre sence of aflatoxin . This effect i s ab out as sensitive a s the disk inhibit ion a ssay though more difficult. to. quantify..
(19) 1. o.. Legator (1966) reported inductio n by aflatoxin� of bacteriophage I. lambda in lysogenic. E.. of Stauh. aureus .. In both organisms he was able to produce a do se-. coli and of a bacteriophage in a lysogenic strain. response curve in the range 0.06 to 0.5 �g /ml.. This phenomenon is m ore. specific than some of the others di scussed and apparently very sensitive. It would appear to provide a sound basis for an as say s y stem . Induction of a bacteriophage i n. B.. megateriQ� was reported by. Lillehoj and Ciegler (1970) though the concentration of aflatoxin nec e ssary for an effect was higher (540 �g/ml ) .. They sugge sted induction might be. used as a qualitative as say to supplement other methods . Finally there is the p o s sibility of u s ing cell cultures to assay for aflatoxin.. Inhibition of rat fibroblasts by c oncentrations as low as. 0.02 j..l g/ml were reported by Daniel (1965).. He was able to c onstruct a. do se-re sponse curve over the range 0.02 to 0.25 j..lg/ml for aflatoxin B1 Inhibition of cells i s not a very spe cific effe ct but the s ensitivity of •. the method is very gre at . over the range 0.� to. 1 .0. Legator. (1966). pre sented a do se-re sponse curve. �g/ml using inhibition of mito sis in human This might be more spe cific and is. embryonic lung cells as a criterion . certainly very sensitive. The ne ed for a bioas say method:. Physico c hemical method s of a s say are rapid, s ensitive and pre cise. Few of the biological phenomena discu s s e d would provide as s ensitive an assay and none as rapid or precis e . biological as say?. Why then concern one s elf with a. The chemical as says may not always accurately refle ct. the biological activity of the sample under te st .. This i s e spe cially s o. when small difference s in the structure o f the compound can make large difference s in its biological activity .. Eleven aflatoxins have been. de scribed with toxicities ranging from extreme ca:-c inogenicity to no dete ctable activity at all .. These different compounds are rarely likely. to o c cur alone and it i s difficult , if not i3p o s sible, to predict the. biological activity of a mixture even when its c omponents are knmm.. It. is ther,efore de sirable to have a bioas say method available, not to replace. but to complement the chemical method ..
(20) 11. •. The ideal bioa s say would be rapi d , easy to perform , specific to the compound or group of compounds under t e s t , pre ferably reflecting the tox icity of the compounds in mammals , sensitive and reproducible .. The. ideal bioa ssay probably does not exist but each aspect may be susceptible of some improvement . Select ion o f biological effects of aflatoxin for further study: The two bioas says in general use have di sadvantages .. The duckling. assay is fairly spe cific but it is difficult to quantify, t ime-consuming , far le ss sensitive than the chemical methods and require s specialised conditions and sldlls .. The B . megaterium disk inhib ition a ssay is much. simpler to perform a nd more rapid than the duckling a s say .. It is also. more sensitive , though le ss so than chemical methods , but it suffers from a lack o f spe cificity .. In an attempt to provide a bioas say closer to the. ideal tl1.a n tho s e mentioned , thre e phenomena were cho sen for further study . The induct ion o f bacteriophage was chosen a s being sens itive , hopefully more spec ific than inhibit ion and likely t o be easily handled in many laboratorie s .. The blea ching o f chlorophyll in cre ss se edlings sugge sted. the possibility of an as say using a le s s complex green plant , perhaps one of the uni cellular algae , which might be rea sonably spe c ifi c , readily quantified and easily handled .. The third phenomenon was inhibition and it. was hoped to combine thi s with TLC to improve the sensitivity and spe c ific ity .. All the se assay s , if developed , could readily be performed in most microbiological laboratorie s .. Brief de s criptions o f chloro sis and induction. are given below in the next part of the Introduct ion . Chloro s i s : The mechani sm of the ' b lea ching ' of cre ss seedlings by aflatoxin was not di s cu s sed or explored further by it s discoverers . streptomyc in i n ' blea ching '. �glena. is. The effect o f. di s c u s s e d fully by Liang Tong �. (1 965 ) though they came to no firm conclusion .. �·. Their work made it clear. that the Euglena c ells themselve s were not greatly affected by streptomyc in except in so far a s they lost their chloropla sts .. Liang Tong � �· (1 965 ).
(21) suggested that , rather than select ing a mutant , the streptomycin was. 1 2.. Stanier � � · ( 1 9 71 ) de scribe the. act ing directly on the chloropla st .. ' bleaching ' act ion of streptomycin as be ing due t o a select ive effect on 70S ribo some s .. The se ribo somes occur only in procaryote s and in the. mitoqhondria and chloropla sts o f eucaryote s .. In. the ir s cheme the protein. synthe sis of the organelle i s blo cked s o that the cells reproduce without a corresponding increase in the numbe r. cf. chloroplast s .. The existing. chloroplasts degenerate in t ime and eventually none are left in any of the cells in the culture .. ·. One could surmis e that s o�e s imilar mode of act ion. might be re sponsible for the chloro sis due to aflatoxin . Induct ion : The DI'.rA-viruse s of bacteria may be divided into two ma in classe s , v irulent and temperate bacte riophages .. A bacterial cell infected by a. virulent bacte riophage i s committed to mult iplicat ion of the virus within the cell .. Eventually the cell lyse s a nd release s a large number of. progeny phage s .. Infection by a. Thi s is the so-called lyt ic re sponse .. t emperate phage may lead to one o f two response s , comparable vrith that of a v irulent phage , or. ( a ) a lyt ic re sponse. ( b ) a reduct ive re sponse .. This lat ter re sponse is generally a rarer event oc curring in perhaps 0 .1 t o In this case the viral DNA fails to o.� per cent of the infected cell s . replicate on entering t he c e ll and become s e stablished prophage .. This. state. is. a. phage or. re ferred to as lys ogeny and bacteria carrying. prophage are said t o b e lysogenic . inserted a s. a s a latent. I n mnny systeill s the viral genome is. prophage into the chromosome of the host cell .. Lysogenic. cells c ontinue to multiply, the prophage being replicated with the bacterial chromosome , giving rise to a clone of c ells a ll carrying the v irus as a. pro. phage . The lys ogenic state. is a fairly s t a bl e. one but ,. in. the course of. growth , occas ional prophage are convert ed from the lat ent state to one o f active replication by. ex c i sion from t h e ho s t chro�o s ome .. Phage. multip lica. t ion e nsue s followed by lys is of the cell and release of progeny phage s .. Thi s change of state from a latent prophage to active phage multiplication is known as induction .. Spontaneous induc t ion occurs fairly infrequently ,.
(22) 13 . one cell in a hundred or fe,aer , but various t reatments may i ncrease the frequency.. In some lysogeni c stra in s of bacteria the frequency of. induct ion can be increased by a variety of treatments. of the bacteriophage with which t hey are lysogenised. are said to be inducible.. This is a property. Such. bacteriophage. The fre quency of i nduct ion may be increased by. treatment with ion ising radia t ions or with various chemical compounds including nitrogen mustard , mitomyc in C , organic peroxides and fluoro deoxyuridine. genic .. 1fany of these treatments may also be mutagenic or carcino-. There is , t herefore , reason to believe that inducing substances. may also be both mutagenic and carcinogenic.. Aflatoxins have been reported. to induce and to be carcinogenic and mutagenic. ( Legator 1 966 ,. C iegler and. B.. � 970,. Ames. � �· 1 973 ) .. E . coli , Staph . aureus ,. S.. Lillehoj and typhimurium. megaterium may a l l carry inducible prophages and might be used to. demonstrate the induc ing propert ies of aflatoxins.. Su:runary: Aflatoxin is a substance produced by the common fungus Aspergillus flavus and t hought to be carcinogenic.. It is highly desirable to be able. to monitor the production and storage of suscept ible foodstuffs to ensure t he absence of the toxin from them.. To do this it is nece ssary to have. analytical metho ds ava ilable to detect and quant ify the toxin both chemically a nd biologically.. --. Thi s work describes an attempt to develop further. m icrobiolog ical a ssays for aflatoxin .. The first sect ion deals with an. examinat ion of s everal re ported effects of aflatoxin on micro-organisms. which might form t he ba s i s of a bioa s say. indu ct ion of lysoge ni c. B . meGa t c rium. Inhib it ion of growt h and. were chosen for further study.. S e ct ion I I describes the deve lopment of a n assay bas ed on inhibition , S e ct ions III and IV describe development of an induct ion a ssay system S e ct io n V deals w i t h the app l i c a t i o n of the two systems .. and.
(23) 1 4. l�ii.TERIALS 1. •. MID. W�:THODS. CULTURES Euglena gracilis strain Z was obtained fron Professor E . F . Carell, Univers ity o f Pittsburgh , Pens . 1 521 3 , U . S .A . Chlorella pyrenoidosa was obtained from the Fore stry Research Institute , Rotorua , New Zealand . Salu:oneJ.la typhimurium lys ogenised with phage P22 and the wild type Sakonella typhin:urium were obtained from the Culture Collection , Department o f Microbiology and Genet ic s , l.:a ssey University, Palmerston Nort h , New Zealand . Escherichia coli stra ins P4,}.. 6 and Yi1485 v.-e re obtained from Dr V .W . 1�ayer, Genetic Toxicity Branch , Divi sion of Toxicology , Food and Drug Administration , Washington D . C . , U . S .A . Stap�ylococcus aureus strains carrying various phage s were obtained from Mrs A. Jarvis , Dairy Res earch Institute , Pa.lmerston North , New Zealand . Bac illus megateriun strains 1 368 , 3694 and 3695 were obtained from Dr W . C . Haynes , United State s Departn:ent of Agriculture , Peoria , Illinoi s , U . S A Strain 1 368 i s the strain u s e d by Clement s (1 968 ) Strain 3694 is an a sporogenous strain isolated by Kruege r . This strain was called by him Io.! and is phage sens itive . Strain 3695 is a sparing lys ogenic stra in isolated by den Dooren de Jong (1 931 ) and called by him 899a . Strains 3694 and 3695 v1ere depos ited in the Aoerican collection by J .T . Wachsman in 1 969 . �pergillus flavus . S everal strains o f A . fla\�s were examined for aflatoxin production . S om e had been isolated during a survey made for the Dairy Div i sion of the Department of Agriculture in 1 970. Others were obtained from the National Hea lth Inst itute , \','e llington , NeVI Zealand and had been isolated by Dr Richardson . Reference culture s of A spe rgillus . ::tra. s iticus ( L�91 01 9b and l\'RRL 2999 ) were .. .. also obtained from the C ommonvieal th 1.! :ycological Inst itute , Kew , Surrey , England and from the Agricultural Research S e rvice Culture Collect ion , Northern Regional Research Laboratory, Unite s States Department o f Agriculture , Peoria , I llino i s , U . s A .. ..
(24) 1 5. Penicillium c itrinum strain IMI2L�306 was also obtained from the Commonwealth Mycological Institute . 2.. TOXINS Aflatoxin s B , B2 , G1 and G and O chratoxin A w e re obtained from 1 2 Ma ker Chemicals Ltd . , Box 6570, Jerusalem , I srael . ·. Sterigmatocyotin wa s obta ined from Prof .. R . He dge s ,. D ep t . Chemistry ,. Bio chemistry and Biophysic s , Mas sey University .. Radicinin was o b ta in e d from Dr M . Chick , Dept . Chemistry, B i o c hemi stry and Biophysics , 1hs s ey Univeroity . Dothistromin and its analogue were obtained from Mr J . Shaw , Dept . Chemistry , Biochemistry and Biophysi c s , Massey University . Citrinin wa s extracted from a culture of P. c itrinum strain IMI24306 . The mould wa s grown in 2 5 ml malt extract , 0 . 5% , yeast extract 0.25%, glucose 5/b broth for e ight days at 25 ° C . The broth wa s extracted twice by shaking in a separat ing funnel with 50 ml of chloroform .. The chloroform extracts we re pooled and wa shed by s ha k ing with 20 ml d i sti ll e d water .. The chloroform layer wa s then filtered through. activated sodium sulphate to dry it and t he chloroform distilled off . The re sidue was redis solved in 5 ml c hloro form and the conce ntration of citrinin found by mea suring the abs o1� t ion peak at 331. nm. in a. spectrophotomet e r . The C itrinin , and the Dothis tromin analogue sample s were kindly c hecked for purity using ma s s spectroscopy by Prof . R. Hedge s , D epartment of Chemi strtJ , Bio c hemistry and Biophys ics , Mas sey Univers ity .. 3.. Tl1'TN LA.YER CHR0 1LATOGRAPHY ( TLC ). a ) Metho d :. TLC o f mycotoxins and extract s of mould culture s was. pe rformed on 1 /4" plate gla s s pla t e s 5. x. 20 cm, 1 0 x 20 cm or. 20 x 20 cm. layers of Merk S ilica g e l G 250 micrometers thick we re made using. a Quickfit plate spreading system .. ° Before use , the plate s we re ac t iva t ed at 1 00 C for two hours and. allowed to cool in a closed container over act ivated s ilica gel .. Solutions of toxins or extracts in chlo roform were a pp lied to the.
(25) 1 6. The plate s were developed in an. plates with a microlitre syringe . unlined unequi librated tank . b ) TLC Solvent s : i. The following solvent systems were used Methanol 3. ii. Chloroform 9 7 Chloro fo rm 9 0. iii. Benzene 46 : Ethanol 3 5 : Water 1 9 .. Ac etone 1 0 The mixture wa s shaken. in a separat ing funne l and let stand overnight at room temperature to separate into two phase s .. 50 ml of the lower laye r were placed in the. bottom of t he developing tank and 50 ml of the upper layer in a trough . The TLC plate wa s placed in t he trough for development . 4.. FLUORODEI'7S ITOM1'TRY. a ) Instrument s :. Densitometric measurement s were made with a Photovolt. dens itometer cons isting of a Pho t ovolt light unit model 52C wit h. a. plate-scanning a ttacrunent , a Mult iplier-Photometer model 520A , an Integrate r model 49 and a Varicord re corder model 42 B. b) Method :. The equipment was a s sembled acc ording to the manufacturer ' s. ins truct ion s with an ult ra-violet l ight source and the appropriate filt e r .. A filter wa s placed on t he detector head allowing transm is sion. in the 465. nm. re gion .. The Photomultiplier was used on sensitivity. and t he re corder on re sponse setting 1. •. 3. The plate to be examined. was placed on the plate-scanning stage with the silica gel laye r on the unders ide .. The entire light unit was c overed with a velvet cloth. in order to exclude stray light .. A. standard aflatoxin B spot wa s 1 found and the re corder adjusted to give 8q% full scale deflect ion for the largest standard spot .. The plate was then moved to a regio n. uno c cupied by any spots and the re c order adjusted t o give a ba se l ine at 5% of full scale defle ction . wa s adjusted to give le s s. tha n. At the same t ime the integrator one count in twenty seconds .. Areas. c ontaining standard and unknown spots were scanned a nd the recordings marked to identify the peaks obta ined of aflatoxin in the. unkno�n. from. ea ch sample .. The amount s. spots were calculated by comparing the. areas under the peaks of unknown sample s with the areas under the peaks of standards ..
(26) 1 7. 5.. INCORPOR.I\.TION OF A FLATOXI.NS INTO MEDIA. Aflatoxins are only very s lightly soluble i n water. pure standards were dis solved. in. Extracts and. chloroform for chromatographic work. and some method had to be devised to add the toxins to media for induct ion studie s . below .. Five methods were tried;. thy se are enumerated. All methods we re evaluated by TLC followed by an inhibition. a s say to c ompare the amount taken into s olut ion with the amount added. a ) Small amount s of concentrated c hloroform solut ions were added to broth and the mixture. shaken. well .. The chloroform was then. evaporated by passing air or nitrogen through the broth. This method gave variable re sult s and often dep o s ited much o f the material on the glas s . b ) Concentrated chloroform solut ions of a flatoxins were placed in the bottom of a tube and the chloro form evaporated off by a stream o f nitrogen .. Broth wa s added to the tub e and sonicated t o disperse. the a flatoxin . Again the re sult s were variable and o fte n only 2 0-50% o f the aflatoxin could be found in the broth . c ) A modification o f the method described in b ) in which the toxin wa s sonicat ed in 0 . 05% Tween 80 instead o f broth .. This method re covered. 60-80}� of the toxin . d ) Concentrate d solut ions of aflatoxin were evaporat ed and redis solved in ethanol . This solut ion was then added to the medium . This metho d was generally fairly suc ce ssful but could not achieve c oncentrations of t oxin higher than about 1 50 J..Lg/ml . e ) Concentrated chloroform solutions were evaporated and redissolved in acetone .. The acetone solutions were then added to the medium to give. the final concentrat ions de sire d .. This method was preferre d t o that. involving ethanol , partly because the maximum conce ntrat ions obtained were. s omewhat. highe r , ( 200 J..Lg/ml ) but mainly because ethanol ha s been. shown to react with a flatoxins under acid conditions to g ive relat ively non-tox ic compounds ( Dutton and Heathc ote 1 969 ) ..
(27) 1 8. / o .. B?.CIUX"S liEGATZRILP.. ... B. megaterium strain. STiti\IN K1.'. KM. CKM/Sr). STRAHT. OF. wa s grown in a shaking water bath at 32 ° C to. mid-exponent ial phase ( Klett 2 00 ) in 1 0 ml minimal salt s medium supplemented with 0.1 �g/ml nicotini c acid, 0 . 25% gluco se and 0.1% trypt one .. The. pulture wa s centrifuged at 3000 x g for 1 5 minute s at room temperature and the cells re suspended in 2 ml dilue nt peptone .. This ccncentrated suspension. wa s expo sed to short w�ve ultra-violet light (l.�ineralite lamp ) for 30 seconds at 2 0 cm and then added t o 1 00 ml tryptone yea st ext ract. glucose (TYG ) medium supplemented with 1 0 p.g streptomyc in/ml . Thi s . sub-. ° culture was incubated at 32 C for f iv � days and t he n streaked on to An. p late o f TYG agar c ontaining 1 0 �g streptomycin/ml .. a. is olated colony. wa s res treaked on t o the same medium and an i solated colony from this plate wa s selected for propagation as the streptomycin-re sistant s train. 7.. MEDIA Ai�D .. REAGENTS. Lennox A,gar. 10 g '. Tryptone Yeast extract. 5 g. Sodium c hloride. 5 g. Agar Dis tilled wa ter. 12 g 1 000 ml. Adjust to pH 7 . 0 befo re autoclaving at 1 5 lb s/in. 2. for 1 5 minute s .. After autoclav ing add 2 ml 5Q7� st erile glucose solut ion .. Soft Agar Beef extract. 3 g. Peptone. 5 g. Sodium chloride. 5 g. Agar. 5. Distilled wat er. g. 1 000 ml. Dis solve by boiling and distribute 3 . 5 ml amount s in bijou b ot tle s . 2 Sterilise by autoclaving at 1 5 lb/in for 1 5 minute s . Minima l Salt s. Ba se. ( MSM ). di Po ta s s ium. hydrogen pho sphate. 7.0 g. Pota s s ium dihydrogen pho sphate. 3.0 g. Ammonium sulphate. 1 .o g. Sodium citrate ( trihydrate ). 0.5 g. Magne s ium sulphate ( heptahydrate ). 0 .1. Dist illed water. 1 000. g. ml.
(28) 1 9. Dis solve at room temperature and st erilise by autoclaving at 1 5 lb/in for. ·1 5 minut e s .. Add s terile glucose , 1 g/1 , before use .. Peutone Acetate Agar ( PAA ). 2. 0. . Peptone. g. Sodium acetat e. 0 .1 g. Agar. 8.0. Distilled water. g. 1 000 ml. Diss olve by boiling and sterilise by auto claving at 1 5 lb/in. 2. for. 1 5 minut e s . Eugle na Agar This i s. PAA. (EA). with a n addit ion o f 2 .5 g/1 gluc o se .. Eul',lena Cultur·e Medium ( ECM ) Yeast extract. 5 g 2 g. Gluco se. 1 g. Peptone. D istilled wnter. 1 000 ml. 2 Dissolve and sterilise by autoclaving at 1 5 lb/in f o r 1 5 minute s . Ma intenance Medium. (MM). Sodium acetate. 1 o.o. g. Magne sium chloride ( hexa.hydrate ) diSodium hydroge n pho sphate ( 1 2 .H2 o ) S odium dihydrogen pho sphate ( 2H2o ). 1 .02 g 1 .32 g. Distilled wate r. 1 000 ml. 0 . 98. g. Dissolve and sterili se by filtration . B2. sal },ledium. ( BM ). diPotass ium hydroge n pho sphate. 7.o g. Potassium di-hydrogen pho sphate. 3.0 g. Ammonium sulphate. 1 .o g. Magne sium sulphate ( heptahydrat e ) Dis s olve and sterilise by aut oclav ing a t 1 5 lb/in. 2. 0 .1 g for 1 5 minute s .. 2.
(29) 20 .. B.. �,:ego. t e riurr.. Gro·,.:th. J,! e d -i wn. ( Bi.!M ). Ba sa l lV:edium. 7 . 5 ml. 5� tryptone solut ion. 1 .0. 2 .s;:� yea st ex tract solut ion. ml. 1 .0 ml 0 . 5 ml. 5% glu cose solution. Aseptically add the sterile solutions to the ba sal medium before use . ( SDM ). S emi-de fine d l:e d ium. Basal J,ledium. 9 . 2 ml. 5% trypt one s olut ion. 0 . 2 ml. 5q% Glucose solut ion. 0 . 5 ml. 50 A s eptically. �g/ml nicot inic a c id s o lution0 .1 ml. add. Tr,'Q2t one Yeast. t he sterile so lut ions before use .. A�a r. (TYA ). Tryptone Yeast extract. .) . 0 g. 2.5. 1. Agar. 2 .o. g. g. 1. D i st illed wat e r. 1. Add ingredient s t o water and let stand 1 5 m inut e s . d i s solve the. autoclaving. agar , at. d i s t r ibute. 1 5 l b/in. Trypt o ne Ye a � t S o ft. 2. :,ga r. Agar. i n t o c ont ainers and s t e r i l i s e. by. for 1 5 minut e s . ( ST YA. ). Trypt one Ye a 8 t. Bo i l to. extract. D i s t i lled wat er. 5.0 g 2 .5 g 5.0. g. 1. 1. Add the ingre dient s t o wat er and let dis s olve and distribute 3 . 5 m l. 15. s t o. nd. amount s in. m inut e s .. b i j ou bottle s .. by aut o cla.v ing at 1 5 lb/in2 fo r 1 5 minut e s .. Bo il. to. Sterilise.
(30) 21 D il u t ion Medium Pe pt one D i st illed wat er. 1 1. g. 1. D i s s o lve p e p t one a nd dis t ri bute in appropriat e amount s or 4 . 5 ml ) in s crew-capp e d bottles . 2 aut o c laving at 1 5 lb/in for 1 5 minute s .. ( 9 . 9 , 9 .0. Triphenyl. Tetra z o l ium Chlorid e S olut ion. S t erilise by. ( TI' C). Triphenyl t e traz o lium c hl oride So dium chl oride Pot a s s ium chloride D i st i lled wat e r. D i s s o lve a nd store in a dark b o t tle .. 0.3. g. 0.8 0. 04 1 00. g g. ml. •.
(31) S3CTION. I. THE SXAMINATION OF A NUMBER OF BIOLOGI CAL SYSTEMS AS POS S I BLE BASES FOR A BIOASSAY.
(32) 23 � H·ITRODUCTION Of the possible b iological effects of aflatoxin that might be used The first wa s for an as say system , two were selected for further study. t he observat ion of S choental and White ( 1 965 ) that treatment of germinat ing cre s s seeds with low levels of aflatoxin produced seedl ings deficient in chlorophyll . The second was t he induction by aflatoxin of lysogenic cultures of bacteria reported by Legator (1 966 ) for 3 . coli and Staph . aureus and by Lillehoj and C iegler (1 970 ) for B. megaterium . The report ed inhibition of chlorophyll by aflatox in wa s studied t o see whether a similar effect could b e reproduced in a r:: i crobiological system . This might lead to the development of a system which wa s more rapid and more easily controlled t han the use of vascular plants . Euglena gracilis stra in Z wa s chosen a s the te st or'ganism and the work i s described below . The inducing property of aflatoxin wa s studied in some detail in Sa�monella typhimurium lysogenised with phage P2 2 and in Ba cillus megaterium strain 899a . Lysogenic strains of E sche richia coli and Staphylococcus aureus were also examined . The work on Bacillus we,s:aterium forms the maj o r part of the the sis and is only mentioned briefly in this section . a.. Effect o f aflatoxin on greening of Eug!£�� grac ilis .. The ' Z ' strain of E . gracilis ha s the property of be ing able to grow actively in t he ab sence of light if it is maintained in a suitable medium . Under these conditions it doe s not form chloroplasts , only proplast ids . These proplastids can be organised into fully funct ional chloroplast s under the influence of light (WoLlcen a nd Palade 1 953 ) . If Euglena cells are irradiated with ultra-viole t light or are treated with s t;reptomycin they may become permanently ' bleached ' , i . e . they lose their ability to form chloroplasts . The resulting bleached ce lls continue to grow in suitable media however . (Liang Tong et al . 1 965 ) The reported 1 b leachli1g 1 of cre s s s e edl ings by a f latoxin might be analogous to t he bleaching effe ct seen in Eu&lena t reated by streptomycin , espec ially since streptomycin had also be en shown in the same study, to cause partial bleaching of the cre ss plants ..
(33) 24 . Experimental . A. clone o f Euglena gracili s strain Z was obtained a s described below .. Cells were i'lashed from an agar slope with diluent peptone water . .The suspension wa s serialiy diluted in diluent peptone and 0 . 2 ml o f 1 o-3 and 1 0 -4 dilutions placed on the surface of Euglena agar (EA ) plate s . The 0 . 2 ml wa s spread evenly until the surface of the plates appeared dry; the plates were then incubated at 25 ° C under a fluore s ce nt lamp for six days . By this t ime smal� round, dark green colonie s had formed on t he plat e s ; a number o f colonies were p icked from the plate s on t o EA slope s and the slopes were incubated at 25 ° C under a fluorescent light . A single clone was used in subsequent investigations . This clone wa s sub-cultured in Euglena culture medium (ECM ) and incuba ted in the dark at 25 ° C for five days . At thi s time no green colour c ould be seen in the culture and no chloroplasts were visible when the cells were examined micro scopically . The culture wa s centrifuged at 1 000 g for 1 5 minute s and re suspended in ma intenance medium (l.!M) . This suspension was exposed to light at 25 ° C and examined for chlorophyll con tent and cell numbers at t ime O, 2 . 5 , 1 9 and 24 hours . Chlorophyll was e stimated by the method of Arnon ( 1 949 ) . Two millilitre samples were centrifuged at 1 000 g for 1 5 minute s , re suspended in 4 ml 8G& acetone and let stand 1 5-20 minut e s . A t the end o f this time the sample wa s again centrifuged a t 1 000 g and the absorbance of the supernatant at 652 nm mea sured in a Beckman spectrephotometer . The absorbance figure was c onverted t o concentration o f chlorophyll by the formula Chlorophyll g/1. =. Absorbance at 652 x 1 000. This is the total concentration of chlorophylls a + b . The cells were fixed Cell c ount s were made us ing a haemocytometer . by adding one drop of 40/o forma ldehyde t o 1 ml and shaking to ensure even distribution of organisms before count ing ..
(34) 25 . Table 1 .1. Forma t i on of chl o rophyll i n E. gra c i l is. 4 Ce l l numbe r s (X1 0- /ml). T ime (h) 0. Chlorophyll. 2 71. 59. u c-/1. Chlorophyll �g/c e ll X1 G7. 1 q,. 0 , 21. 2 .5. 31 8. 1 74. 1 9. 233. 24. 3 72. 43 00. 1 8.5. 4600. 1 2 ·5. 0 . 54. This confirmed the a b ility o f t h i s stra in t o pro duce chlorophyll in the light .. A. dar.k grown culture was c e ntrifuge d at 1 COO g for 1 5 minute s and. resuspended in MM at twice t he cell concentra t io� .. The suspens ion wa s. div ide d int o e ieht 5 ml a liquo t s and s uffic ient o f a 1 000 �g/ml solu t ion of s trep t omycin sulpha t e added to give f inal concentra t ions of 0 , 2 0 , 40. and 80 �g/m l in dup l i ca t e . light at 2 5 °C .. The aliquot s were mi.xed we ll a nd exp o s e d t o. Sample s were taken a t 0 , 24 ani 48 hour s ani examined for. c e l l c ount , v iable c ount a nd chlorophyll .. Viable count s w e re made by. plat ing on EA and incubat ing the p lat e s at 2 5 ° C for five days in the l ight .. D ifferent ia l count s were made , where appropriate , o f whi te a nd green colonie s .. 't/hite c o l onie s a re derived from those c e ll s in which chlorophyll. p ro duct ion has been permanently a ffe c t e d by the stre p t o�ycin treatment . Table. 1 .2. S trept omyc in �g/ml. (x1. o-4). Viable c o unt (x1. o-4). ' Ble a c::,.ed. '. Colon i e s. %. Chlo rophyll/ce l l 7 X1 o ). (l}g. 1 52. 0. 20. 118. 205. 1 45. 85. 1. 4-0. 1 88. 21 9. 99. 20.0. in itial value s =. C e ll count. �ra c i l i s after 48 hours. 0. 80. N.D.. E ffect o f s t rept omycin on � .. 1 52 94. not de t ermine d .. 208. N.D .. 99 . 9. N.D .. 40 .4. 9 .2. 1 8 .5 1. .2. There was an increa se in chlorophyll in a l l aliquots but the streptomyc in ha d obviously had an e ffe c t as can be s e e n from the number o f bleache d colonie s .. The re sul t s s e em t o b e c ons i s t ent with the gre ening of. exist ing propla st ids but no furt he r formation o f n e w p ropla st ids .. Thi s.
(35) 26. confirmed the a bil ity o f streptomycin t o produce p e rmanently ' blea che d ' culture s o f E . gracilis . S ince aflatoxin i s not very s oluble in wat e r , ethano l wa s cho sen as Thi s would m ean that the. . culture media m ight c ontain amount s o f e thanol up t o 5% so the effe c t o f. a vehicle fo r the addit ion of the toxin . e thano l o n E . gracilis wa s examined .. Dark grown cells were washed and sub-culture d in Euglena culture. ( E C!.i ). medium. c ontaining. 0, 1. 2%. and. e thano l .. The sub -cult ures were incubated. in t he light , sampled at 24 an d 48 hours and examine d for c e ll c ount and. chlorophyll .. !§b le. 24 Ethanol cone .. %. Cells. 1 ·2. Effe ct of e t hanol on E . grac ilis 48 hours. hours. X1 o-4. ChloroEhrll. Cells. f.lg/c ell X1 07. X1 o-4. 0. 29. 26. 1 2. 20. 20. 44 59. 25. 12. 62. Culture s. Chlorophyll. f.lg/c ell X1 o7 1 26 62 41. grown in the pre sence of ethanol had clearly grown b e t t e r. than the c ontrol culture though the amount of chlorophyll pre sent i n t he Hutner e t al .. ( 1 966). have shown that ethanol. can be u s e d without p rior adaptation by E . �rac i l i s .. It appears from the s e. ethanol grown c e ll s wa s less .. re sult s that when ethanol i s pre s ent i t will b e u s e d , to some exte nt , at the exp e nse of photo synthe s i s .. Since chlorophyll product i on was not. completely supp re s s G d , however, it wa s p o s s ible t o pro c e ed . Dark grovm cells we re wa shed and sub -cultured in EC.M conta ining ethanol a nd. 0, 1 ,. 2 and 4 !lg/ml aflatoxin. i n t he l ight a nd sampl e d at. 0,. B 1. •. 2 4 and 4 8 hours .. 4%. The culture s were incuba t e d.
(36) Table 1 4 .. Effect o f aflatoxin 24. hours. 0 hours Aflatoxin B. Count X1 0-4. C ount. B1. Chlo rophyll X1 0-4 . 7 tt/3/cell X1 0. ����-- ��� ·��. t=g/ml 0. 8 .5. 25. 9 -3. 20. 2. 8.3. 19. 4. 6.6. 21. 1. 25. on. E.. 27 .. gra c ilis. 8 hours 4 Chlorophyll Count X1 0-4 7 (.lg/cell X1 o. 32. 59. 88. 60. 85. 51. 30. 19. 61. 71. 65. There may. No ' bleached' c olonie s were found in any of the culture s .. have been a s light drop in chlorophyll levels at the higher c oncentrations of aflat oxin but. any. e ffect of the t oxin was slight and transient .. No. effect on growth was shown . Further experiments using 1 0 and 50 t=g/ml aflat oxin failed to show any e ffect on chlorophyll product ion or to produce any bleached colonie s . Finally Euglena wa s grown. �� acet one. for. in E�I c onta ining. 1 0 t=g/ml a flatoxin. ten days at 25°C under art i ficial l ight .. B. 1. and. No difference s. could be found between the control and aflat oxin-containing cultures .. Euglena eracili� wa s grown in the pre sence o f varying amounts of aflat oxin in a re spirooeter both in the light a nd in the dark t o se e whethe r any e ffects o n re s p irat ion or pho t o synth e s is could b e shown . There were no differences. b.. Effect. b etwe en the. controls and aflatoxin. of aflu t oxin on induction o f. carrying b a c�eri oEhage. to level::. up. S o l :r. o n e l l a. of. 4. (.lg/ml .. t,YP.hireurium. P2 2. S ince the chloropla:=�t bleaching. phenoDenon. could no t be reproduced in. Euglena , attention wa s redire cted t o the ph2.ge induct ion phenomenon . (1 966 ). had implied. by aflatoxin . S alm onella. It. Two. kinds. that a ll inducible ly s o g e n i c bacteria could b e induced. wa s. decided to investigate the effe cts o f t he toxin on. typhicurit�1 lysogenised. in the department ,. Legat or. wa s. w ith. plw.ge P22 s ince. t h i s wa s available. ea s ily handled and gave easily readable plaque s .. of P22 phage we re. ava i la b le ,. g iving centred plaque s while the other. one v;a s the normal temperate phage. wa s. a clear plaque mutant ..
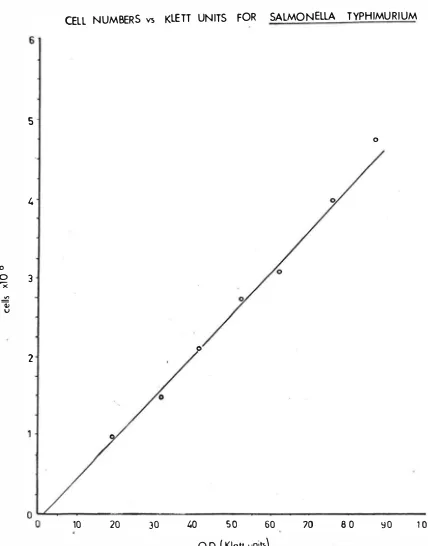
(37) 28 . Lysoge ni c cultures o f b o t h phage typ e s in. we r e i s olat ed by. S . t"v-:: h :..:: u rill.W. growing cult u re s of t he o rga ni s m in MSM t o late log phage , ino culat ing them with large numbers of phege and c o nt i nu in g incubat ion for a further few hour s .. The cultures were then plate d and c olcnie s p i cked o ff on to s lope s of Lennox agar .. Lys ogenic c lone s w e r e. to p roduce phage ;. s. e l e c t e d on the ba s i s. ( P22T ) re sp e c t iv e ly .. the c lone s we re des igna t e d St�. the t e mp era t e and c lear plaque phage ,. o f the i r ability. and S tm. (P22V). for. For c onv e n i e n c e in e st ima t in g the numb ers of c e ll s u s e d in various. inv e st i g at ions the v iable co unt s in a logaritr�ic pha s e culture were. A culture o f S . typhirnurium ° ce lls/ml in �S:t: at 37 C in a shaking. c o rre lated with opt i c a l dens ity m ea s u r m e nt s. wa s grown fron wat e r b a t h. inte rvals .. .. 90 X1 o 6. to. 480 X1 o 6. e. .. Viabl e c ount s and op t ical dens ity n: e e. surement s were made a t Opt ical dens ity. ( OD ). wa s mea sure d. in. me t e r u s ing the blue f i lt e r . Table T ime. 1 .5. �minu te s 2. OD. �Kle t t. 20 4-0 90 11 0 1 50 1 95. X1 o- 6L:ml. N.D .. 1 04.. 32. 1 55. 4-3. 223 280 333. 4-1 0. 76. 4-82. 82 and. colori. Vi a b l e Count. 2. 52 62. 1 75. 10. un:Lt s. 17 22. 1 .1. - Sum.me rson. O_pt ical Den :.J i ty and Viable Count i n S . typhimurium. 0. S e e a l s o F igures. a Kl e t t. 1 .2.. The c orreln tion between OD and viable co�Dt wa s fa i rly go od;. Kl e t t unit s re pre s ente d a pp r ox imat e ly. 5 . 5 X1 o7. cells .. Be fore examining the effect of aflatoxin on t h e c u lt ure s it wa s. ne c e s sary to e ste.blL.. h that the cells were in ducible. by ult ra -viole t light wa s t e st e d .. .. The ir induc ib i lity.
(38) 29. Fi gur e 1·1. UN T L DEN SITY AN D V I A B L E CO A COM PAR ISO N O F OPT ICA. DUR I N G. 10. 8. H I M U R I UM ( P22 T ) G ROW TH OF SAL MON E LL A TYP. 1 00. 80. -. ex> IQ .X. E. �. §. � ...0 0 ">. 6. 60. 4 40. 2 20. �. · c:. lr. ::> = Q). � c. 1. �y·. 8 ;:: ·. 0. o·. c,O. lr. /. .. --��----�-�1 --T00 2 0 5 1 1 00 so 0. time (minutes). Pigure. t .1. The. c u l tu re was. U inirnal Sa l t s Med i um . u s ing. a. blue f i l te r .. grown in a shaking water bath a t 37°C in. OD mea sured in. a. Kl e t t -Sun�erson c o l orimeter.
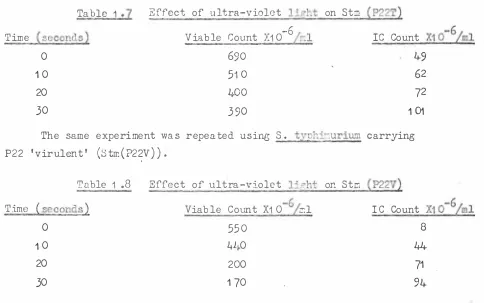
(39) 30. Figur e 1 · 2 6. CELL NUMBERS. vs. KLETI UNITS. SALMO NELLA. FOR. TYPHIMU R I UM. 5. P22T.. 0. 4. Q). 'o. x .::!J v. u. 3. 2. 10. 20. 30. 40. (. so. O.D. Klett. 60. units). 70. 80. �0. 1 00.
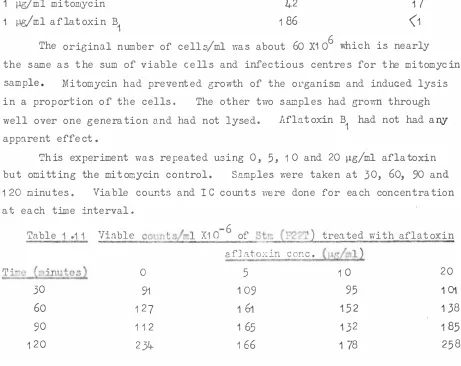
(40) Culture s of both lysogenic strains were grmm to mid-logarithmic. pha se , ce ntrifuged at 3000 g for 1 0 minutes strength Ringer ' s solut ion . strength Rine;er ' s. a nd. wa she d twice in quarte r. The cells were resuspended in quarter 7 solution and d iluted to g ive about 1 o ce lls/millilitre .. Two ml aliquots of the se suspensions were expo sed to short wave ultra violet light (Mine ralite ) for 0, 30, 60 and 90 seconds .. plated for infectious centres ( I C ) and viable count .. Sample s were. Viable count s were. made by plat ing 1 ml of an appropriate dilution o f the sample in NA . IC count s were made by a dding 0 .1 ml of an appropriate dilut ion o f the sample to 3 . 5 ml molten soft agar in a bijou bottle and adding about 0 2. ml. .. of. a. The b i j ou bottle was inverted. we ll-grown culture of sensitive organisms .. thre e or four t imes to mix its content s and the agar the n poured on to the surface of a plate of Lennox agar .. Both. viable and IC count plat e s were. allowed to set and incubated inve rted overnight at 37°C . Table 1 6 Effe ct •. T ime �seconds2. 0 30 60 90. o f ultra-v i o l e t l ight on. Viable CountL:ml Stm {P22T). 1 o7 4- x1 o4< 1 o3 < 1 o3. Stm (P22V'). 1 o7 3 X1 cY 3 (1 0 (1 o3. J.ys oge nised S . typh:i..murium IC CountL:ml. Stre �P22T). . 5 X1 o6. 1 o6 < 1 o3 3 (1 o. Stm (P22V ) 7 X1 cP. X1 o5 <1 o3 1 3 X1 o 6 3. This experiment showed. that the selected clone s were lysogenic but wa s inconc lus ive as to. the. ability. of. ultra -v iolet light to induce phage. production . The experiment wa s repeated us ing �h:ill.u rium carrying P22 temperate. ( S tm P22T ) and exp o s ing the cells fo r 0 , 1 0, 20 and IC count s were made at each time interval .. a nd. 3 0 s econds .. Viable.
(41) 32. Ta ble 1 .7. Effe ct o f u lt ra -vio let l ight on. T ime ( se cond s). Viable Count. X1 0. St� (P22T). -6 /L<l. IC. 690. 0. 49. 51 0. 10 20. 400. 30. 390. X1 0-6/ml. Count 6. 2. 72 1 01. The same experiment was repeated u s ing. tynhi=urium carrying. S.. P22 ' virulent ' ( Stm ( P2 �V ) ) .. Time. Table 1. E ffe c t of ultra -vio l e t lipht on. .8. (.se c onds}. Viable Count. X1 0. - 6;ml. 20. 411-0 200. 30. 1 70. Both lysogenic ba c t e ria. 8. 44. 71. 94. were indu c i b le. by. Stm ( P22V ) seemed somewhat more sensitive with. re s p e ct. t. t o bo h. kill and. To c onfirm the indu c i b i l ity of the lysogenic culture s t he effect o f. (1 959 ). r e p o rt e d. the. compound. their report .. The organism wa s. two aliquot s to one of. c onc e ntra t i on of 1 �J.g/m l. Table. tried. on S tm. Otsuj i e t. ( P22T ) .. lys o g e nic culture s of � . coli could be induced by. that. mit omyc in C and int o. ultra-violet l ight and. .. a radiomime t i c compound , m it omyc in C , wa s al.. Count X1 0-6/ml. IC. 550. 0 10. indu ct i on. Stm (P22V). .. 1 ·2. ha s been wide1y used grovm. in MS1� for. whi c h m i t omy c in C. Phage. counts. as an induc ing. 4-i. Effe ct of m it omyc in. sinc e. hours a nd divided. wa s cdded to. were made. agent. g ive. a final. at 0 and 4 0 minute s .. C on. Stm. (P22T). I C Count s X1 0 4/ml -. Time. {minute s2. Control. 0. 22. 40. 65. Myt omycin C was c learly. very effective. 1. t:�/ml l.�i t om;z::c in c. 22. 5 , 200. in induc ing. Stm ( P22T ). having pro duced a b o u t a hundr e d time s a s many infe ct ious c e n t re s a s a re. produced spontane ou sly ..
(42) --·----. -----. 33 .. The e ffe ct of aflat oxin B1 on Stm ( P22T ) wa s examine d; mitomycin C and blank contro l s were inc luded for compari son . 8 Stm ( P2 2T ) was gro¥m t o about 6 X1 0 cells/ml and diluted one tenth into MSM and into MSM containing 1 �g/ml aflatoxin B1 or 1 �g/ml mitomycin . ° The culture s were incubat ed at 3 7 C in a water bath for one hour . Samples were then plated for viable count and Table. 1 .1 0. re. count .. E ffect of Aflatoxin B on S tm (P22T) 1 -6 -6 Viable count X1 0 IC Count X1 0 1 87. Control. 1. �g/mi mitomyc in. 1. !J.g/ml aflat oxin B1. 42. (1 17. 1 86. (1. The original number o f cells/ml was about 60 X1 0 6 which is nearly. the same a s the sum o f viable c e lls and infe ctious centre s for the mitomyc in sample . in. a. Mitomycin had prevent ed growth o f the organism and induced lys i s. proportion of t h e c e ll s .. well over one generation and apparent effe ct .. The other two samples had grown through. had. not lysed .. Aflat oxin B1 had not had any .. This experiment wa s repeated us ing 0 , 5 , 1 0 and 20 �g/ml aflatoxin but omitting the mit omycin control . Samples were taken at 3 0 , 60, 90 and. 1 20 at. minute s .. Viable c ounts and. e ach time inte rval .. T ime. Table. 1 .1 1. �minute s2 30 60 90 1 20. Viable. re. co�n t s/ml X1 0 0 91. 1 27 112 234. count s Y!ere done for each concentration -6. of S�rr. (P2�) treated with aflatoxin afJ a t ox in c on e . ���/m l L 20 10 5 1 09. 95. 1 01. 1 61. 1 52. 1 38. 1 65. 1 32. 1 85. 1 66. 1 78. 258.
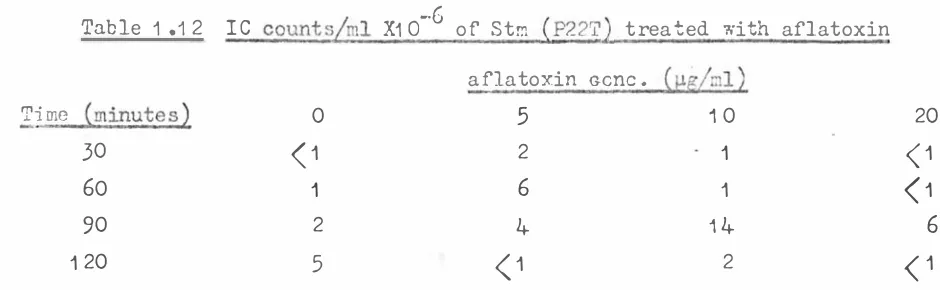
(43) 34 .. Table 1 .1 2 I C count s/ml X1 o-6 (m inute s 2. , .. .�- 1 ffiC. of Stm. (P22T). t rea t e d with aflatoxin. a flatoxin G-ene .. 0. 5. 30. <1. 60. (t!g/r:J l ) 10. 20. 2. 1. <1. 1. 6. 1. <1. 90. 2. 4. 14. 6. 1 20. 5. (1. 2. (1. The. re sults. of the v iab le. c ounts. were rat he r. erratic but growth had The. o c c urred in a l l samp l e s over the period s tudied .. IC. counts w e re all. l ow but there i s no indication of any c o n s i s t e nt difference b e tw e e n the t reated and unt reat e d c e l l s . S in c e no o bvious e f f e c t of a flat oxin c ould be s hown u s ing Salmone lla it was de c i ded to examine tho se spe c ie s of bac teri a on which the t oxin wa s orig inally report e d t o have an e ffe c t and work on S a lmone l la typhimurium wa s s t opp e d .. c.. Effe ct o f a fla t oxin on the indu c t i o n o f lyso5e n i c stra i n s o f S taphyl o c o c c u s aureu s . s t ra ins o f Staph . aureus re c e i v e d from llirs. The. for plaque appearance a nd e a s e of c ount ing . lysoge n i c s t ra i n. 8356. were. a nd. Before. ratio had of. 22. 8329. and s e n s it iv e. The i r. 0 .48 �g/ml. 350. S t ra in s. IC. B1. Assum ing. •. t o v ia ble. and. 832 9. were. S train 22. medium. 8}�. c on tain in g and 1 0. aflatoxin and. °. 37 C for 30. IC. we re. The IC c ount s. Lega tor ( 1 966 ). in. the. pre sence. that the v ia b l e c ount remained t he.. BHI a nd grown for. �g/ml. the. that. Heart. wa s sub -inocula t e d into min imal salt s. aliquot s were incub ated at c o un t s .. establi shed. 1 : 1 00 .. l1- hours. in. Thi s c ulture wa s the n distributed int o a l iquots. c onta ining 0, 2. st ra i n numbers. c o u n t would change t o 3 . 5 : 1 . ° grown for 24 hours at 37 C in B ra i n. Infus ion Broth ( BHI ) .. (MSM ). NTCC. fo ld inc rea s e in infe c t ious c e ntre c ount. a flatoxin. 8356. was. re sp e c t ively .. o f infe ct ious c e ntre s to v iable c e l l c ount wa s. c la imed a. 37 C .. strain 29 .. Jarv i s we re examined. c o�bina t i o n cho s e n. treat ing the b a c t e ria with aflatox in it wa s. same , the rat i o o f. °. The. A.. 1. �g/. ml. a wa ter. of. 1:S�. �itomycin .. bath at + BHI. The se. medium four. m inut e s , then sample d for v iabl e. and. p e rf o rme d as alrea dy de s c ribed except tha t.
(44) .3 5 . the lower layer wa s Nutrient Agar and the upper layer contained 5 00 �g/ml calc ium . Strain 8.329 was used as the phage -sens itive indicator s t ra i n . Table. 1 · 1 3 Effect of. aflat o x i n and mi t omyc in. S t aph .. on. aureus. aflatoxin B. Control. 1 �r,Lml m itomycin. 2 �timl. 1 0 �g/ml. Viab le Count x1 o-5. 1 90. 1 60. 1 90. 1 95. I C Count x1 o- 5. (1. 5. " (1. (1. Aflat oxin did not effect viability indu c t ion in c o n tr a s t. with the report. mitomyc in gave only a low nur:1ber of re sult. only. O .J-1-8. i nfe c t ious. in w o rk i ng. of other diffi culties. and. there i s no evidence of any. of Legator. c o u ld b e obta ined us ing. induct ion rate s. and. (1 966 ) tha t very high l..t.g/ml. Even. af la t oxin .. In. centre s .. v iew. of this. vlith thi s system such a s. clunping o f the cell s and relatively p o o r defini tion o f the plaque s pursued no further .. inv e s t igat ion was. d.. E s cherichia Le gat or. a wa s. ( 1 966 ). had. also. report e d. by aflatoxin .. that. Culture o f. E.. coli lysogenic for phage \. E . coli. A - sensi tive culture were both ava ilable in made to reproduce. s t ra i n. hours .. wa s. gro\m. count. the. lysogenic for /... in MS!.� at. s t anda rd c ond i t ions. s e n s i t ive. .3 7 °C in. a. and. department so an attempt The lysogenic. re sul t s using the se culture s .. Two millilitre amount s of. ligh t under viable. his. was numbered PB240 and the. PB240. S.. coli and b�cte�ioph��. be induced. c ould. th e. straL� � 86 .. shaking. b a t h for four expo sed t o ultra -violet. wat er. t he culture were. for 0 , 5 , 1 0 and 1 5 se conds and plated for and I C count us ing the te chnique de scribed previously for. typh imuriun .. Table. 1 .1 4 Effe ct. Viable count X1 o-7 IC count X1 0-5. of ultro.-v i o le t. 0 1 46 26. 5. E coli PB240 (sec onds ). light on. Ti.;rnc. �. 2 71+. •. .. 10. 49 2 , 000. 15 15 .3 , 000. I I I I. '1.
(45) 36 1. EFFECT a= urrRA-VJOlET LIGHT 0'-' &J-£RK:HA cou PB240. Fi gure 1-3. , •. ,. , -. -. -. - -. - -· .. .. I. 100. 20 ['. -o c. 0 U). •g )(. c. :::> 0 V •g (!) x ::o "' 0 (!) ..... c. (!) V. .a. 1. 10. ·>. 5. 2. 1 ��-----T--��----�15 10 0 5 F iru re 1. .3. lam� a t 2 rt .. time ( seconds). 2. ml/log cul ture in MSM expo:sed t o Counted in Lennox agar.. :short. a v e ultra-v iolet. w.
(46) 37 · The resul t s are e xp re s s e d graphically kill and the induct ion appear. An aflatoxin. A. of PB240. wa s exami.'l ed. Tab le. 1 .1. A. for 30. S ampl e s were the n taken for. 5. wa s included . 37° C in a shaking. minut e s a t. re. viable and C ont ro l. 1. �.. ( 5 o% ). wat e r bath .. 7 �g/m l. p..z/m l m i ton.yc in. 42. 3 65. tho s e u s e d. have. m ight. in the. by. ma ske d. fol lovd.ng PB240. wa s. a. of aflatoxin. Lega tor it. of. t he. grown. in MSM a t. culture s .. �g/ml. in plaque. count .. in thi s experi.1118 nt wa s much higher p. o s s i ble. that. inhibit ion. c oncent ra t ion of. 3 7° C. The. the. m e t ho d. 37 ° C. for. a flatoxin .. o f the c e l l s. aflatoxin was. 5 hours and. dilu t e d. ml. s a:np l e s. Aft e r 1 5. 1 /1 0. The sub- culture s we re. and sampled at intervals t o. 0.5. evaporated o ff by bubbli.'l g a ir a ssayed by. ninefold and. caused a greater drop. Aflat oxin had. A lower. chlorofoi"l!l to kill t he c e l l s .. were. 27. tried. experime nt .. s hak ing water bath at. growth. se emed. induct ion .. 1JS?.! with and w ithou t 1 in. a bout 2q:� .. aflat oxin. 11. but a de c r e a s e rat he r than an incre a s e. S ince t he concentra t ion. sub. c oli PB240. 41. reduc ed the v iable c oun t by. �g/ml. c ount s .. 53. 0-5. The. Mit omy c in had incre n. s e d the numbe r o f infe c t ious c e ntr e s. than. C.. 7 hours in a shaking water. c o ntro l. Che::tical I n d u c t i o n o f. X1 0- 7. in via b i l ity. be. u s in g mitol'!lycin. wa s distr ibuted into 1�S1.� c ont a ining 7. m i t omycin .. cultures were incub a t e d. r e c ount X1. indu c t i o n. wa s grorm in i.�S�,[ for. culture. The. aflatoxin or 1 �g/ml. Via ble COQ'lt. B o t h the. t re at e d sample wa s a l s o i n c lu d e d in the exp e r iment .. culture. bat h at 37° C .. 1 .3 .. Thi s st ra in qu ite c l e arly can. rea d i ly induc ed . The e f fe ct o f chem i ca l. Figure. to be logarithnic , though induction show s. 1 5 seconds .. s om e levelling off at. in. m. 0 .1 ml. the chloro form wa s. through the sa�ple s at. de scribed p reviou s ly. incubated. follow the. were shaken with. inu t e s. into. 0. 37 C .. for infect ious. Fre e. phage. c e nt re s ..
(47) 38 .. Table. 1. .1 6. Gr-owth. OD T ime. in the Ere sence of. of PB2_b-0 �Klett. un i t s 2. 1. 1:!�/ml a f la t ox i n. Ph3. z e. count s X1 o-3 1 P�Lml aflatoxin. 0. 15. 15. 1. 9. 30. 21. Cor,tr-o l. 21. 2. 6. 60. 28. 30. 7. 8. 1 00. 34. 36. 4. 7. 1 35. 45. 48. 9. 5. 1 65. 58. 59. 6. 6. {minute s2. Cont ro l. U�Lm l. a fla t o x in. Had induct ion occurred one might ha v e expected t o find a drop in OD a f t e r a generation or so a nd a marked inc rea s e in the n�� b e r of phages . No induction by a f la t ox i n � could be demonstrated . This did no t o c cur The above experiment was repeated us ing a higher c oncentra t ion of a f l a t oxin int ro du c e d into the system as a n a ce t one solut ion ( see Ma t er ial s and Methods Section ) . PB240 wa s grown in 1;:S?,! + 0 .1 ;. � g lu c o s e and 1 % a ce t o ne t o a n OD of 1 20 Klett units . The cultu:-e wa s diluted 1 /1 0 i nt o MSM + 0 . 1 % g luc o s e and 1 % a ce t one with and withou� 1 0 1-L s/m l aflatoxin B • 1 The sub-culture s were incubated in a s ha king Ymt e r bath a t 37°C . OD readings were r e c o rded a t fift e e n minute intervals and sample s were removed and chloroformed for phage c o unt s The re sults are sho\vn in Table 1 .1 7 and F i gure 1 .4 .. I. .. T ab l e. 1 .1 Z. !_i me �minutes ). 0. Growth. of PB240 in. Opt i ca l Densit;z Control. 17. tho. ere se nee. �Klet� units2 a flatox in. 14. 15. 18. 16. 30. 22. 20. 45. 28. 24. 60. 36. 32. 75 90. 44. 36. 49. 1 05. 55. 39 42. 1 20. 62. 1+4-. B1. of 1. 0 t:g/zr. l aflatoxin. P:n..s. g e Co unt. Control. 23. 3 X1 0-. a la. f tox i n B 9. 13. 16. 27. 19. 84. B1. 93. 1 07 1 27. 1 02. 290. 232. 1 600. 61 0. 1 94. 1.
Figure


+7


Related documents
The paper assessed the challenges facing the successful operations of Public Procurement Act 2007 and the result showed that the size and complexity of public procurement,
Klozapin tedavisi sırasında hastaların daha sık izlenmelerinin bir avantajı olsa da, klozapinin intihar riski yüksek hastalarda intihar davranışı için risk
A significant decline in the concentrations of renal reduced glutathione in comparison with the control group (C) were observed in the trained and untrained rats intoxicated with
19% serve a county. Fourteen per cent of the centers provide service for adjoining states in addition to the states in which they are located; usually these adjoining states have
Methods: A sample of 59 adult high risk males detained in a high secure hospital completed questionnaires at baseline and post treatment to assess violent attitudes, anger,
Objective: To evaluate the impact of luteal phase support with vaginal progesterone on pregnancy rates in the intrauterine insemination (IUI) cycles, stimulated with clomiphene
Although patients in the group of patients with a lower post-operative albumin level were older, had a lower BMI, and more than stage III cancer and some laboratory values
It was decided that with the presence of such significant red flag signs that she should undergo advanced imaging, in this case an MRI, that revealed an underlying malignancy, which
