Theoretical study of pattern formation during the catalytic oxidation of CO on Pt{100} at
low pressures
Alexandra T. Anghel, Rebecca B. Hoyle, Isabel M. Irurzun, Michael R. E. Proctor, and David A. King
Citation: The Journal of Chemical Physics 127, 164711 (2007); doi: 10.1063/1.2796174 View online: http://dx.doi.org/10.1063/1.2796174
View Table of Contents: http://scitation.aip.org/content/aip/journal/jcp/127/16?ver=pdfcov Published by the AIP Publishing
Articles you may be interested in
Gradient induced spiral drift in heterogeneous excitable media Chaos 21, 013125 (2011); 10.1063/1.3565029
Spatio-temporal pattern formation during CO oxidation on Pt(100) at low and intermediate pressures: A comparative study
Chaos 12, 164 (2002); 10.1063/1.1446422
Kinetic oscillations in the catalytic CO oxidation on Pt(100) with adsorbed impurities J. Chem. Phys. 113, 10353 (2000); 10.1063/1.1322656
Dynamics of front propagation in the catalytic CO oxidation on Pt(100) J. Chem. Phys. 110, 8119 (1999); 10.1063/1.478715
Effect of inert sites on the kinetic oscillations in the catalytic CO oxidation on Pt(100) J. Chem. Phys. 109, 8617 (1998); 10.1063/1.477528
Theoretical study of pattern formation during the catalytic oxidation
of CO on Pt
ˆ
100
‰
at low pressures
Alexandra T. Anghel
Department of Applied Mathematics and Theoretical Physics, University of Cambridge, Wilberforce Road, Cambridge CB3 0WA, United Kingdom
Rebecca B. Hoylea兲
Department of Mathematics, University of Surrey, Guildford, Surrey GU2 7XH, United Kingdom
Isabel M. Irurzun
Facultad de Ciencias Exactas, INIFTA, Universidad Nacional de La Plata, 1900 La Plata, Argentina
Michael R. E. Proctor
Department of Applied Mathematics and Theoretical Physics, University of Cambridge, Wilberforce Road, Cambridge CB3 0WA, United Kingdom
David A. King
Department of Chemistry, University of Cambridge, Lensfield Road, Cambridge CB2 1EW, United Kingdom
共Received 25 May 2007; accepted 18 September 2007; published online 25 October 2007兲
Theoretical studies have thus far been unable to model pattern formation during the reaction in this system on physically feasible length and time scales. In this paper, we derive a computational reaction-diffusion model for this system in which most of the input parameters have been determined experimentally. We model the surface on a mesoscopic scale intermediate between the microscopic size of CO islands and the macroscopic length scale of pattern formation. In agreement with experimental investigations关M. Eiswirthet al., Z. Phys. Chem., Neue Folge 144, 59共1985兲兴, the results from our model divide the CO and O2partial pressure parameter space into three regions
defined by the level of CO coverage or the presence of sustained oscillations. We see CO fronts moving into oxygen-covered regions, with the 1⫻1 to hex phase change occurring at the leading edge. There are also traveling waves consisting of successive oxygen and CO fronts that move into areas of relatively high CO coverage, and in this case, the phase change is more gradual and of lower amplitude. The propagation speed of these reaction waves is similar to those observed experimentally for CO and oxygen fronts关H. H. Rotermundet al., J. Chem. Phys. 91, 4942共1989兲; H. H. Rotermund et al., Nature共London兲 343, 355共1990兲; J. Lauterbach and H. H. Rotermund, Surf. Sci. 311, 231共1994兲兴. In the two-dimensional version of our model, the traveling waves take the form of target patterns emitted from surface inhomogeneities. © 2007 American Institute of Physics.关DOI:10.1063/1.2796174兴
INTRODUCTION
A number of catalytic reactions exhibit complex dy-namic behavior, including kinetic oscillations with both tem-poral and spatial characteristics. The oxidation of carbon monoxide on Pt兵100其, which follows a Langmuir-Hinshelwood mechanism,5 is a well researched process that falls in this category.6
The clean Pt兵100其 surface can be prepared in a meta-stable ideal bulk-terminated 共1⫻1兲 structure at 300 K. On heating above 500 K the surface restructures to a more stable arrangement, in which the top layer adopts a quasihexagonal structure and the second layer retains the square array of the
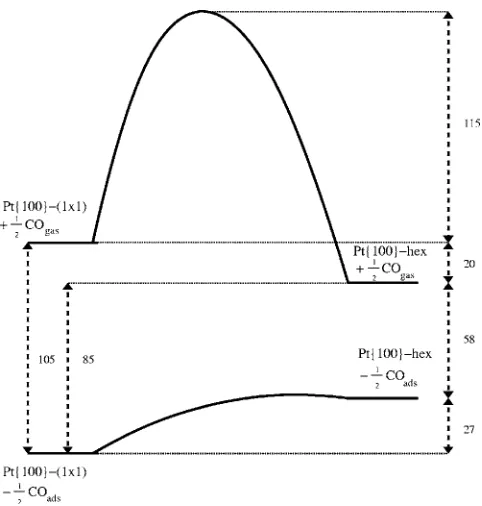
兵100其surface. This phase is referred to as Pt兵100其-hex.7The energy difference between the two clean solid surfaces has been measured calorimetrically and found to be 20 kJ/ mol of surface platinum atoms 共and equivalent to 0.21 eV per
1⫻1 area兲.8This procedure relies on the fact that adsorption of several gases can induce or lift the surface reconstruction, thereby allowing the construction of thermodynamic cycles that provide a direct measurement of the heat of reconstruc-tion.
At surface temperatures above 380 K adsorption of CO on Pt兵100其-hex leads to a lifting of the reconstruction.9–11 The rate of transformation to the 1⫻1 phase follows a non-linear growth power law in terms of the local coverage of CO on the hex phase, COhex.9–11 The rate of 1⫻1 island growth is given byrg共兲=k共COhex兲4.17, wherekis the rate
con-stant, and shows no dependence on substrate temperature. This strong nonlinearity results in a flux-dependent sticking probability for CO.12The growth rate was also shown to be independent of the exposure history and of the coverage of the 1⫻1 phase, 1⫻1.10 Thiel et al.13 have shown that the
surface phase transformation leads to the formation of CO-dense islands on the 1⫻1 phase, with a CO coverage of about 0.5 ML共where 1 ML corresponds to the Pt atom den-a兲Electronic mail: [email protected]
0021-9606/2007/127共16兲/164711/14/$23.00 127, 164711-1 © 2007 American Institute of Physics
sity in the ideal 1⫻1 surface兲. Since the nonlinear growth rate of the 1⫻1 phase is negligible at a very low coverage of CO on the Pt兵100其-hex phase 共i.e., COhex艋0.02 ML兲and in-teractions between molecules can be ignored, the rate of desorption of CO from the hex phase was modeled by rd共兲=COhexe−E/RT, whereEis the desorption energy. Isother-mal desorption measurements foundE= 105 kJ/ mol of CO, while= 3.7⫻1012s−1.14The adsorption heat for CO on the 1⫻1 phase is much larger 关E= −225 kJ/ mol of CO 共Ref. 13兲兴, indicating that the difference in adsorption energetics is the driving force for the CO-induced lifting of the hex recon-struction. Furthermore, the energy gained in converting Pt兵100其-hex with 0.5 ML of CO to Pt兵100其-1⫻1 with 0.5 ML of CO is 27 kJ/ mol of surface Pt atoms. Low energy electron diffraction共LEED兲intensity measurements have de-termined the activation barrier for the conversion of the clean surface from 1⫻1 to hex to be 115 kJ/ mol of surface plati-num atoms.13
Following Yeoet al.,8we reproduce their schematic po-tential energy diagram 共Fig. 1兲 relating the clean surface phases and the two CO-covered surface phases. The integral heats of adsorption shown here are 105 and 85 kJ/ mol of surface platinum atoms for the 1⫻1 and hex surfaces, re-spectively. The activation barrier for diffusion/trapping of CO from the hex to the 1⫻1 phase is unknown but it is believed to be very small and taken as zero in our modeling since it proceeds even at 100 K. The activation energy for CO migration/untrapping from 1⫻1 to hex is, however, taken to be the difference between the CO desorption ener-gies from each. We use the value E= 154 kJ/ mol 共at = 0兲 adopted by Hopkinson and King11for the desorption energy from the 1⫻1 phase, and so the activation energy for CO untrapping is 49 kJ mol−1.
We are going to concentrate now on modeling what is
observed during the oxidation of CO on Pt兵100其. In a recent letter,15 we summarized numerical simulation results from the first faithful reaction-diffusion model to describe pattern formation in this system on experimentally realistic length and time scales. In this article, we focus on the derivation of the reaction-diffusion equations that define our model and present the results of numerical integrations and comparison with experiments in detail.
At pressures where global coupling of the surface through the gas phase is important the flux-dependent CO sticking probability maintains an in-phase behavior in the macroscopic properties across the whole crystal surface.9–11 This manifests itself as regular and irregular self-maintaining oscillations of integral properties such as the rate of reaction and work function changes across the whole crystal surface.1,16–18 However, in certain pressure regimes, spatial structure and self-organization have been observed by vari-ous surface imaging techniques to accompany the oscilla-tions in the macroscopic reaction rate.2–4,19 This typically takes the form of continuously varying patches of predomi-nantly oxygen- and CO-covered surface whose arrangement changes in time through the passage of traveling reaction waves. These waves are of two types: relatively slow-moving CO fronts, at which the 1⫻1 to hex phase relaxation occurs, and faster oxygen fronts not accompanied by phase change.
To be able to build a macroscopic account of the spa-tiotemporal behavior of this reactive system, all the informa-tion available at the microscopic level is required. This in-cludes the above description of adsorption of CO at the two clean phases of Pt兵100其, information on the dissociative ad-sorption of O2 at the surface and the other microscopic
events that take place, as summarized by the following reac-tion scheme:
COgas+ Pt兵100其hex⇔
k1,k2
COhex, 共1兲
COgas+ Pt兵100其共1⫻1兲⇔
k1,k3
CO1⫻1, 共2兲
COhex+ Pt兵100其共1⫻1兲⇔ k4,k5
CO1⫻1+ Pt兵100其hex, 共3兲
1
2O2gas+ Pt兵100其共1⫻1兲——→
k6
O1⫻1, 共4兲
nCOhex+mPt兵100其hex——→
k8
nCO1⫻1
+mPt兵100其共1⫻1兲, 共5兲
Pt兵100其共1⫻1兲——→
k9
Pt兵100其hex. 共6兲
Finally, the reactive step is given by
CO1⫻1+ O1⫻1——→
k7
CO2gas+ 2Pt兵100其共1⫻1兲, 共7兲
where surface chemisorbed species are denoted by the sub-scripts hex and 1⫻1 and the gaseous species by gas.
The adsorption probability of O2 on the Pt兵100其-hex
phase is less than 0.001 and is taken to be negligible in our FIG. 1. Schematic energy level diagram for the CO-induced clean
hex↔1⫻1 phase transition on Pt兵100其. Following Yeoet al.共Ref.8兲, all units are quoted in kJ/mol of surface platinum atoms.
[image:3.612.53.294.45.298.2]model; while that on the 1⫻1 phase is significant and around 0.1.20Preadsorbed oxygen on 1⫻1 has no inhibiting effect on CO adsorption; however, the uptake of oxygen is inhibited by the presence of adsorbed CO.16 In our model, both sticking probabilities are taken to depend on the total local adsorbate coverage, following Refs.21and22, but this simplification is insignificant, as the local oxygen coverage is very low throughout. Desorption of CO takes place in the temperature range of interest 共450– 530 K兲, while oxygen desorption can be neglected under these conditions.16
The rates of migration of CO from the hex phase onto the 1⫻1 phase 共trapping兲 and that of the reverse process
共untrapping兲, both described by Eq.共3兲, depend on the rela-tive length of the boundary between the hex and 1⫻1 areas, B. The parameter B has been modeled by fitting a set of differential equations describing the interaction of CO with both phases of Pt兵100其and was found to be a constant, in-dependent of coverage, for a wide range of CO fluxes.11,12In accordance with this model, we choose Bto be 1. The con-stancy of B suggests a highly anisotropic 1⫻1 island growth,11,12which is supported by more recent scanning tun-neling microscopy experiments by Borg et al.23 who found much faster growth along the关01¯1兴direction than along the
关011兴 direction at 300 K for an initial Pt兵100其-hex surface rotated by 0.7°.
The growth of 1⫻1 islands does not occur by the accre-tion of individual CO molecules as they diffuse to the island boundaries:9–11instead, four CO molecules on the hex phase are involved in the concerted conversion of a patch of hex to 1⫻1 during the nucleation and growth of the 1⫻1 islands. Since the 1⫻1 phase forms as 0.5 ML dense CO islands, this implies that the minimum number of surface Pt atoms in-volved in surface restructuring is eight共i.e.,m艌8兲.
Data available from experimental studies and used in our model are shown in TableI. We use the same parameters as Gruyters et al.,21 who, in turn, adopted many of them from Hopkinson and King.11 The coverage-dependent sticking
probabilities of CO and oxygen on the 1⫻1 phase are adapted from experimental data as in Ref. 24. We use the sticking probability of oxygen on “freed” sites, recently made available by CO desorption or CO2 formation21 for
SO 2
1⫻1
.
KINETIC RATE EQUATIONS
The kinetic rate equations describing the reaction scheme given in Eqs.共1兲–共7兲take standard chemical kinetic forms based on the model of Gruyterset al.,21except that we explicitly consider the fraction of sites available to adsorp-tion, trapping, and untrapping processes, and that we ignore the distinction between free and freed sites as this does not seem to be important in our model. Furthermore, our revised model explicitly couples the phase transition with surface diffusion, thereby allowing the development of a spatially extended model, and takes into account the detailed experi-mental evidence regarding the reaction kinetics.
We writehex and1⫻1 for the coverages of hex and 1 ⫻1 phase, respectively 共i.e., the fractions of the surface in each of these phases兲, and we, therefore, have hex+1⫻1
= 1. We then write COhex,CO1⫻1, andO1⫻1 for the local adsor-bate coverages on the hex 共i.e., hex兲 and 1⫻1 共i.e., 1⫻1兲
phases. Finally, we denote bye
hex
ande
1⫻1
the local cover-ages of empty sites on the hex and 1⫻1 phases, respectively, such that the local coverages satisfy
COhex+
e
hex= 1,
共8兲
CO1⫻1
+O1⫻1+e
1⫻1
= 1.
[image:4.612.48.557.70.297.2]The rate equations15 are given by
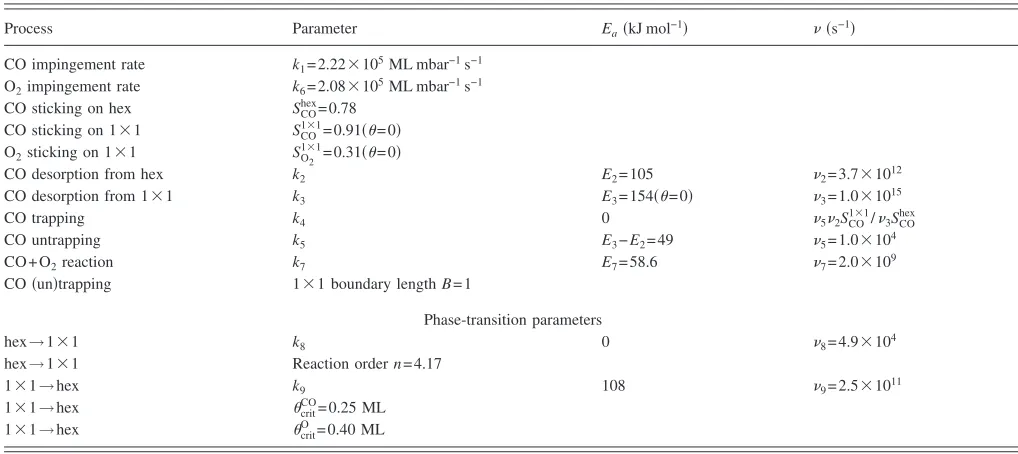
TABLE I. Experimental parameters for CO and O2adsorption on Pt兵100其. Activation energies are labeled asEa, while rate constants are labeled askand sticking probabilities are denoted byS. Critical coverages for the adsorbate-induced phase transition are denoted bycrit.
Process Parameter Ea共kJ mol−1兲 共s−1兲
CO impingement rate k1= 2.22⫻105ML mbar−1s−1 O2impingement rate k6= 2.08⫻105ML mbar−1s−1 CO sticking on hex SCOhex= 0.78
CO sticking on 1⫻1 SCO1⫻1= 0.91共= 0兲 O2sticking on 1⫻1 SO
2
1⫻1= 0.31共= 0兲
CO desorption from hex k2 E2= 105 2= 3.7⫻1012
CO desorption from 1⫻1 k3 E3= 154共= 0兲 3= 1.0⫻1015
CO trapping k4 0 52SCO
1⫻1/ 3SCO
hex
CO untrapping k5 E3−E2= 49 5= 1.0⫻104
CO + O2reaction k7 E7= 58.6 7= 2.0⫻109
CO共un兲trapping 1⫻1 boundary lengthB= 1
Phase-transition parameters
hex→1⫻1 k8 0 8= 4.9⫻104
hex→1⫻1 Reaction ordern= 4.17
1⫻1→hex k9 108 9= 2.5⫻1011
1⫻1→hex critCO= 0.25 ML 1⫻1→hex critO = 0.40 ML
共COhexhex兲
t =k1pCOSCO
hexhex共1 −COhex兲−k2COhexhex−k
4BCOhex共1 −O1⫻1−CO1⫻1兲+k5BCO1⫻1共1 −COhex兲+ min
冉
0,−COhex1⫻1
t
冊
+ max
冉
0,− 0.8CO1⫻11⫻1 t冊
−DhexhexCOhexⵜ2
e
hex−DhexCOhexⵜ2共hex
e
hex兲+Dhexhex
e
hexⵜ2COhex
+Dhexehexⵜ2共hexCOhex兲, 共9兲
共CO 1⫻11
⫻1兲
t =k1pCOSCO
1⫻11
⫻1共1 −O1⫻1−CO1⫻1兲−k3CO1⫻11⫻1−k7CO1⫻1O1⫻11⫻1+k4BCOhex共1 −O1⫻1−CO1⫻1兲−k5BCO1⫻1共1
−COhex兲+ max
冉
0,1.25COhex1⫻1t
冊
+ min冉
0,CO1⫻11⫻1
t
冊
−D1⫻11
⫻1CO1⫻1ⵜ2e1⫻1−D1⫻1CO1⫻1ⵜ2共1⫻1e1⫻1兲
+D1⫻11⫻1e1⫻1ⵜ2CO1⫻1+D1⫻1e1⫻1ⵜ2共1⫻1CO1⫻1兲, 共10兲
共O 1⫻11
⫻1兲
t =k6pO2SO2
1⫻11
⫻1共1 −O1⫻1−CO1⫻1兲
−k7CO1⫻1O1⫻11⫻1+ min
冉
0,O1⫻11⫻1
t
冊
,共11兲
1⫻1
t = 1 2关k8共CO
hex兲nhex
−k9共1 −c共兲兲1⫻1兴
− 1 2关k8共CO
hex兲nhex
+k9共1 −c共兲兲1⫻1兴tanh关共1
−c共兲兲兴, 共12兲
wherepCO andpO
2 are the partial pressures of CO and O2, respectively, SCOhex andSCO1⫻1 are the sticking probabilities of CO on the hex and 1⫻1 phases, respectively, SO
2
1⫻1 is the
sticking probability of O2on the 1⫻1 surface, andDhexand
D1⫻1are diffusionlike coefficients for CO on the hex and 1 ⫻1 phases, respectively.
The righthand side of Eq.共12兲tends to k8共COhex兲nhexfor
c共兲艌1 and −k9共1 −c共兲兲1⫻1forc共兲⬍1, as→⬁, and is,
therefore, a smoothed version of the corresponding discon-tinuous equation of Gruyters et al.21 We chose = 1000 in order to approximate a discontinuous change. The function c共兲is defined to be
c共兲=CO
1⫻1
COcrit + O1⫻1
Ocrit, 共13兲
whereCOcrit andOcritare defined in TableI.
Our updated model contains two sets of new terms: the terms involving 1⫻1/t on the righthand sides of Eqs.
共9兲–共11兲 account for the effect of surface density changes, while the terms involving Dhex and D1⫻1 describe
same-phase diffusion. We discuss the derivation of these new terms in detail in the following section.
Gas global coupling can easily be introduced to account for variations in the partial pressures of CO and O2, which
result from inflow and outflow of reactants as well as reac-tion. However, since gas global coupling was found to be
insignificant in the very low pressure range that we consider, as shown by experiment,1,4,18,19 we have chosen not to in-clude it in our model and have considered the partial pres-sures to be fixed, independent of time. We note, however, that at intermediate pressures, long-range coupling through the gas phase is necessary for global rate oscillations on Pt兵100其 共Ref.19兲and at low pressures on Pt兵110其single crys-tals and polycrystalline platinum foils.26,27 Lele and Lauterbach19found for Pt兵100其that the nonlinear phenomena involved at the low pressures investigated in our study are markedly different from those operating at intermediate pres-sures, where they concluded that the phase transition may no longer be the driving force for rate oscillations. They sug-gested instead a mechanism involving the formation of sub-surface oxygen under these higher pressure conditions. The importance of subsurface oxygen in pattern formation at in-termediate pressures has been confirmed by recent ellipsomi-croscopy for surface imaging experiments.25
MESOSCOPIC MODEL
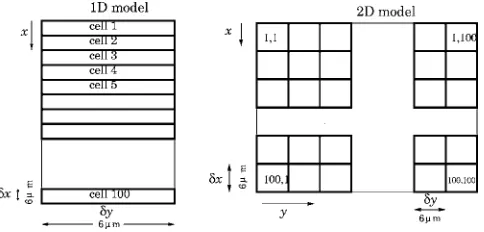
[image:5.612.317.559.614.730.2]A detailed explanation of the surface density modifica-tion and diffusion terms introduced in our model are given in the following subsections. Our aim is to perform a numerical integration in space and time of Eqs. 共9兲–共12兲, leading to a spatiotemporal description of the reactive process. In order to include diffusion, we divide the surface domain of integra-tion into a grid of cells, as shown in Fig.2, each containing
FIG. 2. The division of the surface into cells. Left: 1D cell model. Right: 2D model.
many CO adsorption sites. The cell size is intermediate be-tween that of incipient hex and 1⫻1 phase patches and the much longer scale on which pattern formation occurs. We refer to models involving diffusion between cells along thex axis only as one dimensional 共1D兲, while those permitting diffusion along bothxandyaxes are two dimensional共2D兲, wherexandyrefer to the dimensions in the cell length and width directions, respectively.
The 1D integrations are performed on a ribbon of area A=L␦x␦y= 3600m2, whereL= 100, while the 2D integra-tions are performed on a domain of length L␦x and width L␦y, with area A=L2␦x␦y= 3.6⫻105m2. The domain is taken to be spatially periodic in the x direction in the 1D case, and in bothxandydirections in the 2D case: in other words, there is a repeat of the domain and the surface pat-terns within it at each boundary. The numerical integration uses Adams-Bashforth time stepping and second-order tial finite differences. The same-phase diffusion leads to spa-tial coupling between cells and is derived below for the case where␦xand␦yare equal.
Surface density changes at phase change
The adsorbate-induced hex to 1⫻1 phase change de-scribed by Eq. 共12兲 for c共兲艌1 leads to a change in the density of surface sites and, hence, to a change in the fraction of sites occupied by CO in each of the two phases. Equations 共9兲–共11兲 include terms that take this into account. At phase change on a crystal of areaA, in a short time interval␦t, an areaA␦1⫻1 of 1⫻1 surface is created and a corresponding
area, A共−␦hex兲=A␦1⫻1, of hex surface is destroyed. The
area taken up by CO on the destroyed hex surface was ACOhex共−␦hex兲=ACOhex␦1⫻1. This is lost in the surface
restruc-turing, so the change in the area covered by CO on hex phase is ␦共ACOhexhex兲= −ACOhex␦1⫻1. Therefore, from the phase
change alone we have
共COhexhex兲
t = −CO
hex1⫻1
t . 共14兲
The additional area occupied by the CO on the 1⫻1 phase 共assuming that all displaced CO from the destroyed hex patch ends up on the 1⫻1 phase兲 is ACOhex␦1⫻1a1⫻1/ahex, wherea1⫻1 is the area occupied by a
1⫻1 site andahexis the area occupied by a hex site. We take
a1⫻1/ahex to be about 1.25, since about 20% of atoms are
displaced during the phase change28and 1 / 0.8= 1.25. Hence, from the phase change alone, we have
共CO1⫻11 ⫻1兲
t = 1.25CO
hex1⫻1
t . 共15兲
The process is reversed during the relaxation of the 1
⫻1 surface to hex phase, described by Eq.共12兲, when c共兲
⬍1 and1⫻1/tis negative. Now, the CO is displaced from
a destroyed 1⫻1 patch onto a newly formed hex patch, and the terms that describe this reverse process can be shown in similar fashion to be
共COhexhex兲
t = − 0.8CO
1⫻11⫻1
t 共16兲
in Eq.共9兲, where the factor of 0.8 is given byahex/a1⫻1, and 共CO1⫻11
⫻1兲
t =CO
1⫻11⫻1
t 共17兲
in Eq. 共10兲. The combined effect of the forward and back-ward transitions between hex and 1⫻1 is
共COhexhex兲
t = min
冉
0,−COhex1⫻1
t
冊
+ max
冉
0,− 0.8CO1⫻11⫻1t
冊
, 共18兲共CO1⫻11 ⫻1兲
t = max
冉
0,1.25COhex1⫻1
t
冊
+ min
冉
0,CO1⫻11⫻1t
冊
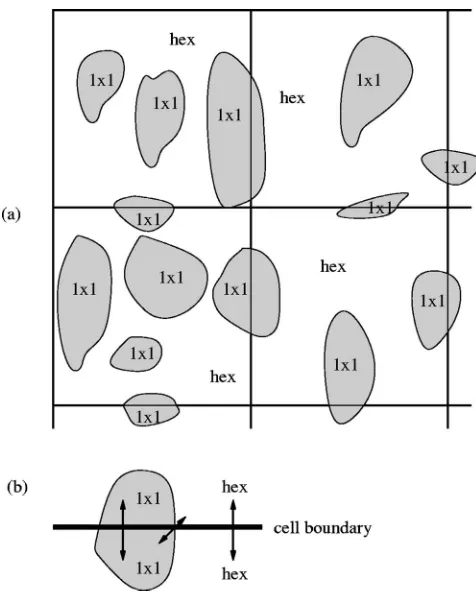
. 共19兲 [image:6.612.315.553.386.682.2]The coverage of oxygen is not affected by the adsorbate-induced restructuring since oxygen does not stick to hex sur-face, so no oxygen can be displaced from it as it is destroyed. However, during the relaxation, when 1⫻1 surface is re-placed by hex, any oxygen on the destroyed 1⫻1 patch is assumed to be released as gas, and so we have a contribution,
FIG. 3. 共a兲1⫻1 islands growing on a hex surface, with the mesoscopic lattice of cells superimposed.共The size of the islands relative to the cells is exaggerated for clarity.兲 共b兲 CO diffusion at the boundary between two neighboring cells. Arrows indicate same-phase and cross-phase diffusions from one cell to another. Same-phase diffusion is dominant because most of the boundary lies within a single patch rather than on the boundary between 1⫻1 and hex patches.
共O1⫻11 ⫻1兲
t = min
冉
0,O1⫻11⫻1
t
冊
, 共20兲in Eq.共11兲. The min function is used to ensure that the term is only effective when1⫻1/tis negative.
Same-phase diffusion
Carbon monoxide can diffuse on both hex and 1⫻1 sur-faces, whereas oxygen is relatively immobile at the tempera-tures used in our model. The dominant contribution from CO diffusion will come from molecules moving from one hex site to another nearby hex site or from a 1⫻1 site to another 1⫻1 site. This is because hex and 1⫻1 sites are only close enough together for diffusion to occur between them at the boundaries of patches, and most sites lie in the interior of a patch rather than on the boundary共see Fig.3兲.
Hence, for diffusion on the hex phase, a CO molecule must be untrapped at one hex site and retrapped at another hex site nearby. Most of the CO that is untrapped will be retrapped in the same cell, but let us say that a certain pro-portion⑀ migrates between cells.共In what follows, we con-sider the 2D model; the 1D case is analogous.兲The rate of untrapping in the donor cell共i,j兲will be proportional to the density of CO on the hex phase there,COhex共i,j兲, and the rate of retrapping in the nearest neighbor共up, down, left, and right兲 cells 共nn兲will be proportional to the density of empty sites
on the hex phase there, 1 −COhex共nn兲. In a short time interval␦t, the net change in CO coverage on the hex phase in cell共i,j兲 owing to diffusion alone is given by
␦共COhexhex兲
共i,j兲= −k⑀COhex共i,j兲
兺
共nn兲
ehex共nn兲␦t
+k⑀e共i,j兲
hex
兺
共nn兲
CO共nn兲
hex ␦
t, 共21兲
wherekis a constant of proportionality that is related to the speed of unhindered CO migration on the hex phase. This accounts for CO leaving the cell共i,j兲and CO arriving from cells 共nn兲. Now, ⑀ is proportional to the amount of cell boundary that is within a hex patch, which will be propor-tional to the coverage of hex phase,hex, in the current patch
共i,j兲. Since we are modeling diffusion at the boundary be-tween cells, we take the average of the coverage in cell共i,j兲 and the nearest neighbor cell共nn兲.
␦共CO hexhex兲
共i,j兲= −K
兺
共nn兲
共hex共i,j兲+hex共nn兲兲CO共i,j兲
hex
e共nn兲
hex ␦
t
+K
兺
共nn兲
共hex共i,j兲+hex共nn兲兲hexe共i,j兲COhex共nn兲␦t,
共22兲 where K is once more a constant of proportionality that is related to the speed of migration of CO on clean hex phase. Adding and subtracting 8Khex共i,j兲COhex共i,j兲ehex共i,j兲, we can rear-range this equation to get
␦共COhexhex兲
共i,j兲= −Khex共i,j兲CO共i,j兲
hex
兺
共nn兲
共e共nn兲
hex
−e共i,j兲
hex 兲␦
t−KCO共i,j兲
hex
兺
共nn兲
共hex共nn兲e共nn兲
hex
−hex共i,j兲e共i,j兲
hex 兲␦
t
+Khex共i,j兲e共i,j兲
hex
兺
共nn兲
共CO共nn兲
hex −
CO共i,j兲
hex 兲␦t+K
e共i,j兲
hex
兺
共nn兲
共hex共nn兲CO共nn兲
hex −hex
共i,j兲CO共i,j兲
hex 兲␦t. 共23兲
Now, if we setK=Dhex/␦x2, divide by␦t, and take the limits
as ␦x→0 and ␦t→0, we get
t共CO
hexhex兲= −DhexhexCOhexⵜ2
e
hex
−DhexCOhexⵜ2共hexe
hex兲
+Dhexhexehexⵜ2COhex
+Dhexehexⵜ2共hexCOhex兲 共24兲
as the contribution from hex phase diffusion alone.Dhexis a diffusionlike coefficient. Taking the limits as ehex→1 and
hex→1 shows that Dhexis equal to half the diffusion coef-ficient for CO on clean hex phase. A similar analysis for the 1⫻1 phase gives
t共CO
1⫻11
⫻1兲= −D1⫻11⫻1CO1⫻1ⵜ2e1⫻1
−D1⫻1CO1⫻1ⵜ2共1⫻1e1⫻1兲
+D1⫻11⫻1e
1⫻1ⵜ2 CO 1⫻1
+D1⫻1e1⫻1ⵜ2共1⫻1CO1⫻1兲, 共25兲
where, as expected,D1⫻1is equal to half the diffusion
coef-ficient for CO on clean 1⫻1 phase. For our simulations we used the valuesDhex=D1⫻1= 10−6cm2s−1since the diffusion
coefficient of adsorbed CO is estimated to be of the order of 10−6cm2s−1.2
RESULTS: 1D MODEL
phases of Pt兵100其. A number of surface defects 共 inhomoge-neities兲 of dimension ␦x␦y= 36m2 were mimicked in the
1D model by choosing the initial coverage conditions in cer-tain cells to differ from those of the rest of the surface共see TableII兲in order to model the effect of local differences in topography and sticking probablities. One could also model defects by, for example, modifying the sticking probabilities permanently in certain locations, but we would not expect this to alter the types and speeds of fronts observed that are our focus in this study, as these are determined by the prop-erties of the rate equations on the bulk surface—the defects simply start them off. On the other hand, one would expect to see successive waves of fronts emerging from such per-sistent defects. As it is not clear exactly how to mimic de-fects we decided to choose a method that has the least impact on the long-term results.
A systematic exploration of the behavior of the system as a function of partial pressures was performed at a fixed surface temperature of 480 K. For the simulations summa-rized in Fig. 4共a兲, the integration time was 1000 s, while those described in Fig.4共b兲were continued for up to 4000 s in order to determine whether long-period oscillations were present.
The presence of initial surface inhomogeneities was found to affect the behavior of the system crucially and, under certain conditions of reactant partial pressures, to lead to the formation of traveling waves. In experiments, the tem-poral variation of the reaction rate was found to parallel that of the work function,⌬. The latter has, therefore, been used to monitor the occurrence of oscillatory behavior, as mea-sured by a Kelvin probe.1,16,18 The experimental parameter range for sustained temporal oscillations was mapped by Eiswirthet al.1by varying the partial pressures of O2and CO 共pO2 and pCO兲 at a constant surface temperature of 480 K.
Three distinct regions of phase space were found in their study and are summarized in Fig.4, alongside those obtained by our model. Maximum amplitudes were established under
experimental conditions whenever the CO pressure was ad-justed in such a way that the CO coverage in a CO atmo-sphere alone would be aroundCO= 0.5. Furthermore, a de-crease in pCO and temperature was found to be associated with an increase in the oscillation period.18Oscillations were never found below pCO= 3⫻10−6Torr共Ref. 1兲at the range
of surface temperatures investigated and were found to be mainly irregular in nature, with few regions exhibiting regu-lar oscillatory behavior.4,17–19The irregularity of the oscilla-tions suggests that they are not in phase across the whole surface and might signal the presence of traveling waves or other spatial patterns.
The results of our model simulations also divide the pa-rameter space of reactant partial pressures共pO2andpCO兲into
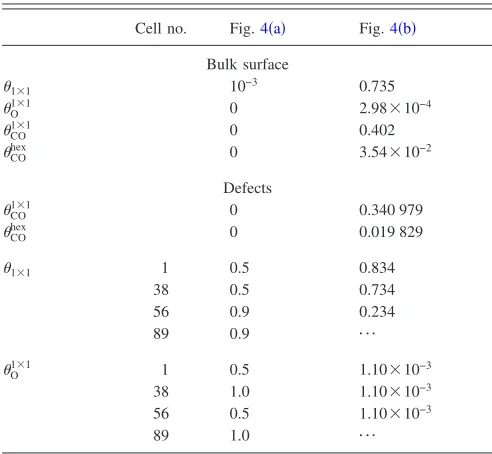
[image:8.612.320.552.46.418.2]three regions defined by solid lines in Fig.4, which can be thought of roughly as low CO-coverage states 共region ␣兲, TABLE II. Initial conditions used in the 1D simulations summarized in
Fig.4.
Cell no. Fig.4共a兲 Fig.4共b兲
Bulk surface
1⫻1 10−3 0.735
O1⫻1 0 2.98⫻10−4
CO1⫻1 0 0.402
COhex 0 3.54⫻10−2
Defects
CO
1⫻1 0 0.340 979
COhex 0 0.019 829
1⫻1 1 0.5 0.834
38 0.5 0.734
56 0.9 0.234
89 0.9 ¯
O1⫻1 1 0.5 1.10⫻10−3 38 1.0 1.10⫻10−3 56 0.5 1.10⫻10−3
89 1.0 ¯
FIG. 4. The existence regime for sustained oscillations in our model 共*/䊐/〫/䊊and solid lines兲for the two sets of initial conditions given in TableII, compared with experimental observations共Ref.1兲 共⫹and dashed lines兲.共a兲also appears as Fig. 1 of Ref.15关Hoyle, Anghel, Proctor, and King, Phys. Rev. Lett. 98, 226102 共2007兲兴. “Copyright 共2007兲 by the American Physical Society.” Key: */䊐/〫, steady evolution to low/ medium/high CO state and䊊, regular surface oscillations. In simulations, region␣corresponds to low CO and 1⫻1 coverages, regionto high CO and 1⫻1 coverages, and region␥to oscillations. The solid lines show the oscillation regime defined using a cutoff of 1000 s for the oscillation period and in共b兲, the region defined using a 3000 s cutoff is marked by dashed-dotted lines. Experimental regions A, B, and C 共Ref. 1兲 are defined by surfaces showing low and high CO coverages and oscillations, respectively.
[image:8.612.49.295.70.297.2]high CO-coverage states 共region 兲, and oscillatory states
共region ␥兲. Below, we discuss the types of solution to be found in each region 共illustrated in Figs.5–10兲, characteriz-ing them by the total carbon monoxide and oxygen cover-ages of the surface,1⫻1CO1⫻1+hexCOhexand1⫻1O1⫻1, respec-tively.
Region ␣, where pCO is low, corresponds to solutions
that evolve steadily to surfaces with low 1⫻1 and low total CO coverages. The final low CO state in Fig. 5 共total CO coverage of 0.19 at t= 2999 s兲 also has comparatively low 1⫻1 coverage 共0.51兲 and very low total oxygen coverage
共1.3⫻10−4兲.
Region , corresponding to high values of pCO to the
right of region ␥, is characterized by homogeneously high 1⫻1 coverages, with very low total oxygen coverages and comparatively high total CO coverages. For example, the simulation shown in Fig.6 has typical values of 0.93, 0.38, and 7.0⫻10−5for the 1⫻1, total CO, and total oxygen cov-erages, respectively, at time t= 999 s. These high CO solu-tions typically approach their final coverages much more rapidly than the low CO states in region␣.
Region␥contains regular surface oscillations共Fig.7兲; it is V shaped and tilted toward higher values of pCO. The range of oscillation periods was roughly 80– 2700 s, with shorter periods in the midrange ofpCOand for higher values of pO
2. It is not obvious how to distinguish between very long-period oscillations 共that might not be easy to observe experimentally兲 and steady evolution. In Fig. 4共a兲, we as-sumed that any solution that had not repeated within 1000 s was steady, and in Fig.4共b兲, we compared 1000 and 3000 s cutoffs. As can be seen in Fig.4共b兲, a lower threshold for the period pushes the triple point between regions ␣,, and ␥ toward higher values of the two reactant partial pressures, improving the match with experimental data.1This could be explained if very long-period oscillations were hard to ob-serve experimentally. On the other hand, longer integration
times lead to a clear distinction between regions ␣ and  below region␥ 关shown as a dotted-dashed line in Fig.4共b兲兴 as in experiment. This is replaced by a transition via medium-CO solutions when simulations are run only for 1000 s 关solid line in Figs.4共a兲and4共b兲兴.
We saw two types of propagating front in our simula-tions, which we denote as CO and oxygen-CO. The CO fronts are found for the full range of partial pressures, pro-voked early on by low 1⫻1, O
1⫻1
, COhex, and medium/high
CO1⫻1defects in surfaces where1
⫻1was initially high. Since
the CO fronts move quite slowly, we had to use finer 200
⫻200 or 200⫻1 grids in order to measure their progress with sufficient accuracy that we could capture their speeds to within 10%. For low pCO and pO2 of 3.5⫻10−5mbar and
above in Fig. 4共b兲, we have a CO front, followed by small-amplitude oscillations. The period of the ensuing oscillations is longer for lower pO2 and lower pCO 共in agreement with
experiment18兲. We also performed simulations using bulk ini-tial conditions 1⫻1= 0.7, O1⫻1= 0.95, and CO1⫻1=COhex= 0.01, with defects of 1⫻1=O1⫻1=COhex= 0.01 and CO1⫻1= 0.45, and
found a range of CO front speeds from 0.13 to 14m s−1
compared with 2 – 50m s−1experimentally.2,4,19For the ex-ample in Fig. 8, the speed is approximately 0.3m s−1. We
see that the surface initially has high 1⫻1 and total oxygen coverages, with an insignificant total coverage of CO. The defects provoke waves of CO, at quite modest coverage, which spread out and displace the oxygen ahead. Phase re-laxation takes place at the leading edge of the front, so the surface is predominantly in the hex phase behind it. Once the front has passed, there are low-amplitude oscillations in the coverages behind it, with the total CO coverage remaining low and the total oxygen coverage negligible. For high pO2
and lowpCOin Fig.4共b兲, the CO fronts travel until they meet
another such front but as we approach pO 2= 3.5
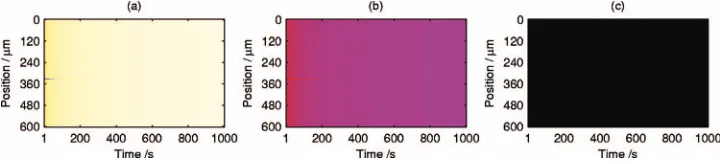
[image:9.612.123.486.50.131.2]⫻10−5 mbar, they become localized close to the original de-FIG. 5.共Color兲Steady evolution to a low CO state atpO2= 3⫻10−5mbar andpCO= 1⫻10−6mbar with the same initial conditions as for Fig.4共b兲. Space-time diagrams for共a兲1⫻1,共b兲total CO, and共c兲total O coverages; att= 2999 s, typical values for these are 0.51, 0.19, and 1.3⫻10−4, respectively. Colorscale: 0.0= black⬍red⬍blue⬍yellow⬍white= 1.0.
FIG. 6.共Color兲Steady evolution to a high CO state atpO2= 2⫻10−5mbar andpCO= 3⫻10−6mbar with the same initial conditions as for Fig.4共b兲. Space-time diagrams for共a兲1⫻1,共b兲total CO, and共c兲total O coverages; att= 999 s, typical values for these are 0.93, 0.38, and 7.0⫻10−5, respectively. Colorscale is the same as for Fig.5.
[image:9.612.124.484.640.722.2]fect and very short-lived. For the initial conditions used in Fig.8, higherpCOand lowerpO2lead to lower total oxygen
coverage ahead of the front and higher 1⫻1 and total CO
coverages behind it, so the phase relaxation is less marked
共though, there is still a pronounced dip in 1⫻1 coverage at the leading edge of the front, even when it recovers behind兲 and the CO fronts move faster, supporting the argument4,19 that the relatively slow speed of CO waves arises from the phase transition at the front.
Oxygen-CO fronts are also triggered by defects and con-sist of a wave of CO following closely on the heels of an oxygen wave. They are found on the lefthand side of region
␥ at highpO2. When pO2 is lower, they can occur for values
of pCO on either side of region ␥ and also on the border between regions ␣ and , depending on the initial condi-tions. In region␥, the fronts are followed by oscillations. The wave speed and oscillation period are correlated: where the oscillations are faster or slower, so are the preceding waves. In our simulations, both CO and oxygen-CO fronts often coexist with oscillations, so the overall reaction rate or work function oscillations will appear irregular, as is typically observed.4,17–19 Figures 10共d兲–10共f兲 show an oxygen front
共triggered by the defect in cell 1兲at the sides of the domain, moving into an initial solution with high 1⫻1, medium total CO, and very low total oxygen coverages. The reaction wave removes the adsorbed CO, and there is some phase relax-ation at the front so the 1⫻1 coverage falls. A wave of CO follows a few seconds later关Figs.10共g兲–10共i兲兴, removing the oxygen in turn. After the two consecutive waves have
passed, the surface recovers to its initial state. Similar com-binations of oxygen and CO fronts have been observed in experiment关see Fig. 6 of Ref.4 共which also appears as Fig. 3 of Ref. 19兲兴. During phase relaxation the 1⫻1 coverage does not fall as far as for the CO fronts discussed above, so the speed of the simulated oxygen-CO fronts is higher4,19 in the range of 13– 90m s−1. The oxygen front shown in Fig.
10 is moving at approximately 37m s−1 and the speed of
the subsequent CO front is about 36m s−1. In comparison,
Lauterbach and Rotermund4 measured CO front speeds be-tween 2 and 26m s−1and oxygen front speeds between 50
and 240m s−1, though they were working at slightly higher
partial pressures than we have used.
Comparing Figs.4共a兲and4共b兲shows the importance of initial conditions. Hysteresis appears to be present in the simulations in that the bulk initial conditions influence the state of the surface at long times and can shift the boundaries between regions ␣,, and ␥, with low initial CO coverage moving them toward higher pCOand vice versa. Experimen-tally,pCOwas repeatedly increased and decreased in order to confirm the extent of region C: this led to large error bars on the position of the boundaries共not shown in Fig.4兲, suggest-ing that the history of the partial pressures and surface state is indeed important. We found that the choice of defect initial conditions typically determines the initial transient behavior, for instance, provoking front propagation共Fig.8兲. However, it is possible for the effect of defects to be long lasting. Figure 11共a兲shows a simulation at pCO= 6⫻10−7 mbar and
[image:10.612.124.488.50.131.2]pO2= 1⫻10−5 mbar with the same initial conditions as for
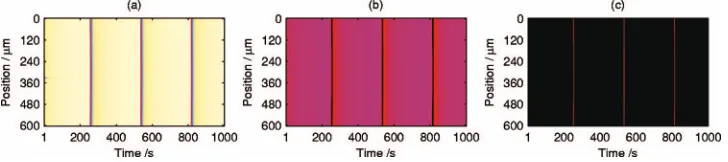
FIG. 7. 共Color兲Regular surface oscillations atpO2= 7⫻10−5mbar andpCO= 4⫻10−6mbar with the same initial conditions as for Fig.4共b兲. Space-time diagrams for共a兲1⫻1,共b兲total CO, and共c兲total O coverages. Colorscale is the same as for Fig.5.
FIG. 8.共Color兲CO front atpO2= 6⫻10−5mbar andpCO= 1⫻10−6mbar with bulk initial conditions1⫻1= 0.7,O1⫻1= 0.95, andCO1⫻1=COhex= 0.01 and defects, where1⫻1=O
1⫻1= CO
hex= 0.01 and CO
1⫻1= 0.45 in cells 1–2, 75–76, 111–112, and 179–180. Space-time diagrams for共a兲1⫻1,共b兲total CO, and共c兲total O coverages. Colorscale is the same as for Fig.5. Snapshots at timet= 149 s for共d兲1⫻1,共e兲total CO, and共f兲total O coverages.
[image:10.612.125.484.544.721.2]Fig.4共b兲, and Fig.11共b兲shows the effect of changing1⫻1in cell 1 to 0.01 from 0.834. The long-term 1⫻1 coverage is changed from fairly uniformly low to a profile that varies between low and medium across the surface. We did not find any other persistent effects of defects共though, neither did we carry out an exhaustive search兲and hypothesize that in this case, proximity to the region␣/ border may be important. We now compare the results of our model with experi-ment. Eiswirth et al.1 found two nonoscillating regions, A and B and an intermediate region where oscillations in the work function were observed. The existence region for self-sustaining work function oscillations, labeled as C is V shaped with a tilt toward higher CO pressures, in agreement with our model region␥. However, the experimental region is shifted to higher pCO pressures compared to our model.
This might arise from a difference in the way the partial pressures were set: while the values ofpCOandpO2are fixed
throughout each of our simulations, the experimental protocol1 involved setting pO
2 to a constant value and ini-tially increasingpCOin steps. The position of the experimen-tal region was then determined in both directions by repeat-edly increasing and decreasingpCO. The error bars inpCOfor
the boundary position were large. Taking into account the initial stepwise increase, it is likely that the average value of pCOover a single run was lower than the final value used in
plotting the experimental region and perhaps, this is impor-tant. If the experimental region were plotted using this lower average pCO value, it would be shifted toward lower pCO,
possibly closer to our model region ␥. The triple point be-tween the three regions is also at lower pO2 in our model,
[image:11.612.126.486.50.130.2]compared to experiment, if we use a 3000 s cutoff to distin-guish between steady and oscillatory solutions. Adopting a lower period cutoff for distinguishing between oscillatory and steady structures corrects this关Fig.4共b兲兴, but at the ex-pense of designating some solutions we know to be periodic as steady. However, it seems likely that very long-period oscillations would be hard to observe experimentally as they would be vulnerable to disruption by small fluctuations in experimental conditions. Although, we stated when introduc-ing the kinetic rate equations that adoptintroduc-ing over the whole 1⫻1 surface the 共higher兲 oxygen sticking probability for freed rather than “free” sites makes little difference in our model, it is likely to be a reason for the shift of the triple point to lower pO2 since this is very sensitive to small
[image:11.612.126.485.453.720.2]FIG. 9. 共Color兲Oxygen front followed by CO front followed by steady evolution to low CO state atpO2= 2⫻10−5mbar andpCO= 1⫻10−6mbar with the same initial conditions as for Fig.4共b兲. Space-time diagrams for共a兲1⫻1,共b兲total CO, and共c兲total O coverages. Colorscale is the same as for Fig.5.
FIG. 10. 共Color兲Oxygen front followed by CO front at pO2= 7⫻10−5mbar and pCO= 3⫻10−6mbar with the same initial conditions as for Fig.4共b兲. Space-time diagrams for共a兲1⫻1,共b兲total CO, and共c兲total O coverages. Colorscale is the same as for Fig.5. Snapshots at timet= 82 s for共d兲1⫻1,共e兲total CO, and共f兲total O coverages and关共g兲–共i兲兴at timet= 90 s.
changes in the experimental conditions and the cutoff values chosen. Finally, the presence of a traveling wave component in many of our oscillatory solutions fits with the experimen-tal observation that work function oscillations are typically irregular.4,17–19
For experimental region A, where the CO pressure is very low, the work function was found to be constant and high, which was interpreted in terms of excess oxygen being present on the surface. This region matches well with the results within region ␣ from our model, where solutions
show high total oxygen coverage共e.g., before the passing of the CO front in Fig. 8兲 and/or relatively low coverage of chemisorbed CO that does not hinder uptake of oxygen at the surface. For region B, the work function was found to be low and constant. This has been interpreted in terms of a high CO coverage that inhibits O2adsorption, again in agreement with
region in our theory model.
In experiments, the periods for self-sustaining oscilla-tions with amplitudes in ⌬ between 100 and 300 mV ranged typically between 1 and 4 min at temperatures around 500 K, while at lower temperatures, periods of up to 10 min and longer were observed. Faster oscillations, with periods as short as a few seconds, were found at small amplitudes.18 Our model also finds a wide range of oscillation periods within the mapped region ␥, from 80 s to 45 min, with the fastest oscillations being found in the midrange of pCO and
for higherpO2. The oscillations in our simulations appear to
be of somewhat longer period than those observed experi-mentally, though the partial pressures we used were typically somewhat lower, which may account for the difference. In the next section, we discuss our 2D simulations and compare the carbon monoxide and oxygen-CO fronts we see with those observed experimentally during pattern formation.
RESULTS: 2D MODEL
A two-dimensional CO front is shown in Fig.12for the same partial pressures as the 1D case illustrated in Fig. 8. Reaction fronts can be seen propagating outwards from de-fects at an initial speed of approximately 0.24m s−1. Ini-tially, the fronts are approximately circular, but they become distorted as they interact. Ahead of the wave, the surface is predominantly covered by oxygen on 1⫻1 phase, while be-hind it, the surface is in hex phase with no adsorbed oxygen and a modest coverage of CO. We would expect oscillations at low 1⫻1 and CO coverages in the wake of the front, as in the 1D case. The initial wave speed is 0.24m s−1, which is
a little slower than for the 1D case. This is possibly due to the curved shape of the 2D front and the influence of other nearby fronts.
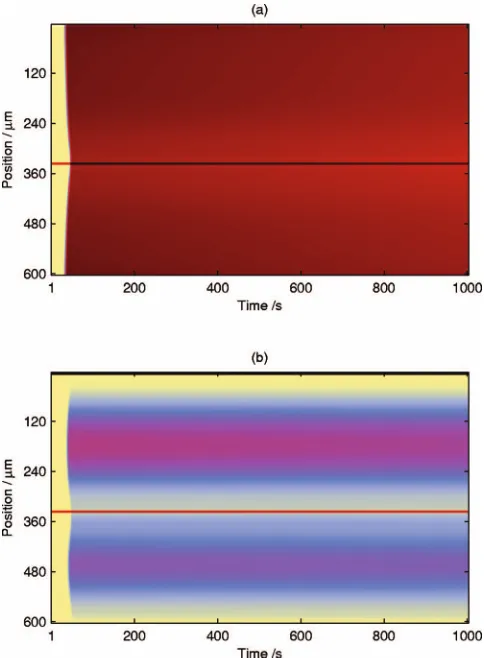
[image:12.612.52.294.48.377.2]In order to investigate the structure of two-dimensional oxygen-CO fronts, we present a series of snapshots共Fig.13兲 of the 1⫻1, total CO, and total oxygen coverages between FIG. 11.共Color兲The effect of changing1⫻1from共a兲0.834 to共b兲0.01 in
cell 1 is long lasting atpO2= 1⫻10−5mbar andpCO= 6⫻10−7mbar with the same remaining initial conditions as for Fig.4共b兲. Space-time diagrams are shown for the 1⫻1 coverage. Colorscale is the same as for Fig.5.
FIG. 12.共Color兲Space-space diagrams共600⫻600m2= 3.6⫻105m2兲showing the variation in the共a兲1⫻1,共b兲total CO, and共c兲total oxygen coverages during the passage of a simple CO front in a 2D simulation. Colorscale is the same as for Fig.5. The reactant partial pressures arepO2= 6.0⫻10
−5mbar and
pCO= 1.0⫻10−6mbar, and the temperature is 480 K. The elapsed time,t, since the beginning of the simulation is 500 s. The bulk initial conditions are共1⫻1,
O1⫻1,CO1⫻1,hexCO兲⫽共0.735, 2.98⫻10−4, 0.402, 3.54⫻10−2兲, and there are 2⫻2 cell defects where共O1⫻1,CO1⫻1,COhex兲⫽共1.10⫻10−3, 0.341, 1.98⫻10−2兲, and
1⫻1= 0.134, 0.234, 0.334, 0.134, 0.234, and 0.334 with bottom left corners at共1,1兲,共75,111兲,共51,91兲,共121,21兲,共171,151兲, and共7,155兲, respectively, on a 200⫻200 grid.共See also Fig. 2 of Ref.15.兲
[image:12.612.125.487.580.694.2]integration times t= 79 and 100 s for pO2= 7.0⫻10−5 mbar
andpCO= 3.0⫻10−6mbar. The reactant partial pressures and
the temperature are the same as for the 1D simulation shown in Fig.10, and as expected, the qualitative behavior is the 2D analog of that seen in the 1D case. Roughly circular reaction waves propagate outwards from the defects, while the sur-face undergoes regular oscillations. Much less than one pe-riod of oscillation is shown in the figure so that we can
[image:13.612.50.354.47.642.2]capture the passing of the successive CO and oxygen fronts. Initially 共time t= 79 s兲, the surface is in a high 1⫻1 state with relatively high total CO coverage and very low levels of adsorbed oxygen. At timet= 86 s共second row in Fig.13兲, an oxygen wave spreads out from the defect in cell共38,13兲and CO coverage drops ahead of it. Byt= 87 s, a moderate con-centration of adsorbed oxygen covers nearly all the surface, and the fraction of 1⫻1 phase starts to drop. The coverages FIG. 13. 共Color兲Time sequence of space-space dia-grams for a simulation withpO2= 7.0⫻10−5mbar and
pCO= 3.0⫻10−6mbar, showing the structure of the oxygen-CO reaction wave fronts. The lefthand, center, and righthand plots show the 1⫻1, total CO, and total oxygen coverages, respectively. Colorscale is the same as for Fig.5. The rows give snapshots at timest=共a兲 79,共b兲86,共c兲87,共d兲94,共e兲95, and共f兲100 s. The bulk initial conditions are 共1⫻1, O1⫻1, CO1⫻1,COhex兲⫽共0.735 2.98⫻10−4, 0.402, 3.54⫻10−2兲, and there are single cell defects, where 共O1⫻1,
CO 1⫻1,
CO
hex兲⫽共1.10⫻10−3, 0.341, 1.98⫻10−2兲, and
1⫻1= 0.834, 0.134, 0.934, and 0.234 in cells共1,1兲,共9,61兲,共38,13兲, and共96,46兲, respec-tively, on a 100⫻100 grid.
of 1⫻1 phase and oxygen both now drop over the entire surface, and total CO coverage remains low共t= 94 s, fourth row of Fig.13兲untilt= 95 s when a low-amplitude CO front spreads out from the defect at position共38,13兲. Byt= 100 s, levels of CO and 1⫻1 are recovering. Although phase change occurs during the passage of the combined oxygen-CO front, it is not as dramatic and sharply defined spatially as in the case of the simple CO front.
It was difficult to make an accurate estimate of the oxygen-CO front speeds owing to the presence of the back-ground oscillations and the complexity of the patterns pro-duced by the interacting defects. Comparing oxygen cover-age patterns at timest= 86 and 87 s, the initial oxygen wave appears to be traveling quite fast: between about 250 and 300m s−1. The subsequent CO front seems to be moving more slowly, with its speed being estimated at between 10 and 20m s−1. It is interesting to note that the oxygen wave
speed is much faster than in the corresponding one-dimensional case 共Fig. 10兲. The curvature of the two-dimensional front and the influences of other defects共which are different in the two situations兲 might account for this difference. It appears from Fig.13that the residual effect of the defects at cells共9,61兲and共96,46兲may also be important. We now compare our two-dimensional simulations with experiment. There are comparatively few experimental stud-ies showing pattern formation during CO oxidation on Pt兵100其, in contrast with the case of a Pt兵110其surface, where rotating spirals and pulsating target patterns, the two-dimensional equivalents of traveling waves, are commonly observed. This difference in behavior is attributed to the dif-ference in kinetics of the phase transitions and the fact that for Pt兵100其, the adsorption probability of oxygen on the hex phase is about 100 times less than that on the 1⫻1 phase, while for Pt兵110其, the difference is only about a factor of 2.19 Where two-dimensional patterns have been observed on Pt兵100其, they are usually much more irregular than the spi-rals and targets typical of oscillatory systems in general.
Continuously varying spatial pattern formation has been seen on Pt兵100其 at temperatures of 480– 500 K and partial pressurespO2 in the range of共5 – 9兲⫻10−5mbar and pCOin
the range of 共5 – 8兲⫻10−6mbar using LEED.2
The surface was covered in irregular patches of adsorbed oxygen and CO whose arrangement changed in time through wave propaga-tion. Typically, a CO island of a few microns across would be nucleated and then expand with constant velocity into the oxygen-covered surface. The CO island would then rapidly change to a high-oxygen state, which would finally shrink, in turn, as neighboring CO patches invaded. Oxygen waves were also seen. The CO and oxygen wave fronts moved with speeds in the range of 共0.5– 3兲mm min−1共8.3– 50m s−1兲.
Subsequent photoemission electron microscopy共PEEM兲 experiments also imaged dynamic spatiotemporal pattern for-mation during CO oxidation on Pt兵100其. The first investiga-tion of this type in the parameter regime for sustained oscillations3 共380– 530 K and pCO and pO2 up to several
times 10−4mbar兲found rapidly changing patterns where
ar-eas of high-oxygen coverage formed spontaneously at ran-dom locations and propagated in irregular waves across the surface, finally diminishing after about 40 s. The velocity of
the oxygen fronts was measured at⬃100 m s−1at a surface
temperature of 480 K and partial pressures pO2= 2.85 ⫻10−4 mbar andpCO= 2.0⫻10−5 mbar. Less frequently
ob-served but nevertheless present were slower moving and fairly isotropic trigger waves of oxygen islands originating from a few nucleation centers and growing in roughly circu-lar patterns on a time scale of several minutes. The oscilla-tions associated with these circular patterns were of large amplitude and fairly regular periodicity.
PEEM studies by Lauterbach and Rotermund4 共also re-cently reviewed and summarized in Ref.19兲at temperatures between 420 and 540 K, with fixed pO
2= 4⫻10
−4 mbar and
variable CO partial pressure of a few times 10−5mbar, found both CO and oxygen fronts. At T= 475 K and pCO= 1.8 ⫻10−5 mbar, for example, a CO island nucleated on an oxygen-covered surface and spread in a fairly isotropic man-ner, before itself being consumed by a faster-moving oxygen front coming in from behind. In contrast, at T= 475 K and pCO= 3.6⫻10−5mbar, many smaller irregular patches could
be seen. Oxygen fronts advanced into CO-covered areas, fol-lowed immediately by new CO fronts. The speeds of oxygen fronts lie in the range of 50– 240m s−1, while CO fronts
were much slower at 2 – 26m s−1. The difference was attributed19to the fact that the coverage at the reaction inter-face of CO fronts was low enough to initiate the 1⫻1 to hex phase transition, while for oxygen fronts, this was not the case.
Comparing our simulations with these experimental findings, the CO fronts in our model correspond closely to those observed in the early LEED study2and in the PEEM experiments of Lauterbach and Rotermund.4The experimen-tal wave speeds are an order of magnitude greater than we found for our model, but in both cases, one or both of the reactant partial pressures were higher than those for which we found simple CO fronts. In agreement with Refs. 4 and 19, we find that the slow speed of propagation corresponds to the surface undergoing phase change at the front. Lauterbach and Rotermund4suggest that the 1⫻1 coverage dips at the leading edge of the front and recovers behind it. This is similar to what we see at higher pCO, while for low values,
the surface remains in the hex phase behind the front. The combined oxygen-CO fronts we see somewhat re-semble the patterns seen by Lauterbach and Rotermund,4 cre-ated by consecutive waves of oxygen and CO, though the experimental pressures are an order of magnitude higher than we used in our calculations, so the results are not directly comparable. The temperature and partial pressures we chose are closest to those of the early LEED experiments,2 where both oxygen and CO waves were observed, though at low resolution and so with less detail than in the later studies. Our simulated reaction waves travel at speeds that are in broad agreement with those seen in the experiments of Lau-terbach and Rotermund, and in keeping with the argument of Lele and Lauterbach19 for faster oxygen than CO fronts, we find that the phase change is more gradual and of lower amplitude for oxygen-CO fronts compared with the slower-moving simple CO fronts 共see the 1D results in Figs.8and10兲.
DISCUSSION
Our mesoscopic spatiotemporal model is a faithful and detailed mathematical representation of the catalytic oxida-tion of carbon monoxide on Pt兵100其at low pressures incor-porating a large amount of experimental data. It splits the
共pO
2andpCO兲parameter space, according to the type of pat-tern observed, into regions of very similar shape to those mapped out experimentally. Given the complexity of the de-tailed reaction dynamics included in the model, we were pleased by the closeness of the match. It certainly suggests that our mesoscopic modeling approach, where spatial infor-mation is determined on a scale intermediate between the microscopic spacing of the platinum atoms and the macro-scopic length scale of pattern formation, captures the charac-ter of these surface patcharac-terns accurately. Compared with mi-croscopic 共lattice gas兲 simulations, our method is faster and requires less computational effort over larger areas of surface and so is efficient for the investigation of patterns that typi-cally occur at scales much longer than the adsorption site spacing.
The experimental region exhibiting self-sustaining oscil-lations is slightly shifted toward higher pO2 and pCOpartial
pressures compared with the results of our model. The move to lowerpO
2 in our simulations can be explained by the fact that we use the slightly higher oxygen sticking probability for freed 共as opposed to free兲 sites over the whole 1⫻1 phase and by the difficulty of determining cutoffs to distin-guish between stationary and oscillatory behaviors. The shift to a lowerpCOmight be explained by the fact thatpCOwas
increased stepwise in the experiments and then was iterated about its final value, giving a lower average value over the course of the pattern evolution compared to our simulations where the target pCO was fixed from the beginning. If the
experimental region had been plotted using this lower aver-age value ofpCO, it would be shifted toward lower values of
pCO and so might lie closer to the oscillatory region
deter-mined from the simulations.
The passing of successive waves of adsorbed oxygen and carbon monoxide is characteristic of the continuously varying spatial pattern formation seen in the experiment.2–4 Our simulations reproduce this aspect of the reaction well: we see two types of traveling wave 共CO and oxygen-CO兲
that correspond reasonably closely in terms of speed and extent of phase change to experimentally observed CO and oxygen fronts. The mesoscopic approach that we have found successful here in modeling the oxidation of CO on Pt兵100其 can be adapted to other surface reactions where there is spa-tial organization on scales that are long compared with the spacing between surface atoms.
ACKNOWLEDGMENTS
This work was supported by the Leverhulme Trust.
1M. Eiswirth, R. Schwanker, and G. Ertl, Z. Phys. Chem., Neue Folge
144, 59共1985兲.
2H. H. Rotermund, S. Jakubith, A. von Oertzen, and G. Ertl, J. Chem. Phys. 91, 4942共1989兲.
3H. H. Rotermund, W. Engel, M. Kordesch, and G. Ertl, Nature共London兲
343, 355共1990兲.
4J. Lauterbach and H. H. Rotermund, Surf. Sci. 311, 231共1994兲. 5T. Engel and G. Ertl, J. Chem. Phys. 69, 1267共1978兲. 6G. Ertl, Surf. Sci. 287, 1共1993兲.
7P. Heilmann, K. Heinz, and K. Müller, Surf. Sci. 83, 487共1979兲. 8Y. T. Yeo, C. E. Wartnaby, and D. A. King, Science 268, 1731共1995兲. 9A. Hopkinson and D. A. King, Faraday Discuss. 96, 255共1993兲. 10A. Hopkinson, X.-C. Guo, J. M. Bradley, and D. A. King, J. Chem. Phys.
99, 8262共1993兲.
11A. Hopkinson and D. A. King, Chem. Phys. 177, 433共1993兲. 12D. A. King, Surf. Rev. Lett. 1, 435共1994兲.
13P. A. Thiel, R. J. Behm, P. R. Norton, and G. Ertl, J. Chem. Phys. 78, 7448共1983兲.
14A. Hopkinson, J. M. Bradley, X.-C. Guo, and D. A. King, Phys. Rev. Lett. 71, 1597共1993兲.
15R. B. Hoyle, A. T. Anghel, M. R. E. Proctor, and D. A. King, Phys. Rev. Lett. 98, 226102共2007兲.
16G. Ertl, P. R. Norton, and J. Rüstig, Phys. Rev. Lett. 49, 177共1982兲. 17M. P. Cox, G. Ertl, and R. Imbihl, Phys. Rev. Lett. 54, 1725共1985兲. 18R. Imbihl, M. P. Cox, and G. Ertl, J. Chem. Phys. 84, 3519共1986兲. 19T. Lele and J. Lauterbach, Chaos 12, 164共2002兲.
20M. A. Barteau, E. I. Ko, and R. J. Madix, Surf. Sci. 102, 99共1981兲. 21M. Gruyters, T. Ali, and D. A. King, Chem. Phys. Lett. 232, 1共1995兲. 22M. Gruyters, T. Ali, and D. A. King, J. Phys. Chem. 100, 14417共1996兲. 23A. Borg, A.-M. Hilmen, and E. Bergene, Surf. Sci. 306, 10共1994兲. 24I. M. Irurzun, R. B. Hoyle, M. R. E. Proctor, and D. A. King, Chem.
Phys. Lett. 377, 269共2003兲.
25N. McMillan, T. Lele, C. Snively, and J. Lauterbach, Catal. Today 105, 244共2005兲.
26J. Lauterbach and H. H. Rotermund, Catal. Lett. 27, 27共1994兲. 27S. Jakubith, H. H. Rotermund, W. Engel, A. von Oertzen, and G. Ertl,
Phys. Rev. Lett. 65, 3013共1990兲.
28P. van Beurden, B. S. Bunnik, G. J. Kramer, and A. Borg, Phys. Rev. Lett. 90, 066106共2003兲.