(Not to be used for LINK projects)
Two hard copies of this form should be returned to:
Research Policy and International Division, Final Reports Unit MAFF, Area 6/01
1A Page Street, London SW1P 4PQ
An electronic version should be e-mailed to c.csgfinrep@csg.maff.gsi.gov.uk
Project title
Organic dairy cows: milk yield and lactation characteristics in thirteen
established herds and development of a herd simulation model for organic
milk production
MAFF project code
OF0170
Contractor organisation
and location
University of Reading
Whiteknights House
Whiteknights
Reading RG6 6AH
Total MAFF project costs
£ 34,504.00
Project start date
01/07/00
Project end date30/09/00
Executive summary (maximum 2 sides A4)
As a consequence of organic standards and principles, organic dairy producers are frequently faced with a different set of management considerations than those found in conventional dairy systems. The broad objective of this study was to examine in detail the production characteristics of 13 well-established organic dairy herds, and to relate these to the specific conditions that exist within organic dairy farming.
Monthly milk records for 13 organic herds for three years were collected and converted into a Microsoft Access™ database, using InterHerd™ (Agrisoft Plc., UK) herd management software. The data were sorted and analysed using the InterHerd™-herd management, Excel for Windows™ and Statistix for Windows™ software programmes. Estimated parameters were used to examine the importance of two important indicators: lifetime yield/lactation length and economic efficiency. To assess the first, a spreadsheet model based on the Wood's lactation curve was developed. With regard to the latter, a model calculator was used. Five herds were chosen for case studies, that examined the farm performance by using InterHerd™-generated data and by interviewing the producer retrospectively and asking him to comment on the data.
Results
Milk yield and lactation characteristics
The 13 established, organic herds were characterised with relatively low yields, but herd variation was great: from a total lactation yield of 5,100 kg to 7,000 kg. Milk fat and protein content, lactation length and individual cow SCC means were similar to those reported in conventional, milk recorded herds.
Lactation yields increased up to the third lactation, whereas persistency of lactations decreased up to the third lactation. This pattern followed similar patterns reported in conventionally managed herds. Similarly, somatic cell counts increased with parity, mimicking similar phenomenon reported in conventionally managed dairy cows.
Wood's lactation curve model, used to describe lactation shape based on days in milk, was a suitable model for lactations of organically managed cows. The fit of the model was improved by using fat corrected milk yields; i.e. herd management software using Wood's curve to predict milk yields is suitable for organic systems.
It was notable, however, that there were two basic types of Wood’s curve represented among the 13 farms. Those with a positive value for the ‘b’ parameter have a convex curve with a distinct peak some weeks after calving. Those with a negative value for the ‘b’ parameter have a concave curve, which declines from the day of calving, with no distinct peak. The herds with concave curve also tended to have lower decline in milk yield in late lactation and lower overall lactation yield.
There was a limited amount of data on genetic merit of the cows. Using sire £PIN as an indicator of genetic merit (available for black and white herds only and for approximately 60% of the cows), initial analysis suggests that £PIN values increased with decreasing parity and that there was very little correlation with yield and £PIN in lactations above the second parity.
Fertility
Mean calving to 1st service intervals and calving intervals remained relatively low in all but two herds, compared to figures reported from conventional, recorded dairy herds nationally. The number of services per conception was somewhat higher than that reported in conventional herds. Subsequently, the overall conception rates remained low in the organic herds, suggesting that relaxed calving patterns encourage repeated services.
Whilst there was a detectable trend for poorer performance in fertility amongst the organic cows as milk yields increased the differences were not significant. It is likely that the milk yields in the survey herds are not high enough to cause primary drop in fertility.
Month of calving and parity did not appear to have significant effect on fertility parameters, but this conclusion should be considered in the light of the great variation in the number of cows calving in different months and in the herd bias caused by different calving patterns and fertility management between herds. Slightly longer calving to first service and calving intervals for cows calving in summer may be a result of intentional delay in first service in order to maintain autumn calving pattern.
It is concluded that fertility performance in terms of culling for fertility and mean calving intervals were better in the organic survey herds when compared with existing data from conventionally managed UK dairy herds. Good fertility performance even in the highest yielding organically managed cows suggests that early lactation energy deficit may not be a major problem in these herds. It is also suggested that financial impact of high number of services per conception, as observed in majority of the survey herds, may be insignificant as the main losses caused by poor fertility are attributable to culling and prolonged calving intervals.
Herd models
Herd productivity indices were generated, using an existing model based on a measure of feed conversion efficiency at the herd level. The advantage of using this approach in the estimation of productivity is that it takes full account of the entire feed input to the system, including forage.
The production index was closely and independently associated with yield and calving rate. Culling was not
independently associated with the production index but once calving rate and lactation yield are taken into account, culling rate also becomes a significant factor.
A spreadsheet model of the lifetime production of a cow, from first calving to culling at the end of a given lactation was useful in calculating the effect of different calving interval and length of lactation on lifetime yield.
The net loss per extra week calving interval ranged from £3.89 to £10.96. Persistency, as calculated here, does not appear to be a good indicator of the extent to which herds will suffer from extended calving intervals. A better indicator is the rate of decline of yield in late lactation. The spreadsheet model was used to discover the decline rate, which must be achieved to produce a zero net effect of calving interval on annual output. Decline rates of between 0.010 kg per day and 0.017 kg per day were found to negate the net effect of extended calving interval on annual output. However, none of the 13 organic herds studied produced lactations, which met this threshold.
Case studies
Case studies demonstrated the usefulness of recorded data analysis, using herd management software and observation of seasonally adjusted lactation curves to examine feeding management. In all five herds, apparent and reoccurring seasonal feeding and grazing management shortcomings were detected.
Recommendations
Further research would need to be carried out to establish financial consequences of poor fertility in organic systems with different milk pricing and cow values. Similarly, further research is needed to establish causes for high numbers of services per conception in these herds and to establish whether this phenomenon exists in other organically managed herds.
The LPEC generated indices could also be utilised to examine the potential impact of changes to systems before an intervention is implemented, by including costs of intervention and assumed values of production post-intervention. Sensitivity analyses may be conducted to identify the relative importance of individual production parameters to overall herd productivity.
Careful assessment of lactation characteristics in a herd is needed to predict the overall impact of extended calving intervals. It is likely that in most organic herds feeding management would need to be adjusted in order to produce lactations with low late lactation decline to avoid financial losses caused by longer calving intervals.
Scientific report (maximum 20 sides A4)
1 INTRODUCTIONAs a consequence of organic standards and principles, organic dairy producers are frequently faced with a different set of management considerations than those found in conventional dairy systems. The broad objective of this study was to examine in detail the production characteristics of 13 well-established organic dairy herds, and to relate these to the specific conditions that exist within organic dairy farming.
1. Longevity
Organic producers are encouraged to establish and maintain stable groups of breeding animals (UKROFS, 2000). Further to this point, an emphasis on “nurturing positive health and vitality, ensuring the proper control of disease and the encouragement of positive animal welfare” should manifest itself partly through lower culling levels, and hence a high proportion of older animals.
2. Breeding goals
The maintenance of a high health status should be one of the main aims of breeding in organic herds (CEC, 1999; UKROFS, 2000). Additionally, there is a requirement for organic producers to place emphasis on breeds that are well adapted to local conditions. It may be expected that animals selected for their genetic potential for high yield are not necessarily ideal animals for organic conditions, and that organic herds manifest a different selection of breeds and breeding animals from conventional farms.
3.Feeding
Standards require the provision of a minimum of 60% dry matter (DM) intake as forage throughout the lactation (CEC, 1999; UKROFS, 2000). Further to the previous point (breeding goals), this requirement may limit the potential of high genetic merit animals in organic systems. Such animals are selected for production under high feed input systems. Under organic management, feed restrictions may result in a failure to meet the nutritional requirements of these animals. This in turn may result in reduced animal welfare and reproductive efficiency. Limitations on the purchase of conventionally produced feed, plus the high reliance on home-grown forage and concentrates may also have a negative impact on reproductive efficiency, production and welfare (Padel, 2001).
4. Limitations on the use of veterinary products to manipulate fertility
Organic livestock standards set limits and constraints to the use of conventional veterinary medicinal products that are commonly used in the management of fertility in dairy herds e.g. hormonal preparations to induce oestrus or visible “heat”. Routine oestrus synchronisation is also prohibited. Due to the prolonged milk withdrawal periods for milk, the use of intra-vaginal hormone implants is also impracticable (Hayton and Hovi, 2001). These constraints on fertility management may lead to lower fertility performance in organic herds.
2 DATA COLLECTION AND ANALYSIS
Monthly milk records (National Milk Recording Plc., UK) for 13 organic herds for three years (January 1997- December1999) were collected and converted into a Microsoft Access™ database, using InterHerd™ (Agrisoft Plc., UK) herd management software. The data were sorted and analysed using the InterHerd™-herd management, Excel for Windows™ and Statistix for Windows™ software programmes.
Patterns of milk yield and quality and fertility performance were described by means of estimates of key parameters and descriptions of seasonal fluctuations in these parameters. Key influential variables, including herd, parity, season, year, genetic potential (sire PIN) and health status, were tested. Estimated parameters were used to examine the importance of two important indicators: lifetime yield/lactation length and economic efficiency. To assess the first, a spreadsheet model based on the Wood's lactation curve was developed. With regard to the latter, a model calculator (LPEC™, PAN Livestock Services, Plc., UK) was used. Since physical data on inputs were not available, the efficiency of herds is expressed in terms of output per unit of feed consumed. As feed inputs were not known, these were estimated from production parameters using standard nutrition requirement formulae.
Five herds were chosen for case studies, that examined the farm performance by using InterHerd™-generated data and by interviewing the producer retrospectively and asking him to comment on the data.
3 RESULTS AND DISCUSSION 3.1 General description of study herds
3.1.1 Herd size, duration of organic management and breed of cows
The herds were constituted largely (84% of all cows) of cows of the Holstein-Friesian breed (Table 1). Four of the eleven "black and white" herds were predominantly British Friesian. In the rest of these herds British Holstein-Friesians dominated. Approximately 1% of cows was classified as pure New Zealand Holsteins, but in some herds the proportion of crosses with NZ Holsteins was very high. The use of American, Canadian or Dutch Holsteins was negligible, and only present as a small proportion of two herds.
[image:5.595.25.460.291.546.2]Two of the herds were of the Ayrshire breed. These two herds constituted 14% of all animals. Both of these herds were well-established organic herds, and the choice of breed in these herds was coupled with “going organic”. Although only 1.5% of all cows was classified as a dual-purpose breed, most herds had a small proportion of these breeds (predominantly Muese-Rhine-Issel - MRI). Five of the herds had other dairy breeds crossed with Holstein-Friesian (0.5% of all cows).
Table 1 Herd size, duration of organic management at the beginning of survey and predominant breed of cattle in the survey herds.
Herd Herd size
(cows)
Years under organic management
Breed
1 130 1 Holstein-Friesian
2 70 10 Holstein-Friesian
3 70 5 British Friesian with many NZ
Friesians
4 120 7 British Friesian
5 315 1 Holstein-Friesian
6 110 2 Holstein-Friesian
7 150 2 Ayrshire
8 120 7 British Friesian
9 70 3 British Friesian with many NZ
Friesians
10 80 2 Holstein-Friesian
11 50 6 Mixed Holstein-Friesian with many
dual-purpose crosses
12 150 30 Holstein-Friesian
13 70 20 Ayrshire
3.1.2 Age structure
Although data to determine the precise ages of animals were not available, an indication of the age structure was achieved by examining the distribution of parities within each herd. The average parity across the herds ranged from 2.3 to 3.9 (Table 2), but the differences between herds were not statistically significant. The percentage of animals in different parities in the different herds is presented in Figure 1.
One of the herds with a low parity average (2.3 years) (herd 5, Table 2) was expanding rapidly during the observation period from 280 to 350 cows, introducing both bought-in and own heifers at a higher rate than would have normally been the case.
Table 2 Average parity numbers in survey herds.
Herd Average parity
1 2.9 2 2.9 3 3.4 4 3.1 5 2.3 6 2.3 7 2.8 8 3 9 3.2 10 3.3 11 3.9 12 3 13 3.4
Figure 1 Percentages of animals in different parities in the survey herds (the herd numbers do not refer to those used in Table 2, but indicate the parity in descending order).
3.2 Milk yield, composition and lactation characteristics 3.2.1 Yield and composition
The mean values for a series of parameters describing milk yield and quality for all herds are given in Table 4. These were estimated from a total of 5,409 lactations. Individual herd values are given in Table 5.
The differences in yield, fat content and SCC content of milk between the farms were not statistically significant due to great individual differences between lactations in each herd. The herd differences in lactation length, peak yield, persistency and protein levels were significant, suggesting a more uniform performance in these parameters within individual herds.
0% 10% 20% 30% 40% 50% 60% 70% 80% 90% 100%
1 2 3 4 5 6 7 8 9 10 11 12 13
Farms
P11
P10
P9
P8
P7
P6
P5
P4
P3
P2
Table 4 Average milk production and milk quality parameters estimated from thirteen organically managed dairy herds (1997-1999).
Mean SD Minimum Maximum
Lactation yield (kg) 5,874 548 5,127 7,031
305-day yield (kg) 5,565 515 4,737 6,660
Lactation length (days) 329 6 323 342
Fat (%) 4.1 0.3 3.8 4.7
Protein (%) 3.3 0.1 3.2 3.5
SCC ('000 cells/ml)* 172 31 113 215
Peak yield (kg) 26.0 2.6 21.2 30.3
Persistency** 0.76 0.03 0.72 0.82
*average of geometric means of lactation recordings
[image:7.595.24.446.328.571.2]**average daily yield of 305-day lactation divided by recorded peak yield
Table 5 Average milk production and milk quality parameters estimated for thirteen organically managed dairy herds (1997-1999). Her d Total lactation yield 305-da y yiel d Lac tation length (da y s ) Fat (% )
Protein (%) SCC ('000
cell s/ ml) Peak yi eld (kg/d a y ) Pers is tency
1 5840 5544 327 3.9 3.3 205 26.0 0.76
2 5606 5357 328 3.9 3.3 215 24.6 0.75
3 5127 4878 327 4.2 3.4 139 23.0 0.72
4 7031 6660 328 4.0 3.2 148 30.3 0.82
5 5635 5412 326 3.9 3.3 148 25.9 0.75
6 5789 5472 327 3.8 3.3 166 25.6 0.78
7* 5369 5132 325 4.0 3.4 203 23.0 0.80
8 6389 6050 326 4.0 3.2 113 28.4 0.79
9 5784 5573 323 4.7 3.4 204 26.4 0.79
10 6533 6102 333 4.0 3.2 153 27.9 0.77
11 6013 5736 323 4.1 3.5 181 29.1 0.72
12 6107 5691 337 4.5 3.3 169 27.2 0.74
13* 5141 4737 342 4.1 3.3 188 21.2 0.73
*Ayrshire herds
3.2.2 Seasonal pattern of milk production
Figure 2 Average daily milk yields by month and calving patterns for 13 organic herds 1997-1999.
3.2.3 Lactation curves
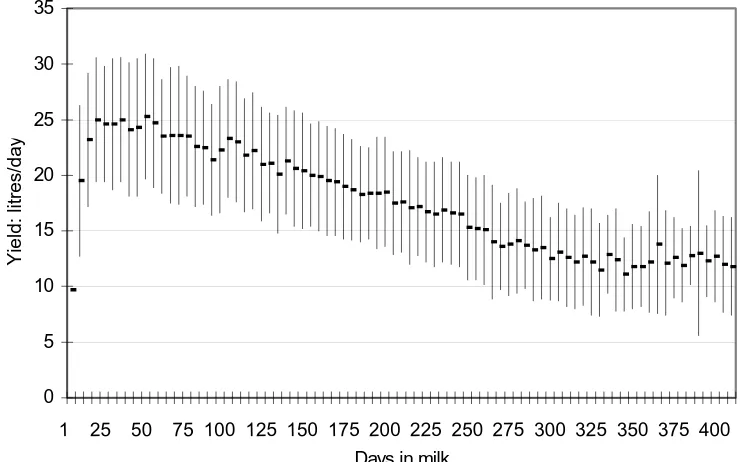
[image:8.595.54.424.527.758.2]A total of 33,932 milk recording measurements from the 4,029 lactations (1,779 cows, >5 recording per lactation) were plotted against stage of lactation to produce an average lactation curve for all herds (Figure 3). In Figure 4, the same lactation curve is broken down to typical lactation curves for first, second and third and above parity lactations.
Figure 3 A standard lactation curve for organic herds with mean recordings for every fifth day in milk with standard deviation shown as error bars.
0 5 10 15 20 25 30 35
1 25 50 75 100 125 150 175 200 225 250 275 300 325 350 375 400
Days in milk
Yield: litres/da
y
0 5 10 15 20 25 30 35 40
J F M A M J J A S O N D J F M A M J J A S O N D J F M A M J J A S O N D
1997 1998 1999
Milk yield:
'000 lit
res/
da
y
0 50 100 150 200 250
Number of
calvings/
m
ont
h
Figure 4 Lactation curves for three parity groups
A regression analysis was completed to test the hypothesis that the relationship between milk yield and stage of lactation was similar to that described in Wood’s lactation curve (Wood, 1969). The regression was completed using both actual and fat corrected yields. The regression parameters are described in Table 6.
Table 6 Regression parameters describing the relationship between daily fat-corrected milk yield and stage of lactation
Parameter estimate Standard error Predictor variables
Actual yield FCY Actual yield FCY Loge milk yield 3.26904 2.94595 0.01335 0.01026
Days in milk -0.00190 -0.00349 3.004E-05 2.307E-05
Loge Days in milk -0.01422 0.10245 0.00361 0.00277
R-value for regression with actual yield = 0.3382 R-value for regression with FCY = 0.6259
Seasonally adjusted lactation curves, based on the Wood's model were produced using the InterHerd programme for each case study herd to examine their usefulness as a management tool (see Chapter 4).
3.2.4 Lactation characteristics and parity
A total of 4,029 full lactation (>5 milk recordings per lactation) of 1,779 organic cows from the 13 herds were used to further study the lactation characteristics and parity.
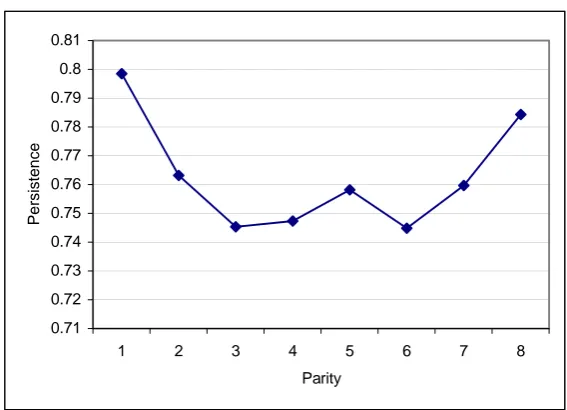
There was a significant difference (p<0.001) in total and 305-day lactations (Figure 5), peak yields and persistency of lactation between the parity groups. First parity lactations were shown to be more persistent than in other lactations (Figure 6), reflecting the low and late peak, usually achieved in first lactations (Keown et al., 1986). Lactation length did not differ significantly between first and second parity, but cows of third parity and above had significantly shorter lactations than first parity cows. There were no significant differences in the fat and protein content of the milk between the parity groups. Somatic cell counts increased significantly in each parity group from a mean somatic cell count of 88,000 cells/ml in first parity to 242,000 cells/ml in cows of parity 3 and greater (Figure 7).
0 5 10 15 20 25 30 35
5 30 55 80 105 130 155 180 205 230 255 280 305 330 355 380 Days in milk
Yield: litres/da
y
Figure 5 Relationship between lactation yield and parity
Figure 6 Relationship between persistency of lactation and parity.
4000 5000 6000 7000 8000
1 2 3 4 5 6 7 8
Parity
kg/l
actati
on
Total yield 305-day yield
0.71 0.72 0.73 0.74 0.75 0.76 0.77 0.78 0.79 0.8 0.81
1 2 3 4 5 6 7 8
Parity
[image:10.595.30.314.387.592.2]Figure 7 Relationship between somatic cell count and parity
3.2.5 Lactation characteristics and month of calving
Calving patterns
The seasonal patterns of calving in the survey herds were scattered. A combined calving pattern for all herds is presented in Figure 2 in 3.2.2, which shows a seasonal (autumn) calving pattern. The calving pattern of the individual case study herds is shown in Appendix I. Six of the 13 herds had an autumn to winter calving pattern (August-January). Two of the herds were spring calving (February-April). Only one of the herds was clearly summer calving, with 90% of all calvings concentrated in May, June, July and August. Two herds had two distinct calving periods, in the autumn and spring. Two herds had an all-year round calving pattern. None of the herds aimed at achieving a “tight” or block calving pattern.
Lactation characteristics
Month of calving was a significant factor influencing total and 305-day yield (p<0.05). The distribution of yields for different calving months is demonstrated in Figure 8. Highest mean yields (6,016 kg) were achieved from cows calving in December. The lowest mean yields were obtained from cows calving in June. This overall effect was similar in all three observation years. The fact that calving patterns varied widely in the survey herds, with some herds contributing very few cows to summer calving group, may have had an effect on this pattern and further studies on larger survey material would need to be carried out.
Month of calving had a less obvious effect on SCC. The highest mean SCCs were recorded in summer (June-July) or winter (November-December) calving cows. Fat and protein percentages in the milk of cows calving at different months did not differ.
Although the effect of month of calving on persistency of lactation was not statistically significant, there were marked seasonal differences in the persistency of lactations. The most persistent lactations were achieved by cows calving between September and December Cows calving between February and June exhibited the least persistent production. However, significantly shorter lactation lengths were also recorded for cows calving in September to December, giving rise to apparently improved persistency figures (Figure 9).
0 100 200 300 400 500 600
1 2 3 4 5 6 7 8
Parity
Figure 8 Total and 305-day yield by month of calving
Figure 9 Relationship between lactation persistency and length and month of calving
300 305 310 315 320 325 330 335 340 345 350
Jan Feb March April May June July Aug Sept Oct Nov Dec
0.64 0.66 0.68 0.7 0.72 0.74 0.76 0.78 0.8 0.82 0.84 laclen
persistency
Milk yield and breed
Lactation characteristics differed between breeds, with the Holstein-Friesian group having higher yields than the other breed groups (Table 7). Since the non-Holstein-Friesian animals were low in numbers and were concentrated mainly in two Ayrshire herds, meaningful analysis was limited. Parity was also an influential factor, in that the average parity of dual-purpose animals was 1.4 compared with approximately 3.0 in the other breed groups. Herd bias is also likely to have influenced the differences in SCC, which was significantly higher in the Ayrshire herds.
4800 5000 5200 5400 5600 5800 6000 6200 6400
Jan Feb Mar Apr May Jun Jul Aug Sep Oct Nov Dec
kg
[image:12.595.30.427.388.630.2]Table 7 Relationship between breed and production parameters
Breed
Holstein-Friesian
Ayrshire Dual-purpose
Other dairy
Number of lactations analysed 3,367 425 60 14
Total lactation yield (kg) 6,227 5,396 4,532 4,168
305-day yield (kg) 5,924 5,152 4,388 4,053
Fat (%) 4.0 4.0 4.2 4.0
Protein (%) 3.3 3.4 3.5 3.5
Persistency 0.7662 0.7977 0.7932 0.7836
Peak recorded yield (kg) 30.0 23.1 19.4 18.6
Lactation length (days) 331 331 318 323
Somatic cell count ('000 cells/ml) 165 207 88 200
Milk yield and genetic merit (£PIN)
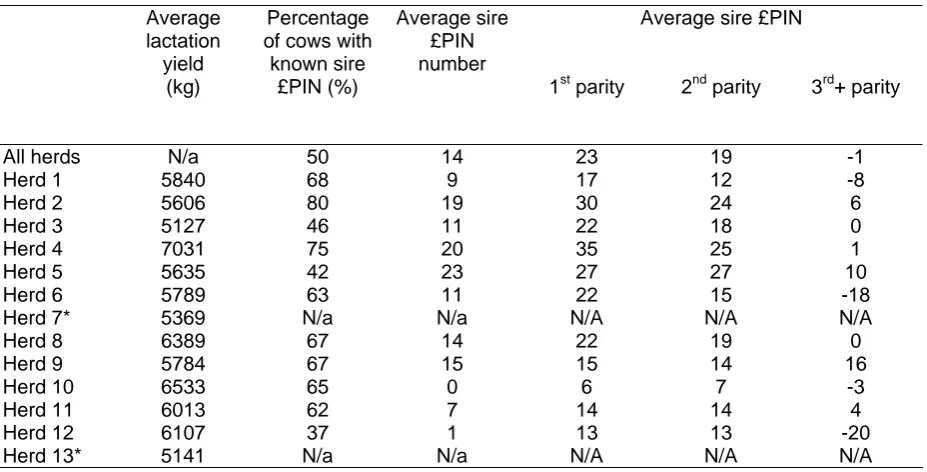
[image:13.595.27.491.429.665.2]A total of 2,080 lactations from cows with known sire PIN were analysed. Overall, sire £PIN numbers were available for 60% of herds. Although this percentage varied between herds, this should not be used as an indicator of the genetic potential of individual herds. The extent of these data is limited by the availability of information on sire £PIN. The data representing average £PIN for different parity groups (Table 8) demonstrate a gradual improvement across parities, with younger cows having a higher number. A regression analysis showed a positive relationship between total yield and sire £PIN for animals in their first lactation (p<0.001), and in their second lactation (p<0.05). For other, older cows this relationship did not exist (p=0.413).
Table 8 Yield, availability of £PIN data and average £PIN values in 13 herds by parity.
Average sire £PIN Average
lactation yield
(kg)
Percentage of cows with known sire
£PIN (%)
Average sire £PIN number
1st parity 2nd parity 3rd+ parity
All herds N/a 50 14 23 19 -1
Herd 1 5840 68 9 17 12 -8
Herd 2 5606 80 19 30 24 6
Herd 3 5127 46 11 22 18 0
Herd 4 7031 75 20 35 25 1
Herd 5 5635 42 23 27 27 10
Herd 6 5789 63 11 22 15 -18
Herd 7* 5369 N/a N/a N/A N/A N/A
Herd 8 6389 67 14 22 19 0
Herd 9 5784 67 15 15 14 16
Herd 10 6533 65 0 6 7 -3
Herd 11 6013 62 7 14 14 4
Herd 12 6107 37 1 13 13 -20
Herd 13* 5141 N/a N/a N/A N/A N/A
*These are Ayrshire herds
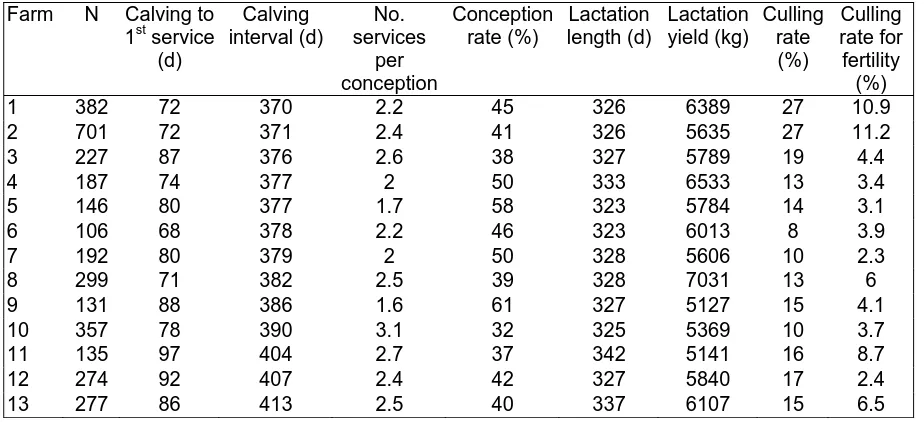
3.4 Herd Fertility
Estimates of herd fertility performance
Table 9 Average herd fertility parameters for 13 organic herds.
Farm N Calving to 1st service
(d)
Calving interval (d)
No. services
per conception
Conception rate (%)
Lactation length (d)
Lactation yield (kg)
Culling rate (%)
Culling rate for fertility
(%)
1 382 72 370 2.2 45 326 6389 27 10.9
2 701 72 371 2.4 41 326 5635 27 11.2
3 227 87 376 2.6 38 327 5789 19 4.4
4 187 74 377 2 50 333 6533 13 3.4
5 146 80 377 1.7 58 323 5784 14 3.1
6 106 68 378 2.2 46 323 6013 8 3.9
7 192 80 379 2 50 328 5606 10 2.3
8 299 71 382 2.5 39 328 7031 13 6
9 131 88 386 1.6 61 327 5127 15 4.1
10 357 78 390 3.1 32 325 5369 10 3.7
11 135 97 404 2.7 37 342 5141 16 8.7
12 274 92 407 2.4 42 327 5840 17 2.4
13 277 86 413 2.5 40 337 6107 15 6.5
Overall fertility parameters for selected lactations
Out of a total 3,414 recorded calvings, 2,238 (68%) were followed by a subsequent calving of that animal within 550 days and contained a full service history. These breeding periods, identified as completed parities, were analysed separately. The mean calving interval (CI) for these breeding periods was 382 days (s.d. 48 days, range 283-550). The mean calving to first service (C1stS) and calving to conception intervals (CaCo) were 77 days (s.d. 31, range 20-265) and 101 days (s.d. 49, range 24-459), respectively. The mean number of services per conception (S/C) was 1.6 (s.d. 1.0, range 1-16).
Yield and fertility
[image:14.595.25.487.130.341.2]Whilst the mean values of fertility parameters tended to increase as yields increased, there were no statistically significant differences between four yield groups, when the breeding periods were divided into four yield groups by yield quartiles (Table 10).
Table 10 Mean fertility parameters in four yield groups (G) based on yield quartiles with average 305-day yields (Y) for 2,238 completed parities in 13 organic herds in 1997-1998. CaCo = Calving to conception interval (days).
N C1stS CaCo CI S/C
G1 (Y= 4,470 kg) 663 77 104 386 1.6
G2 (Y = 5,594 kg) 655 80 108 389 1.6
G3 (Y = 6,552 kg) 597 81 113 394 1.7
G4 (Y = 7,766 kg) 323 77 113 394 1.7
Parity and fertility
The mean values of fertility parameters in the second parity and in parities three and above were lower than in first parity, but these differences were not statistically significant (Table 11).
Month of calving and fertility
There were no statistically significant differences in the fertility parameters for the 2,238 breeding periods by month of calving. There was, however, a tendency for the autumn-winter calving groups to have shorter calving intervals and shorter calving to 1st service and calving to conception intervals, whilst the number of services per conception tended to fall during the summer months.
Table 11 Mean fertility parameters in three parity groups in 2,238 completed parities in 13 organic herds in 1997-1999.
N C1stS CaCo CI S/C
Parity 1 648 81 112 393 1.7
Parity 2 522 76 106 388 1.7
Parity 3+ 1,068 77 104 386 1.6
3.5 Modelling organic milk production
Herd productivity model
Herd productivity indices were generated from the Livestock Production Efficiency Calculator (LPEC) herd model (PANLivestock Ltd., 1992). The estimates of key production parameters for each herd were applied to the model to give an estimate of herd productivity expressed in terms of the value of output (£) per unit of feed intake. Those production data required which were not available from the herd records were taken from Lampkin and Measures (2001) and applied as a standard across all herds. LPEC-generated productivity indices are a measure of feed conversion efficiency at the herd level. The advantage of using this approach in the estimation of productivity is that it takes full account of the entire feed input to the system, including forage. It is thus particularly relevant to organic herds, given the emphasis on production from forage. The LPEC approach is also comprehensive, in that it takes account of all determinants of productivity and their interactions.
[image:15.595.28.447.143.191.2]The estimates of productivity for each of the herds is shown in Table 13 The feed input is expressed in terms of a carrying capacity unit (CCU), which is defined as the feed supply providing 100MJ of metabolisable energy (ME) per day throughout the year. Table 13 also expresses productivity in terms of output per cow. This is calculated from an estimate of the number of CCUs per livestock category. For example, if a breeding female is equivalent to 1.7 CCUs, she has been estimated as consuming, on average across one year, the equivalent of 170MJ ME/day.
Table 13 Productivity estimates for organic herds
Herd Lactation yield (kg)
Annual calving rate %
Annual Culling rate (kg)
Herd Productivity
index (£/CCU/year)
Output per cow (£/year)
1 6533 97 14 1127 1818
2 5784 106 14 1099 1773
3 7031 84 15 1089 1675
4 6013 96 7 1079 1635
5 6389 100 29 1076 1793
6 6107 94 16 1054 1647
7 5635 108 29 1049 1720
8 5127 107 13 1036 1570
9 5840 95 18 1032 1588
10 5606 95 13 1012 1510
11 5789 80 22 933 1261 12 5141 84 13 921 1212 13 5369 79 13 898 1166
[image:15.595.51.448.438.655.2]Figure 10 Productivity and yield in 13 organic herds
An unweighted least squares regression analysis of the production index against yield and calving rate showed that the production index was closely and independently associated with yield (R squared = 0.43) and calving rate (R squared = 0.43). Culling was not independently associated with the production index (R squared = 0.08) but once calving rate and lactation yield are taken into account, culling rate also becomes a significant factor. The three together explain even more of the variation in production index (R squared = 0.99).
Since details of purchased inputs were not available, the productivity indices are expressed in terms of the value of output per unit of feed intake. The next logical step in this analysis would be to gain data on purchased feeds, so that the productivity index can be expressed in terms of a gross margin per unit of forage input. This would allow the full importance of forage to organic dairy systems to be expressed, and would also allow productivity to be evaluated in terms economic margin per unit of input produced on-farm. Given that in most dairy systems much of on-farm forage production is in the form of grazed material, which cannot be easily measured or valued, this approach allows a more comprehensive evaluation of the productivity of grazing ruminants.
The LPEC generated indices could also be utilised to examine the potential impact of changes to systems before an intervention is implemented, by including costs of intervention and assumed values of production post-intervention. For example, disease control measures may be evaluated by including the cost of control and the likely impact on various production parameters. Sensitivity analyses may be conducted to identify the relative importance of individual production parameters to overall herd productivity.
3.6 Lifetime production model
A spreadsheet model was constructed to calculate the lifetime production of a cow, from first calving to culling at the end of a given lactation. The model uses Wood’s equation to calculate daily milk yields, which are summed to give lifetime yield. The model can calculate different lifetime yields, and average annual production, given different parameters for calving interval and length of lactation. The Wood’s curve parameters, calculated by regression, and calving interval parameters for each herd are presented in Table 14.
It is interesting to note that there are two basic types of Wood’s curve represented among the 13 farms. Those with a positive value for the ‘b’ parameter have a convex curve with a distinct peak some weeks after calving. Those with a negative value for the ‘b’ parameter have a concave curve, which declines from the day of calving, with no distinct peak.
One hypothesis that was explored using the model is that organic herds tend to have flatter, more persistent, lactations. This in turn is taken to imply that longer calving intervals, with extended lactations, will not result in the same negative economic effects in organic herds as in conventional herds, where yield declines rapidly in late lactation. Using the
Productivity estimates for organic dairy herds
800 900 1000 1100 1200
1 2 3 4 5 6 7 8 9 10 11 12 13
interval increased. The loss in average annual production for each week added to the calving interval was calculated and is presented in Table 15. The value of the loss is also presented, based on a value of £0.295 per kg of milk.
As extending calving interval, and therefore lactation length, extends the overall productive life of the cow, savings can be foreseen in replacement costs. An extension of one week to each lactation over three lactations extends the life of a cow by 3 weeks. This would have the effect of reducing the annual replacement rate slightly. The spreadsheet included a calculation of this effect, giving the result that for each extra week added to calving interval (between 53 and 68 weeks) annual replacement costs were reduced by £1.53, based on a calving-down heifer cost of £750 ( Lampkin and Measures, 2001) and a cull cow value of £450. The net effect of extending calving intervals could then be calculated. Table 15 shows the results with herds in ascending order of this net loss.
Table 15 also shows some characteristics of the 1st, 2nd and 3rd lactations represented by the Wood’s equation: 305 day yield (kg), persistency (calculated as average daily yield over 305 days divided by peak yield) and the average rate of decline in yield between 205 and 305 days (kg per day).
The net loss per extra week calving interval ranged from £3.89 to £10.96. Persistency, as calculated here, does not appear to be a good indicator of the extent to which herds will suffer from extended calving intervals. A better indicator is the rate of decline of yield in late lactation. Those less affected by extension to the calving interval have decline rates of 0.01 to 0.03 kg per day between 205 and 305 days, whereas those more affected have decline rates of 0.04 to 0.05 kg per day over the same period.
It is noticeable that the herds with lower late lactation decline rates are also those with a negative Wood’s ‘b’ parameter, i.e. those with a concave curve, which declines from the day of calving, with no distinct peak. It could be argued, therefore, that this shape of curve is desirable because it allows more flexibility in fertility management. However, it should be noted that these types of lactation tend also to give the lower 305-day yields.
As low late lactation decline rate tends to reduce the negative economic effect of longer calving interval, the spreadsheet was used to discover the decline rate which must be achieved to produce a zero net effect of calving interval on annual output, by allowing the spreadsheet to ‘goal seek’ by adjusting the Wood’s ‘c’ parameter, which controls lactation decline. This was done for two herds; using data from a herd with negative and positive Wood’s ‘b’ parameter. In both cases, decline rates of between 0.010 kg per day and 0.017 kg per day were found to negate the net effect of extended calving interval on annual output.
Table 14 Wood's lactation curve parameters for 1st, 2nd and 3rd parity lactations for 13 organic herds.
Parity 1 Parity 2 Parity 3+
Herd CI Av.
parity a b c a b c a b c
1 58 3 22.4 -0.0262 -0.0013 30.3 -0.0262 -0.00213 28.9 -0.0262 -0.00181
2 54 3 12.3 0.14249 -0.0029 15.3 0.14249 -0.0039 17.0 0.14249 -0.00405
3 55 3 17.1 -0.0089 -0.0016 18.8 -0.0089 -0.00202 26.6 -0.0089 -0.00257
4 55 3 23.4 0.01472 -0.0012 29.1 0.01472 -0.00194 30.5 0.01472 -0.00199
5 53 2 13.0 0.14973 -0.0031 15.7 0.14973 -0.00411 17.7 0.14973 -0.00497
6 54 2 23.6 -0.0535 -0.0004 27.7 -0.0535 -0.00068 35.7 -0.0535 -0.00223
7 56 3 15.8 0.0553 -0.0019 19.2 0.0553 -0.00257 21.9 0.0553 -0.0033
8 53 3 21.2 -0.1352 -0.0009 24.8 -0.1352 -0.0015 29.5 -0.1352 -0.002
9 54 3 13.4 0.15515 -0.0034 16.8 0.15515 -0.00436 17.9 0.15515 -0.00429
10 54 3 19.6 0.03981 -0.0016 24.1 0.03981 -0.0025 25.9 0.03981 -0.00269
11 54 4 17.8 0.04005 -0.002 25.0 0.04005 -0.0031 28.8 0.04005 -0.00351
12 59 3 19.1 0.03747 -0.0018 24.6 0.03747 -0.00253 25.8 0.03747 -0.0033
13 58 3 15.9 -0.0076 -0.0013 21.8 -0.0076 -0.00254 24.3 -0.0076 -0.00267
Table 15 Lifetime yield model: Effect of prolonged lactation and calving interval on lifetime yield
Herd Lactation curve type (‘b’ paramete
r positive or
ne
g
ative
)
305 day yield; parit
y
1
(k
g)
305 day yield; parity 2 (kg) 305 day yield; parity 3 (kg) Average 305 day
yield (over 3
parities) (kg) per
sistency
parity 1 per
sistency
parity 2 per
sistency
parity 3 Yield decline (par 1) bet
ween
205 to 305 d
a
ys (kg per day)
Yield decline (par 2) bet
ween
205 to 305 d
a
ys (kg per day)
Yield decline (par 3) bet
ween
205 to 305 d
a
ys (kg per day)
Loss in ave. annual yield per week added to
C
I between 5
3
to 68 weeks (kg) Value of lost yield @ 29.5p pe
r kg
Net loss per wee
k
added to CI
after subtraction
of saving on
replacement
6 neg 5,275 5,946 6,192 5,805 73% 70% 57% -0.01 -0.02 -0.04 18.4 £5.42 £3.89
8 neg 3,038 3,282 3,661 3,327 47% 43% 41% -0.01 -0.02 -0.02 18.4 £5.43 £3.90
3 neg 3,958 4,106 5,395 4,486 76% 72% 67% -0.02 -0.02 -0.03 23.7 £6.98 £5.45
13 neg 3,863 4,465 4,892 4,407 80% 67% 66% -0.01 -0.03 -0.03 24.1 £7.12 £5.59
1 neg 4,994 6,026 6,002 5,674 73% 65% 68% -0.02 -0.03 -0.03 26.4 £7.80 £6.27
4 pos 6,396 7,161 7,453 7,003 88% 79% 79% -0.02 -0.04 -0.04 27.5 £8.12 £6.59
7 pos 4,716 5,218 5,394 5,109 86% 79% 73% -0.02 -0.03 -0.04 28.6 £8.43 £6.90
10 pos 5,683 6,159 6,450 6,097 87% 78% 76% -0.02 -0.04 -0.04 30.6 £9.01 £7.48
12 pos 5,324 6,194 5,861 5,793 85% 77% 71% -0.02 -0.04 -0.04 33.0 £9.72 £8.19
2 pos 4,776 5,176 5,637 5,196 84% 77% 75% -0.03 -0.04 -0.05 35.6 £10.49 £8.96
11 pos 4,881 5,900 6,441 5,741 83% 73% 69% -0.02 -0.04 -0.05 37.4 £11.03 £9.50
5 pos 5,076 5,338 5,380 5,264 83% 76% 70% -0.03 -0.04 -0.05 39.8 £11.74 £10.21
[image:18.595.27.482.323.698.2]4 Case studies
To test the usefulness of the herd management data analysis in terms of problem solving and decision support, five farms were used as case studies and some additional data on feeding and fertility management were collected. A case study is presented here as an example of the approach.
Case study example
Herd size: The herd averages between 120 and 130 Friesian/Holstein cows. Average yield (305 day): 1997 - 5,826 litres/cow
1998 - 5,869 litres/cow Best production month: January.
Worst production month: August.
Turnout date: By day
By night
Housing date: By night By day
Milk production
The herd has two calving periods: one in March-May, and another in August-October (Figure 10). The shape of the lactation curves by month of calving is variable (Figure 11). The curves for the animals calving in the winter between the beginning of October and the end of March are relatively flat.
Nutrition
In the winter/spring of 1996/7, the milking cows were fed mainly Lucerne silage (22.5 kg) with some grass/clover silage (7.5-kg) and a little straw (0.5kg). This was supplemented with 9 kg of concentrates comprising 21% rolled triticale, 21% linseed, 265 wheatfeed, 26% maize gluten and 6% molasses. Maize gluten was fed through the parlour at 0.4 kg/litre for all litres over 25. Calculations using standard analyses for both Lucerne and grass/clover silage indicated that there may have been a considerable excess of protein in the ration. It also suggested that either the concentrates were being fed at the expense of the forage or that the forages were not palatable resulting in a low intake. During the summer the cows were expected to achieve 25 litres from grass. In the 1997/8 winter, the main forage was grass/clover silage, which was supplemented with triticale, wheat distillers and a little molasses. Calculations based around a typical grass/clover silage analysis indicated that the cows were likely to be short of both energy and protein. Later in the winter, some full fat Soya was introduced into the ration with apparently beneficial effects. In winter 1998/9, the forage was grass/clover silage supplemented with a mix of equal parts of wheat and vetch seeds with some full fat Soya. An 18% protein cake was fed through the parlour to all cows giving over 300 litres. While this ration appeared to be adequate in protein it was likely to provide less energy than required.
Fertility
1997 Conception rate: 18-80% Overall 48%
Serves per conception: 1.2-4.3 Overall 2.1 Calving interval 331-569 days Overall 415
1998 Conception rate: 13-100% Overall 38%
Serves per conception: 1.0-8.0 Overall 2.6 Calving interval 342-465 days Overall 398 days
Conclusions on the herd performance
• Concentrate use was low and likely to lead to energy deficient rations.
• Production from forage is modest and varies over the three years of the study between 3,000 and 3,800 litres.
• There is a greater than expected drop in production from May to June of each year, suggesting that animals may be short of grazing, coincident with silage making. It is likely that too large an area is cut or the re-growth is slower than expected.
• Production during the summer drops more than expected in all three years between July and August and again between October and November in 1997 and 1999.
• While milk production is monitored there appears to be no attempt to compensate for the changes in the nutritional value and/or availability of grazed grass.
• Fertility is generally poor, particularly in 1998: it is likely that the main reason for poor fertility is the apparent underfeeding of the spring calving proportion of the herd.
0
5
10
15
20
25
30
35
40
Jan Feb Mar Apr May Jun Jul Aug Sep Oct Nov Dec
N
o
. of calvings
Figures 11
Aggregate lactation curves by month of calving for 1997-1999 (each curve broken down
to 1
st, 2
ndand 3
rd+ parity cows).
30 January-calving cows
29 February-calving cows
35 March-calving cows
67 April-calving cows
22 July-calving cows
43 August-calving cows
43 September-calving cows
30 October-calving cows
5 Conclusions and recommendations
Milk yield and lactation characteristics
The 13 established, organic herds were characterised with relatively low yields, but herd variation was great: from a total lactation yield of 5,100 kg to 7,000 kg.
Milk fat and protein content, lactation length and individual cow SCC means were similar to those reported in conventional, milk recorded herds.
Whilst calving patterns were spread and varied greatly between herds, the overall production of organic milk by the 13 herds had a seasonal variation attributable to the fact that majority of calvings across the herds occurred in August-October.
Lactation yields increased up to the third lactation, whereas persistency of lactations decreased up to the third lactation. This pattern followed similar patterns reported in conventionally managed herds.
Similarly, somatic cell counts increased with parity, mimicking similar phenomenon reported in conventionally managed dairy cows.
Length of lactation and lactation persistency were associated with month of calving, with autumn calving cows tending to have shorter lactations with better persistency. This phenomenon was, however, confounded with parity.
Wood's lactation curve model, used to describe lactation shape based on days in milk, was a suitable model for lactations of organically managed cows. The fit of the model was improved by using fat corrected milk yields (R squared = 0.34 for actual yields; R squared = 0.63 for fat corrected yields); i.e. herd management software using Wood's curve to predict milk yields is suitable for organic systems.
It was notable, however, that there were two basic types of Wood’s curve represented among the 13 farms. Those with a positive value for the ‘b’ parameter have a convex curve with a distinct peak some weeks after calving. Those with a negative value for the ‘b’ parameter have a concave curve, which declines from the day of calving, with no distinct peak. The herds with concave curve also tended to have lower decline in milk yield in late lactation and lower overall lactation yield.
Eleven out of the 13 herds were primarily Holstein-Friesian herds. The remaining two herds were Ayrshire herds with very different input and management practices. This prevented any meaningful analysis of breed effect on yield and milk composition.
There was also a limited amount of data on genetic merit of the cows. Using sire £PIN as an indicator of genetic merit (available for black and white herds only and for approximately 60% of the cows), initial analysis suggests that £PIN values increased with decreasing parity and that there was very little correlation with yield and £PIN in lactations above the second parity.
In conclusion, it is suggested that lactation data from organic herds can be analysed using the same methodologies that are applied to data from conventionally managed herds and that lactation characteristics do not differ markedly between these groups, apart from the occurrence of "concave" lactation curves in some organic herds.
Fertility
Mean calving to 1st service intervals and calving intervals remained relatively low in all but two herds, compared to figures reported from conventional, recorded dairy herds nationally.
The number of services per conception was somewhat higher than that reported in conventional herds. Subsequently, the overall conception rates remained low in the organic herds, suggesting that relaxed calving patterns encourage repeated services. Reksen et al. (1999) report shorter calving intervals and lower numbers of services per conception in Norwegian organic herds than in the current study, but in a survey that studied organic farms with markedly smaller herd sizes.
Further analysis would be needed to establish the financial impact of poor conception rates in organic herds with relatively short calving intervals and low culling rates for fertility and to examine the causes for high number of services per conception in some herds. Data from conventional herds suggests that number of services per conception is not a significant financial loss when compared with the losses caused by prolonged calving intervals and culling for fertility (Esslemont and Peeler, 1993).
Whilst there was a detectable trend for poorer performance in fertility amongst the organic cows as milk yields increased the differences were not significant. It is likely that the milk yields in the survey herds are not high enough to cause primary drop in fertility.
It is concluded that fertility performance in terms of culling for fertility and mean calving intervals were better in the organic survey herds when compared with existing data from conventionally managed UK dairy herds. Good fertility performance even in the highest yielding organically managed cows suggests that early lactation energy deficit may not be a major problem in these herds.
It is also suggested that financial impact of high number of services per conception, as observed in majority of the survey herds, may be insignificant as the main losses caused by poor fertility are attributable to culling and prolonged calving intervals.
Herd models
Herd productivity indices were generated, using an existing model based on a measure of feed conversion efficiency at the herd level. The advantage of using this approach in the estimation of productivity is that it takes full account of the entire feed input to the system, including forage. It is thus particularly relevant to organic herds, given the emphasis on production from forage.
The production index was closely and independently associated with yield and calving rate. Culling was not
independently associated with the production index but once calving rate and lactation yield are taken into account, culling rate also becomes a significant factor.
A spreadsheet model of the lifetime production of a cow, from first calving to culling at the end of a given lactation was useful in calculating the effect of different calving interval and length of lactation on lifetime yield.
The net loss per extra week calving interval ranged from £3.89 to £10.96. Persistency, as calculated here, does not appear to be a good indicator of the extent to which herds will suffer from extended calving intervals. A better indicator is the rate of decline of yield in late lactation.
The spreadsheet model was used to discover the decline rate, which must be achieved to produce a zero net effect of calving interval on annual output. Decline rates of between 0.010 kg per day and 0.017 kg per day were found to negate the net effect of extended calving interval on annual output.
The results suggested that, although extending the lactation tends to have a negative economic effect, there is a threshold for late lactation decline, below which this effect is nullified. However, none of the 13 organic herds studied produced lactations, which met this threshold.
Case studies
Case studies demonstrated the usefulness of recorded data analysis, using herd management software and observation of seasonally adjusted lactation curves to examine feeding management. In all five herds, apparent and reoccurring seasonal feeding and grazing management shortcomings were detected.
Recommendations
Further research would need to be carried out to establish financial consequences of poor fertility in organic systems with different milk pricing and cow values. Similarly, further research is needed to establish causes for high numbers of services per conception in these herds and to establish whether this phenomenon exists in other organically managed herds.
The herd productivity calculator model (LPEC) showed to be a good and robust measure of productivity. Next logical step in this analysis would be to gain data on purchased feeds, so that the productivity index can be expressed in terms of a gross margin per unit of forage input. This would allow the full importance of forage to organic dairy systems to be expressed, and would also allow productivity to be evaluated in terms economic margin per unit of input produced on-farm. Given that in most dairy systems much of on-farm forage production is in the form of grazed material, which cannot be easily measured or valued, this approach allows a more comprehensive evaluation of the productivity of grazing ruminants.
The LPEC generated indices could also be utilised to examine the potential impact of changes to systems before an intervention is implemented, by including costs of intervention and assumed values of production post-intervention. Sensitivity analyses may be conducted to identify the relative importance of individual production parameters to overall herd productivity.
Careful assessment of lactation characteristics in a herd is needed to predict the overall impact of extended calving intervals. It is likely that in most organic herds feeding management would need to be adjusted in order to produce lactations with low late lactation decline to avoid financial losses caused by longer calving intervals.