Dissertation submitted to
THE TAMILNADU Dr. M.G.R. MEDICAL UNIVERSITY
In partial fulfillment for the degree of
MASTER OF DENTAL SURGERY
BRANCH V
1. INTRODUCTION 1
2. REVIEW OF LITERATURE 5
3. MATERIALS AND METHODS 26
4. RESULTS 30
5. DISCUSSION 34
6. SUMMARY & CONCLUSION 51
7. BIBLIOGRAPHY 53
-To evaluate the cortical bone thickness in the infra-zygomatic region for ideal placement of temporary anchorage devices (TADs), by bone mapping using cone beam computed tomography (CBCT).
Materials and Methods:
CBCT images of forty subjects were randomly selected for this in-vitro study from the database available in our department. None of the subjects had noticeable periodontal disease or ectopically erupted teeth. All the reconstructed images were aligned in axial, sagittal and coronal planes.
heights are highly statistically significant (p =0.01). The cortical bone thickness gradually increased from mesial of maxillary first molar (6M) towards the interdental region between the maxillary first and second molar (6-7 ID). This gradually decreased from middle of second molar (7 Middle) towards the distal of second molar (7D).
The cortical bone thickness tended to get thicker from cementoenamel junction towards the maxillary sinus floor along the heights of 8mm, 10mm & 12mm and started to decrease towards 14mm.
Conclusion:
Based on the outcome of this study, it is reasonable to conclude that the infrazygomatic region is an optimal extra- alveolar site for placement of Temporary Anchorage Devices (TADs). The ideal site for insertion of TADs are, the interdental region between the maxillary first and second molars (6-7ID) & the middle of maxillary first molar (6 Middle ) region at the heights of 10mm and 12 mm. This benefits us in achieving good primary stability. It is better to avoid placing TADs distal to maxillary second molar region as the cortical bone in that region is thinner comparatively.
INTRODUCTION
Anchorage has been defined as the source of resistance to the forces generated in reaction to the active components of an appliance. In simple words, it means resistance to displacement. Every orthodontic appliance consists of two elements: An active (tooth movement) and resistance element (anchorage) that makes tooth movement possible16.
Conventional anchorage methods like headgear, elastics, adjacent teeth and etc generally rely on patient compliance and the result is unwanted reciprocal tooth movements. Anchorage loss may jeopardize a successful result because of inappropriate movement of the anchor teeth which results in insufficient space remaining to achieve the intended tooth movements. In an effort to overcome some of these problems, skeletal anchorage system has been increasingly incorporated into orthodontic treatment for over 25 years16.
Cope 14 defined a TAD as : ‘A temporary anchorage device is a device that is temporarily fixed to bone for the purpose of enhancing orthodontic anchorage either by supporting the teeth of the reactive unit or by obviating the need for the reactive unit altogether, and which is subsequently removed after use’.
Creekmore and Eklund 16reported on the use of a surgical vitallium screw, later Kanomi 33described the use of mini-screw implants for intrusion of mandibular anterior and buccal teeth.
Temporary anchorage devices (TAD) include miniplates, miniscrews, microscrews, microimplants .The advantages miniscrews include smaller size, greater number of implant sites, simpler surgical placement without any full flap retraction, immediate loading without any need for laboratory work, easier removal after treatment and lower cost30.
TADs, when placed in the inter-radicular area pose a risk of injuring the root while inserting a miniscrew in the dento-alveolar area. It can also impede tooth movement, when the moved tooth approximates miniscrew. Therefore
the best way to prevent root injury is to place TADs in the extra-alveolar site.
Extra-alveolar sites suggested for TADs include incisive fossa, canine
fossa, infrazygomatic crest, premaxillary region, midpalatal region, symphysis,
anterior external oblique ridge and retromolar area .These are strongly
recommended when considering the risks of encountering tooth roots80.
In addition, TADs in these areas can provide easier and wider
applications in tooth movement47, such as posterior segment intrusion, anterior
teeth retraction, uprighting impacted second molar and distalisation of
maxillary and mandibular molar70.
Infra-zygomatic crest has been an obvious choice for miniscrew insertion because of the thickness of the cortical plate and its distance from the dental arch. However, Baungaertel and Hans2, stated that great individual variations exist in the thickness of the infrazygomatic crest, which is probably due to differing root lengths, maxillary sinus pneumatization, buccolingual inclination of the maxillary first molar, and the height of the alveolar processes among the individuals studied, all of which are determinants to the available bone depth for miniscrew placement.
placing mini-screws at this site for orthodontic purposes, it is important to understand the anatomical variations present in this area.
In recent years, CBCT has become a main tool for oral and maxillofacial diagnostic imaging because of its low radiation exposure, short scanning time, and high definition28
. Also it is extremely important to conduct studies that assess bone thickness in the infrazygomatic crest for placement of TADs, providing safer surgical procedures and minimizing possible failures. An understanding of the cortical bone thickness in the maxilla and mandible not only has descriptive benefits, but clinical implications as well.
Aim of the Study
:REVIEW OF LITERATURE
Cone beam computed Tomography Temporary Anchorage Devices
Cortical bone thickness in the infrazygomatic region
Scarfe et al. 200668, reviewed Cone-beam computed tomography
(CBCT) systems designed for imaging hard tissues of the maxillofacial region
and stated that it is capable of providing sub-millimetre resolution in images of
high diagnostic quality, with short scanning times (10-70 seconds) and
radiation dosages reportedly up to 15 times lower than those of conventional
CT scans, which increased the availability of this technology provided the
clinician with an imaging modality capable of providing a 3-dimensional
representation of the maxillofacial skeleton with minimal distortion.
Maria et al. 200845, compared the radiation doses for conventional
panoramic and cephalometric imaging with the doses for 2 different CBCT
units and a multi-slice CT unit in orthodontic practice and stated that the
effective dose was lower for panoramic and lateral cephalometric device (10.4
_Sv), and highest for multi-slice CT (429.7 _Sv).
Therefore from the dose to the patient point of view, the routine use of CBCT
is not recommended in orthodontic procedures, because conventional images
deliver lower doses to patients. However, when 3D imaging is required in
De Vos W et al. 200918, reviewed the benefits of Cone beam
Computed Tomography systems over medical CT for orthodontic treatment
and planning, which included a lower radiation dose to the patient, shorter
acquisition times for the resolution desired in orthodontics, and significantly
lower cost than medical CT. The limitations associated with CBCT scanners
are increased scatter radiation, limited dynamic range of X-ray area detectors,
and beam hardening artifacts.
Ribeiro et al, 201063 analyzed the rapid maxillary expansion using
CBCT and reported that the lateral repositioning of the maxilla and increased
basal bone can be accurately observed which confirms the marked
morphological changes that occur in the upper arch and nasomaxillary
structure.
They concluded that CBCT is a ground-breaking diagnostic method in
dentistry as it provides high dimensional accuracy of the facial structures and a
reliable method for quantifying the behaviour of the maxillary halves, dental
tipping, bone formation at the suture in the three planes of space, as well as
alveolar bone resorption and other consequences of palatal expansion.
Timock A M et al. 201173,investigated the accuracy and reliability of
buccal alveolar bone height and thickness measurements derived from CBCT
measurements of buccal bone height and buccal bone thickness were small
(0.30 and 0.13 mm, respectively) which was statistically insignificant .The
95% limits of agreement in the submillimeter range were observed for both
buccal bone height and buccal bone thickness (between _0.77 and 0.81 mm,
and between _0.32 and 0.38 mm, respectively).
They concluded that under simulated clinical settings, CBCT imaging
can provide accurate and reliable representations of buccal alveolar bone
dimensions.
Mah et al, 201144, CBCT allows for visualization within the alveolar
bone volume for sclerotic phenomenon that produce local intra-alveolar bone
densities which vary in size from a diameter of 2 to 3 mm to 1 to 2 cm. A very
high proportion of the lesions, between 88% and 100%, are found in the
mandible. Within the mandible, most of the lesions are noted in the premolar
and molar region. An orthodontist may use this valuable information to
preclude certain types of biomechanics, such as torqueing or protraction or
retraction of teeth through the affected area.
For placement of TADs, CBCT allows for visualization of the
interproximal root space, palatal cortical bone thickness, sinus morphology,
and other critical structures for proper selection of TAD length. In addition,
assessment of bone density is possible from the volumetric data which allows
In recent trends a number of orthodontic diagnosis and treatment plan
changes varied widely by patient characteristics. The most frequently reported
diagnosis and treatment plan changes were in patients with unerupted teeth,
severe root resorption, or severe skeletal discrepancies.
Hodges et al, 201326, supported that obtaining a CBCT scan before
orthodontic diagnosis and treatment planning is necessary when a patient has
an unerupted tooth with delayed eruption or a questionable location, severe
root resorption as diagnosed with a periapical or panoramic radiograph, or a
severe skeletal discrepancy. He proposed that CBCT scans should be ordered
only when there is clear, specific, individual clinical justification.
Fernanda et al. 201323, presented a novel classification method for
individual assessment of midpalatal suture morphology using CBCT. They
identified and defined five stages of maturation of the midpalatal suture. Stage
A, straight high-density sutural line, with no or little interdigitation; Stage B,
scalloped appearance of the high-density sutural line; Stage C, 2 parallel,
scalloped, high-density lines that were close to each other, separated in some
areas by small low-density spaces; Stage D, fusion completed in the palatine
bone, with no evidence of a suture; and Stage E, fusion anteriorly in the
maxilla.
They concluded that this new classification method has the potential to
surgically assisted rapid maxillary expansion for late adolescents and young
adults.
The heightened use of cone-beam computed tomography in
orthodontics has been coupled with increasing concern about the long-term
risks of x-ray exposure in orthodontic patients.
Ludlow et al. 201342, calculated the effective doses in various
combinations of field of view size and field location comparing child and adult
anthropomorphic phantoms. Scan protocols used were high resolution (360
degrees rotation, 600 image frames, 120 kV[p], 5 mA, 7.4 seconds), standard
(360 degrees, 300 frames, 120 kV[p], 5 mA, 3.7 seconds), QuickScan (180
degrees, 160 frames, 120 kV[p], 5 mA, 2 seconds), and QuickScan+ (180
degrees, 160 frames, 90 kV[p], 3 mA, 2 seconds).
Contrast-to-noise ratio was calculated as a quantitative measure of image
quality for the various exposure options using the QUART DVT phantom.
QuickScan+ effective doses were comparable with conventional panoramic
examinations. Significant dose reductions are accompanied by significant
reductions in image quality.
Suomalainen.A et al. 201472, quantified the outcome of SABG
(secondary alveolar bone graft) in children with unilateral cleft lip and palate
using CBCT . CBCT images taken 6 months after SABG of 35 patients were
analysed. Vertical and horizontal bone supports of the grafted bone at three
floor was compared with the unaffected side, and the inter- and intraexaminer
reproducibility of these evaluations was assessed.
They concluded that the vertical height, thickness, and localization of
the bone graft were possible to be evaluated. CBCT permits to assess the
presence and spatial location of the alveolar bone graft when measured under
standardized outcome criteria for SABG.
Shilpa Kalra et al. 201432, compared the accuracy of
two-dimensional radiographs with a cone beam computed tomography (CBCT) for
mini-implant placement. An ideal site for mini-implant placement at the
buccal interradicular space between the second premolar and the first molar
was determined for 40 sites (in 13 patients aged 14 to 28 years) by using
CBCT data. The mini-implant placement procedure was then divided into two
groups.
In CBCT group, mini-implants were placed at the sites determined from
CBCT data. In RVG group, mini-implants were placed with the help of
two-dimensional digital radiographs and a custom made guide. Post placement
CBCT scans were obtained to determine the accuracy of the mini-implant
placement.
They concluded that CBCT provides accurate three dimensional
visualization of the inter-radicular space, two-dimensional intraoral
radiographs seem to provide sufficient information for mini-implant
Considering the high cost and higher radiation dose as compared to
two-dimensional radiographs, the routine use of CBCT is not recommended
for orthodontic mini-implant placement. However, if mini-implant placement
is difficult because of complex anatomy such as an expanded sinus or alveolar
bone loss, the use of CBCT data for planning may be considered.
TEMPORARY ANCHORAGE DEVICES (TADs)
Temporary anchorage device (TAD) is a device that is temporarily
fixed to bone for the purpose of enhancing orthodontic anchorage either by
supporting the teeth of the reactive unit or by obviating the need for the
reactive unit altogether, and which is subsequently removed after use. Cope 200514,
Anchorage :
Freudenthaler 200124 - Anchorage in orthodontics is defined as the
amount of allowed movement of the reactive unit in a force system.
Another definition of anchorage as given by Daskalogiannakis & Ammann 200017, states that “anchorage is resistance to unwanted tooth
movement”. In many situations, movement of the reactive unit is desirable, but
quite frequently it is critical for the reactive unit in the orthodontic system to
remain absolutely stationary while the active unit is moved in its desired
Papadopoulos &Tarawneh 200759; Cope JB14Miniscrew implants or
MSIs, have also been referred to as: microimplant, microscrew implant,
mini-implant, mini dental mini-implant, miniscrew, temporary anchorage device (TAD),
and OrthoImplant.
According to Cope JB14, Micro- is an inappropriate term, since it is
derived from microscopic or something so small that it can only be visualized
with a microscope.
Sung et al. 200671 disagrees saying that micro- can be used to
emphasize small size such as in the terms microsomia, micrognathia,
microdontia and that “micro” should be used for implants smaller than 1.9mm
and “mini” for implants greater than 1.9mm, but still much smaller than
traditional dental implants.
Misch, 198851,classified the density of bone present in the maxilla and
mandible as D1, a dense cortical bone mostly seen in the anterior mandible at
less than 1250 Hounsfield units, then D2, a porous cortical and coarse
trabecular bone quality present commonly in the anterior and posterior
mandible and anterior maxilla which can be viewed at 850 to 1250 Hounsfield
units, then D3, a thin porous cortical and coarse trabecular bone seen in the
posterior mandible, anterior and posterior viewed at 350 to 850 Hounsfield
units, and D4, a fine trabecular bone seen in the posterior maxilla viewed at
Retention
Retention of MSIs in bone depends on different influencing factors
such as a) the miniscrew implant type, the miniscrew implant dimensions b)
the implant surface characteristics Kim et al. 200935,c) the insertion angle
Wilmes, Su &Drescher 200877,d) the drilling hole size e) the insertion torque
Motoyoshi et al. 200655,f) the force magnitude Cheng et al9. g) the anatomic
location Wiechmann et al76.quality and quantity of the bone, the soft tissue
characteristics Cheng et al9. and inflammation of the peri-implant area
Miyawaki et al. 200352. Stability of Mini-Implant
Marquezan et al. 201146, Meredith et al49. When discussing
miniscrew implant stability and retention, it is important to define and
understand the influence of both primary and secondary stability separately.
Primary stability is a function of the mechanical retention between the
miniscrew implants threads and the bone, and expresses the initial stability of
a recently placed miniscrew implants. It is most often indirectly measured by the moment of force required to screw the miniscrew implant into the bone.
This force is most commonly referred to as “insertion torque”Meredith et al. Chen et al. 20098, performed a systematic review of the literature,
which identified primary stability, measured by insertion torque, as the most
adequate following implantation, the implant-bone interface is weakened and
resulting miniscrew implant micro-motion can cause failureChen, Kyung, et al. 20098.
Javed et al. 201131,states that the primary stability, which is important
for MSI survival, is measured in most studies by means of the insertion torque
or pull out strength.
Meredith49; Baumgaertel 20104, Secondary stability is a consequence
of bony remodeling at the MSI bone interface and refers to the MSI’s stability
after the placement site has healed. It represents the maintenance of stability as
a result of localized healing and bony remodeling, with the possibility of new
bone formation at the interface. Secondary stability is mainly dependent on the
host’s response to the MSI and is influenced by several factors.
The success rates of orthodontic microimplants have been reported
differently because of several variables. In addition, many studies have
recently been performed to determine factors affecting their success rates.
Among them, root proximity to the orthodontic implant, cortical bone
thickness, and placement angle have been reported frequently.
Yi-Ra Jung et al. 201181,examined microimplants implanted into the
maxillary buccal alveolar bone at the midpoint between the roots of the
adjacent teeth, and immediately loaded with orthodontic forces of about 50 to
determined by measuring the occlusal and mesial angles between the bone
surface and the orthodontic microimplant’s long axis on the reoriented coronal
and axial views of the CBCT images, respectively.
Vertical and horizontal placement angles and cortical bone thickness are not
significantly related to the success rate of orthodontic microimplants, but root
proximity is significantly related to their success.
Cortical bone thickness is significantly related to the vertical and horizontal
placement angles, but root proximity is not significantly related to the vertical
and horizontal placement angles.
Factors Affecting Mini-Implant Failure Rates
Primary stability has been shown to be the most critical factor for the
success of orthodontic MSIChen, Kyung, et al. 20098.A review of literature
identifies several factors that affect the insertion torques reached and resulting
primary stability of miniscrew implants. It has been well established that when
comparing screws of varying size, an increase in miniscrew implants diameter
has a very strong influence on peak insertion torques reached Lim et al. 200838,while MSI length influences insertion torque to a lesser degree Kim et
al. 200935.
Wilmes &Drescher 200877, Numerous studies have shown that
tapered screws reach significantly higher insertion torques, explained by the
Cortical bone thickness plays a significant role in MSI primary stability since
thicker layers of compact bone cause increased placement resistance.
Uemura et al. 201274,also well documented is the effect of MSI site
preparation on insertion torques reached. The presence of a pilot hole
decreases insertion torques due to decreased bone-to-metal contact, while the
size of the pilot hole is inversely proportional to the implant primary stability.
Devlin et al. 199820,of all factors studied, it is generally agreed that
the alveolar bone quality, cortical bone thickness and insertion torque are
among the most important factors for achieving good primary stability.
Regional differences in jaw anatomy and bone structure may explain some of
the variation in clinical success rate between the maxilla and mandible.
Additional factors discussed in the literature affecting implant primary
stability include: thread design, MSI surface area, insertion depth, insertion
angle and bone quality related to age of the patientMotoyoshi et al. 201056.
Thickness is a measure of the quantity of cortical bone. Bloom RA et al, 19805, stated that measuring cortical thickness, if not the best, is a good to
way to estimate bone mineralization.
Deguchi et al. 200619.,conducted a study to measure the cortical bone
thickness of various potential miniscrew implant placement sites in the maxilla
and mandible using CT scans from 10 adults . Measurements were taken at
lingual regions of the maxilla. Those levels were specified as being at the
occlusal level (3-4 mm apical to the gingival margin) and at the apical level
(6-7 mm apical to the gingival margin). The common mini-screw implant sites
measured were mesial and distal to the first molar and distal to the second
molar.
Cortical bone thickness, however, varied significantly at certain sites within
and between the maxilla and mandible. Significantly less cortical bone was
seen in the maxillary buccal region at the occlusal level distal to the second
molar when compared with other areas in the maxilla.
Additionally, maxillary cortical bone was significantly thicker on the lingual
side of the second molar site when compared to the buccal side. In the
mandible, there was significantly more cortical bone mesial and distal to the
second molar when compared with the maxilla.
No significant difference between vertical locations was noted within either
the mandible or the maxilla. Yet, there was a significant difference between
the mandible and maxilla at the different vertical heights. There was
significantly more cortical bone in the mandibular molar region than the same
region of the maxilla. This finding is consistent with that of Peterson et al. 200661.
Motoyoshi, et al. 200754, in the cross sections mesial to the first molar, the
and 1.59 to 2.66 mm in the mandible and inclined to increase with height. In
cross sections distal to the first molar, the average cortical bone thickness
ranged from 1.14 to 2.12 mm in the maxilla and 2.10 to 3.03 mm in the
mandible.
The cortical bone thickness of the mandible in adolescents was thinner than in
adults at heights of 3–8 mm. No significant difference in cortical bone
thickness was observed in the mandible according to gender. Thus the
morphometric analysis revealed that the cortical bone of the mandible was
significantly thicker than that of the maxilla at any location in the buccal
posterior region, and the mandible suffices as a preparation site for
mini-implants.
Bone quality is known to be one of the major factors in the stability of
miniscrews. Since mandibular second molar region has thinner cortical bone
than mandibular third molar region so could show a lower success rate. Cheol-Hyun Moon 200811.
Friberg et al 199525., studied bone quality using six mandibles and
four maxillas of adult cadavers to demonstrate the cutting resistance (i.e.,
friction) experienced when placing 31 endosseous titanium implants into 31
threaded canals. Bone area measurements were performed around the
implants. The cutting resistance values, together with the total bone area
The results of the study showed that there was a tendency for higher
cutting resistance values were seen in the incisor area than in the premolar
area of both the maxilla and mandible. The correlation between cutting
resistance and bone density was statistically significant, indicating that
increase in the cutting resistance is directly proportional to the bone density.
The more resistance experienced, the more dense the bone.
Therefore, based on this study, bone density is increased in mandible
than in the maxilla, and within each jaw, bone tended to be denser in the
incisor region than that of the premolars.
The study draws a conclusion that there are differences in bone
density, between maxilla and mandible, as well as within each jaw. Therefore
an understanding of the quantity and quality of bone is of prime importance
for placing temporary anchorage devices.
Cortical bone thickness in infrazygomatic region
Santos et al. 201766, Evaluated the infrazygomatic crest region
thickness in adult (male and female) patients using Cone-beam computerized
tomography (CBCT) images from 40 patients , at thickness 2 mm above the
distobuccal root of the permanent maxillary first molar (Measurement 1), and
2 mm above the first measurement (Measurement 2). They concluded that the
mean thickness of the infrazygomatic crest in males was 3.55 mm for
2.37mm and 2.24mm , respectively and the overall mean thickness of the
infrazygomatic crest was 2.49 mm with respect to measurement 1, and 2.29
mm for measurement 2, with no statistically significant differences between
gender.
Baumgaertel et al. 2009 3,When inserting orthodontic mini-screws (6
mm or longer) into the infrazygomatic crest, perforation of the maxillary sinus
or the nasal cavity can be expected. However, the anatomy at this site varies
considerably between individuals.
Hence theyinvestigated the bone depth at the infrazygomatic crest with regard
to orthodontic mini-screw insertion. They stated that the greatest bone depth
was available at, on average, 11.48 +/- 1.92 mm apical from the
cemento-enamel junction of the maxillary first molar and decreased rapidly further
apically. Maximum bone depth (7.05 +/- 3.7 mm) was present at the lowest
measurement level.
However, here, insufficient clearance to the molar roots was present. Both the
measurement site and the level at which the measurements were conducted
had a significant impact on bone depth.
Farnsworth et al.201121, assessed age, sex, and regional differences in
the cortical bone thickness of commonly used maxillary and mandibular
miniscrew implant placement sites. They concluded that there were showed no
significant differences in cortical bone thickness between the sexes, but
adult cortices significantly thicker in all areas except the infrazygomatic crest,
the mandibular buccal first molar-second molar site, and the posterior palate
site. But the mandibular buccal and infrazygomatic crest regions had the
thickest cortical bone.
Cattaneo PM et al. 2003 7, on Finite element analyses for cortical
thickness at infra zygomatic region, A finite element analysis allows us to
simulate the displacement of a molar in relation to the well-defined
morphology of the maxilla. Three 3-dimensional unilateral models of a
maxilla from a skull with skeletal Class I and neutral molar relationships were
produced based on CT-scan data.
The maxillary first molar was localized so that the contour of the mesial root
continued into the infrazygomatic crest. When the molar was loaded with
occlusal forces, the stresses were transferred predominantly through the
infrazygomatic crest. This changed when mesial and distal displacements of
the molars were simulated. In the model with mesial molar displacement, a
larger part of the bite forces were transferred through the anterior part of the
maxilla, resulting in the buccal bone being loaded in compression.
In the model with distal molar displacement, the posterior part of the maxilla
was deformed through compression; this resulted in higher compensatory
tensile stresses in the anterior part of the maxilla and at the zygomatic arch. In
other words, the functional demands placed on this region could explain its
Hyub-Soo Lee et al. 201329, investigated the bone thickness of the
infrazygomatic crest area by computed tomography (CT) for placement of a
miniplate as skeletal anchorage for maxillary protraction in skeletal Class III
children. The bone thickness of the infrazygomatic crest area was measured at
35 locations on the right and left sides, perpendicular to the bone surface.
Results showed that the bone was thickest (5.0 mm) in the upper zygomatic
bone and thinnest (1.1 mm) in the anterior wall of the maxillary sinus.
Generally, there was a tendency for the bone to be thicker at the
superior and lateral area of the zygomatic process of the maxilla. There was no
clinically significant difference in bone thickness between the right and left
sides; however, it was thicker in male than in female subjects.
They concluded that in the infrazygomatic crest area, the superior and
lateral area of the zygomatic process of the maxilla had the most appropriate
thickness for placement of a miniplate in growing skeletal Class III children
with a retruded maxilla.
W. Liou et al. 200740, to derive clinical implications and guidance for
inserting miniscrews in the IZ crest without injuring the mesiobuccal root of
the maxillary first molar they measured the thickness of the infrazygomatic
(IZ) crest above the maxillary first molar at different angles and positions to
the maxillary occlusal plane.
The results showed that the IZ crest thickness above the maxillary first
the maxillary occlusal plane and 13 to 17 mm above the maxillary occlusal
plane.
They concluded that Bone thickness of the IZ crest above the maxillary first
molar is 5 to 9 mm, when it is measured at 40° to 75° to the maxillary occlusal
plane and 13 to 17 mm above the maxillary occlusal plane. By adopting 6 mm
as the minimum IZ crest thickness for sustaining a miniscrew well throughout
treatment and avoiding bone stripping, injury to the mesiobuccal root of the
maxillary first molar, and alveolar/ buccal mucosa irritation.
The clinical implication for miniscrew insertion in the IZ crest of adults is 14
to 16 mm above the maxillary occlusal plane and the maxillary first molar, and
at an angle of 55° to 70° to the maxillary occlusal plane.
Yi-Jyun Chen et al. 201080, evaluated the hard- and soft-tissue
thicknesses of TAD insertion sites and the perforation ratio with different
lengths of TADs using cone beam volumetric computed tomography (CBCT)
in order to increase the success rate of (TADs) and not to cause root injury or
soft-tissue inflammation.
The results showed that the average bone depth of the IZ crest in this
study was 5.89 mm; the bone depth of the IZ crest in the male group was
longer than 6 mm, but not that in the female group (not statistically
significant). It was supposed that the variation in IZ crest thickness might be
Flavio Uribe et al. 201575, conducted a pilot study to evaluate the
failure rates of mini-implants placed in the infrazygomatic region and to
evaluate factors that affect their stability.
A retrospective cohort study of 30 consecutive patients (55 mini-implants)
who had infrazygomatic mini-implants at a University Clinic were evaluated
for failure rates. Patient, mini-implant, orthodontic, surgical, and mini-implant
maintenance factors were evaluated for association to failure rates.
A 21.8 % failure rate of mini-implants placed in the infazygomatic region was
observed. They concluded that this failure rate is slightly higher than that
reported for mini-implants placed interradicularly and patient, mini-implant,
orthodontic, surgical, and mini-implant maintenance factors were not
predictive of failure rates.
Haibo Liu et al. 201741,assessed the anatomic structure of the buccal
alveolar bone in the infrazygomatic crest region with cone-beam computed
tomography to locate safe zones for miniscrews in maxillary dentition
distalization.
The buccal alveolar bone was analyzed in 3 regions of 60 patients (A)
between the maxillary second premolar and first molar (U5-U6), (B) between
the mesiodistal roots of the first molar (U6), and (C) between the maxillary
first and second molars (U6-U7). Alveolar bone thickness at the buccal side of
the roots and the interradicular space at the buccal side of the roots were
to the maxillary sinus floor. The buccal bone height was measured from the
alveolar crest edge to the sinus floor.
The results of the study was that the buccal alveolar bone was thicker in the
U6-U7 region than in the U6 and U5-U6 regions. The buccal alveolar bone
thickness tended to get thicker from the alveolar crest to the sinus floor. The
thickest buccal alveolar bone of 4.07 mm was observed at the plane of 11 mm
of the U6-U7 region.
The percentages for the height of bone from the crest edge to the sinus floor
were smaller than 10 mm at the regions of U5-U6, U6, and U6-U7: 38%, 52%,
and 43%, respectively. The interradicular space was smallest in the U6 region
and largest in the U5-U6 region. They concluded that The region between the
maxillary first and second molars (U6-U7) should be the first choice for a
minisrew implanted in the buccal alveolar bone in the infrazygomatic crest
MATERIALS AND METHODS
The present in-vitro study was carried out in the Department of
Orthodontics and dentofacial Orthopedics, Ragas Dental College and
Hospitals, Chennai.
The cone beam computed tomography (Digital Kodak 9500 cone
beam tomography scan, France) images of 40 subjects irrespective of
gender, who reported to the Department of Orthodontics and Dentofacial
Orthopedics at Ragas Dental College and Hospital were analyzed.
Inclusion criteria
• The CBCTs which were taken as a pretreatment record for
subjects with temperomandibular joint problems, facial asymmetries, patients
with ectopically erupting teeth. Out of which 40 CBCTs were randomly
selected from the database available in our department.
Exclusion criteria
• Subjects who had already undergone orthodontic treatment or
undergoing current orthodontic treatment.
• Subjects with noticeable periodontal disease.
• Subjects with previous history of trauma.
The CBCT images which were stored in DICOM format were
analyzed using Dolphin software (version 11.8).For all scans, the minimum
field of view used was 11 cm, and scan time ranged from 8.9 to 20 seconds
with a resolution of 0.25 to 0.30 mm. A fully reconstructed three-dimensional
image with sagittal, coronal and axial planes of the maxilla was generated and
the following measurements were taken on right and left sides to be computed:
The planes selected for cortical bone measurements from maxillary
first molar to maxillary second molar are:
• Mesial of maxillary first molar (6M),
• Middle of the crown through the furcation area of the maxillary
first molar (6Middle).
• Interradicular bone/interdental region between the maxillary
first and second molars (6-7IR).
• Middle of the crown through the furcation area of the maxillary
second molar (7Middle).
• Distal of the maxillary second molar (7D)
The cortical bone thickness was measured at heights of 8mm, 10mm, 12mm
Reference lines
• The horizontal reference line - the line passing through the
cemento-enamel junction of both the right and left molars.
• The vertical reference line - the line parallel to the long axis of the
molars .
The cortical bone thickness was measured from the cemento enamel
junction towards the maxillary sinus floor at various heights of 8 mm, 10 mm,
12 mm and 14 mm along the mesial of upper first molar, middle of the crown
through the furcation area of the maxillary first molar (6Middle),
interradicular bone/interdental region between the maxillary first and second
molars (6-7IR), middle of the crown through the furcation area of the
maxillary second molar (7Middle), distal of the maxillary second molar (7D).
HYPOTHESIS: No difference in bone thickness in the infrazygomatic
STATISTICAL ANALYSIS
The following statistical procedures were carried out :
1. Data compilation and presentation
2. Statistical analysis
I Data compilation and presentation:
Data obtained were systematically compiled in Microsoft Excel spread
sheet . The dataset was subdivided and distributed meaningfully and presented
as graphs and tables.
II. STATISTICAL ANALYSIS :
Statistical analysis were performed using Statistical Package for Social
Sciences Software (SPSS version 22.0, IBM ). Data comparison was done by
applying specific statistical tests to find out the statistical significance of the
obtained results. Depending on the nature of the data, statistical tests were
chosen . p value of 0.05 was considered to be significant.
Normality was checked using Kolmogrov Smirnov test. All the data were
found to be not normal in distribution. Hence, non-parametric test was used.
The inter group comparison between 5 different slices were done using
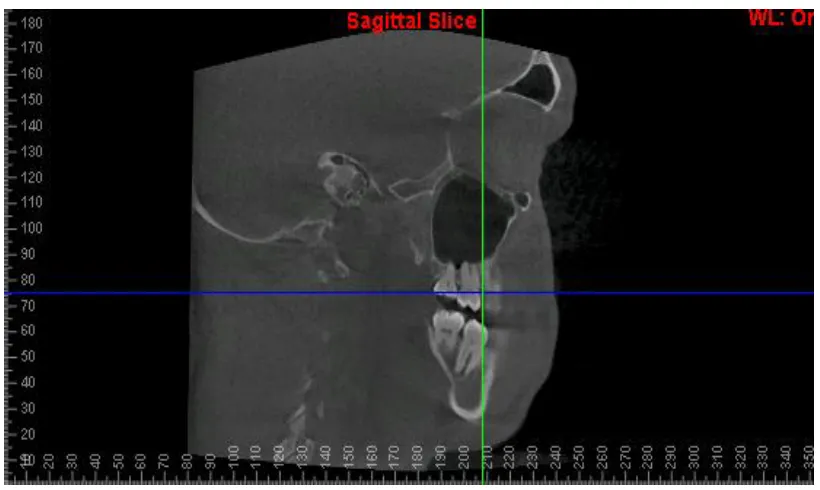
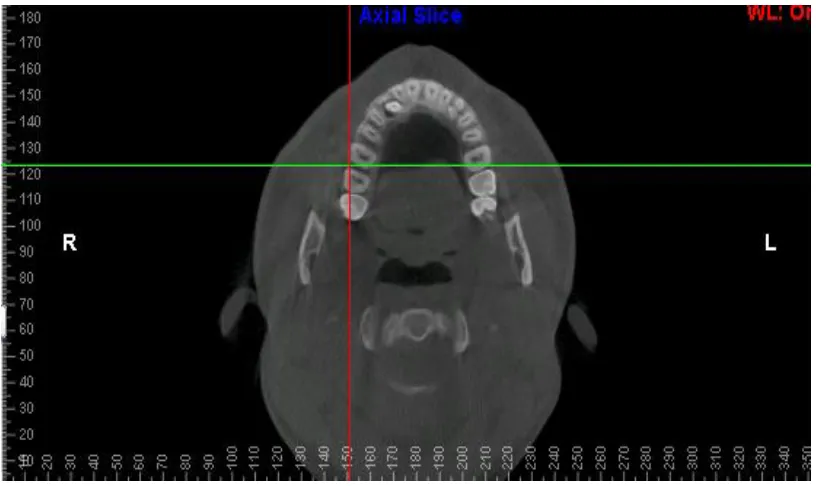
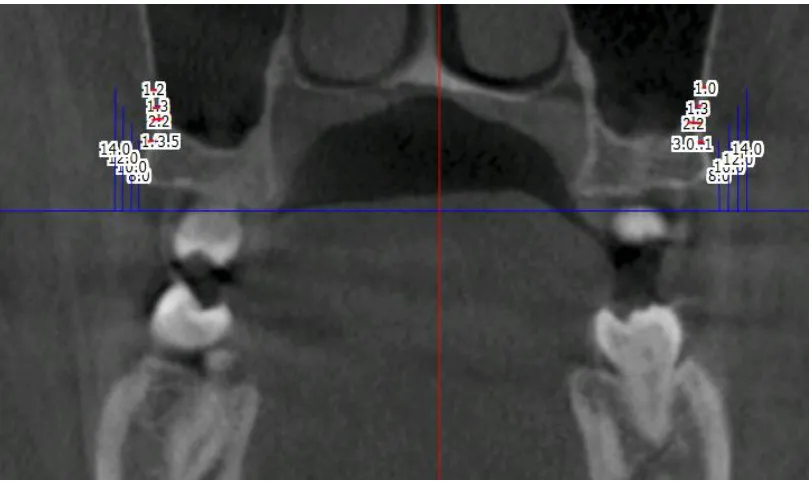
FIGURE 1 : CBCT IMAGE OF A SUBJECT
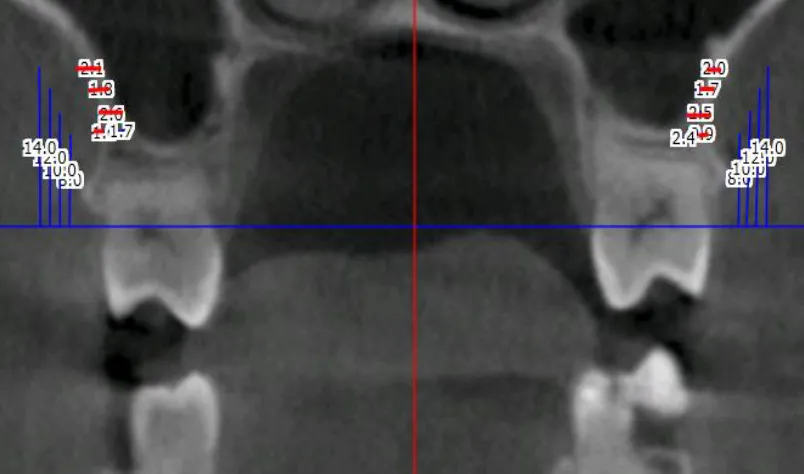
FIGURE 3: CORONAL VIEW CBCT SLICE
FIGURE 5: MESIAL OF MAXILLARY FIRST MOLAR – 6 MESIAL
[image:43.612.111.513.455.692.2]
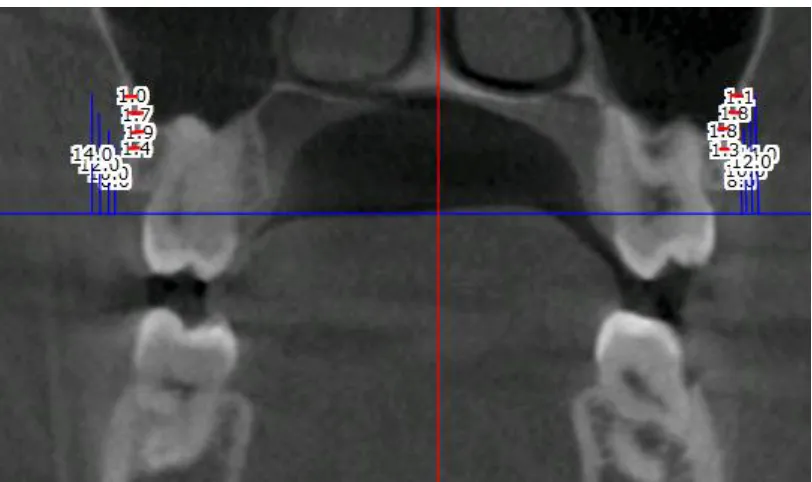
FIGURE 6: MIDDLE OF MAXILLARY FIRST MOLAR – 6 MIDDLE
FIGURE 7: INTERDENTAL REGION BETWEEN MAXILLARY FIRST MOLAR AND SECOND MOLAR - 6-7 INTERDENTAL
[image:44.612.108.514.459.700.2]
FIGURE 9: DISTAL OF MAXILLARY SECOND MOLAR – 7 DISTAL
RESULTS
This in-vitro study was performed to evaluate the thickness of cortical bone in the infra zygomatic region using bone mapping – a cone beam computed tomography study. The results are based on bone mapping done on 40 CBCTs in the range of 18 to 30 years of age (Fig 1).
All the CBCTs were obtained from the patients who reported seeking treatment to the Department of Orthodontics and Dentofacial Orthopaedics at Ragas Dental College and Hospital, Uthandi, Chennai, India .
Descriptive statistics was carried out statistically to determine the cortical bone thickness in the study group,
The results are discussed under the following headings:
1. Comparison of cortical bone thickness in the infra zygomatic region along 5 different slices (anteroposteriorly).
Comparison of cortical bone thickness in the infra-zygomatic regions along 5 different slices (anteroposteriorly) :
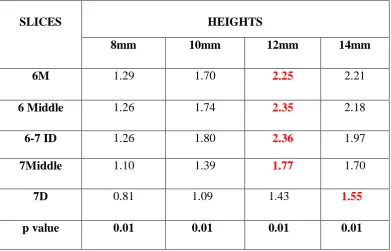
The mean and the standard deviation of cortical bone thickness at 5 different slices were compared (Table 1) .
The cortical bone thickness among 5 different slices, at 4 different heights are highly statistically significant (p =0.01). The cortical bone thickness gradually increased from mesial of maxillary first molar (6M) towards the interdental region between the maxillary first and second molar ( 6-7 ID) . This gradually decreased from middle of second molar (7 Middle) towards the distal of second molar (7D) . The cortical bone thickness tended to get thicker from cemento-enamel junction towards the maxillary sinus floor along the heights of 8mm, 10mm & 12mm and started to decrease towards 14mm (Figure: 11).
The interdental region between the maxillary first and second molar (6-7ID) had the thickest cortical bone of 2.36mm at the height of 12mm from the cemento-enamel junction. The distal of second molar (7D) had the thinnest bone of 0.81mm at the height of 8mm (Table 1&2).
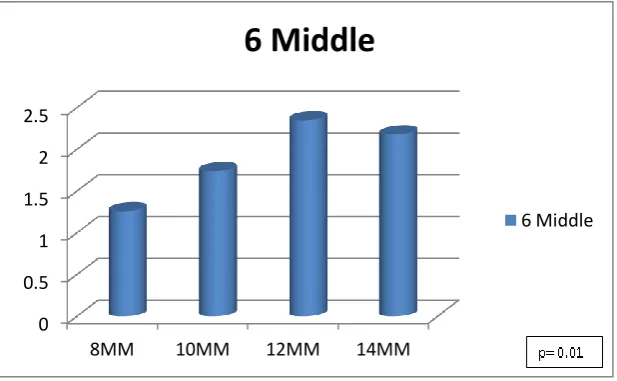
The middle of first molar (6Middle) had the thickest cortical bone of 2.35mm at the height of 12mm from the cemento-enamel junction and thinnest of at the height of 8mm (Figure 13) ( Table 1).
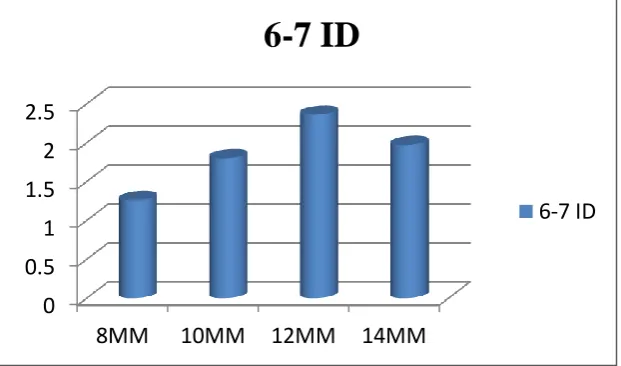
The interdental region between the maxillary first and second molar (6-7 ID) had the thickest cortical bone of 2.36mm at the height of 12mm from the cemento-enamel junction and thinnest at the height of 8mm (Figure 14) ( Table 1).
The middle of second molar (7Middle) had the thickest cortical bone of 1.77mm at the 12mm from the cemento-enamel junction and thinnest at the height of 8mm (Figure 15) ( Table 1).
The distal of second molar (7D) had the thickest cortical bone of 1.55mm at the 14mm from the cemento-enamel junction and the thinnest at the height of 8mm (Figure 16) ( Table 1).
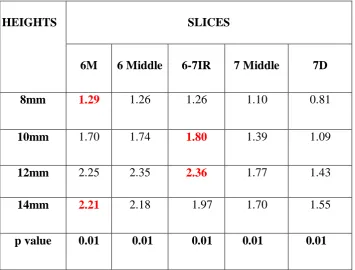
2. Comparison of cortical bone thickness in the infra zygomatic regions at 4 various heights.
The mean cortical bone thickness was more at the height of 12mm in all 5 slices except for the distal of second molars (7D), which was at the height of 14mm (Table 2).
At the height of 10mm, the cortical bone thickness was more in the interdental region between the maxillary first and second molar (6-7 ID) which was 1.8mm (Figure 18) ( Table 2).
At the height of 12mm, the cortical bone thickness was more in the interdental region between the maxillary first and second molar (6-7 ID) and the middle of maxillary first molar (6Middle) which was 2.36mm and 2.35mm respectively (Figure 19) ( Table 2).
Table 1: Mean values for each of the heights at various slices.
SLICES HEIGHTS
8mm 10mm 12mm 14mm
6M 1.29 1.70 2.25 2.21
6 Middle 1.26 1.74 2.35 2.18
6-7 ID 1.26 1.80 2.36 1.97
7Middle 1.10 1.39 1.77 1.70
7D 0.81 1.09 1.43 1.55
p value 0.01 0.01 0.01 0.01
Table 2: Mean values for each of the slices at various heights.
HEIGHTS
SLICES
6M 6 Middle 6-7IR 7 Middle 7D
8mm 1.29 1.26 1.26 1.10 0.81
10mm 1.70 1.74 1.80 1.39 1.09
12mm 2.25 2.35 2.36 1.77 1.43
14mm 2.21 2.18 1.97 1.70 1.55
p value 0.01 0.01 0.01 0.01 0.01
FIGURE 11: Mean values for each of the heights at various slices. MALE 52% FEMALE 48%
n
0 0.5 1 1.5 2 2.58mm 10mm 12mm 14mm
6M 6 Middle 6-7ID 7 Middle 7D
[image:54.595.151.479.86.322.2] [image:54.595.130.496.389.611.2]FIGURE 12. Cortical bone thickness mesial to 1st molar (6M) along 8mm, 10mm, 12mm, 14mm.
[image:55.595.144.453.501.691.2]
FIGURE 13. Cortical bone thickness middle to the 1st molar (6 Middle) along 8mm, 10mm, 12mm, 14mm.
0 0.5 1 1.5 2 2.5
8mm 10mm 12mm 14mm
6M
6M
0 0.5 1 1.5 2 2.5
8MM 10MM 12MM 14MM
6 Middle
FIGURE 14. Cortical bone thickness in the interdental region between the maxillary first and second molar (6-7 ID)
along 8mm, 10mm, 12mm, 14mm.
FIGURE 15. Cortical bone thickness middle of the 2nd molar (7 Middle) along 8mm, 10mm, 12mm, 14mm.
0 0.5 1 1.5 2 2.5
8MM 10MM 12MM 14MM
6-7 ID
6-7 ID 0 0.5 1 1.5 28MM 10MM 12MM 14MM
7 Middle
0 0.5 1 1.5 2
8MM 10MM 12MM 14MM
7 D
7 D 0 0.2 0.4 0.6 0.8 1 1.2 1.46M Middle 6 6-7 ID MIddle 7 7D
8mm
[image:57.595.145.463.107.349.2]8mm
FIGURE 16. Cortical bone thickness distal to the 2nd molar (7D)along 8mm, 10mm, 12mm, 14mm.
[image:57.595.146.464.110.655.2]0 0.5 1 1.5 2
6M 6 Middle
6-7 ID 7 Middle 7D
10mm
10mm 0 0.5 1 1.5 2 2.56M 6 Middle 6-7 ID 7 Middle 7D
12mm
12mm
[image:58.595.139.462.82.636.2]along all the 5 regions.
[image:58.595.144.456.83.354.2] [image:58.595.148.467.446.649.2]
0 0.5 1 1.5 2 2.5
6M 6 Middle 6-7 ID 7 Middle 7D
14mm
[image:59.595.140.469.163.373.2]14mm
DISCUSSION
The aim of our study was to analyze and measure the buccal cortical
bone thickness in the infrazygomatic crest (IZC) along the maxillary first and
second molar regions at four different heights from the cementoenamel
junction (vertically) and along five different slices taken from the mesial of
maxillary first molar to distal of maxillary second molar (horizontally) to
determine safe zones for ideal placement of temporary anchorage devices
(TADs). This is to obtain good primary stability and for the distalization of
maxillary dentition without affecting periodontal health.
Prevalence of malocclusion traits show a definite ethnic and
geographical variation. Worldwide data shows it to be more prevalent in
whites than in blacks, more in developed countries than developing countries
and more in urban as compared to rural population65.
Indian population is comprised of multitude of races and ethinicity,
there is a definite racial and geographical variation between the northern and
southern parts of India.
A literature review by Sandhu65 , stated that the prevalence of Class II
malocclusion in Delhi and Haryana (North India) is much higher (10-15%)
when compared to Bangalore and Thiruvananthapuram (South India) where it
is only around 5%. In addition, the prevalence of bimaxillary protrusion is
Class I malocclusion is the most prevalent malocclusion in India
followed by class II and class III which is different from Chinese and Korean
population, which is mostly class III malocclusion37.
The prevalence of type of malocclusion in an ethnic chinese population
was studied by Lew KK37 and found to have a high incidence of Class III
malocclusion when compared with caucasians.
Various authors have evaluated, safe zones for miniscrew placement in
interradicular spaces, using CBCT. To the best of our knowledge, an
evaluation of the anatomic structure in buccal cortical bone at the
infrazygomatic region, three dimensionally has not been done in our
population. Hence we set out to create a standard or normative data among our
population. This study can be considered a pilot study for the future studies on
this domain.
CORTICAL BONE THICKNESS
The thickness of available cortical bone is of vital importance for
stability of mini-implants placed, and one of the common reason for the failure
of mini-implant is insufficient bone. The implant stability here depends on
mechanical interdigitation of bone and implant rather than osseointegration.
Therefore, bone quantity seems to be the major factor in the stability of
Kim34 stated that the stability of miniscrew implants depends on the quality
(bone density) and quantity (bone volume) of the cortical bone. The main
objective of an orthodontic screw is to gain maximum retention by placing the
screw in an area with the thinnest soft tissue and the thickest cortical bone.
Numerous anatomical sites for placement of miniscrews have been
discussed by Park60, where he inserted micro-implants of 1.2 mm in diameter
into the alveolar bone between the roots of the posterior teeth to change the
direction of the applied force towards increasing the horizontal component of
the force.
He did a CT (Computed Tomography ) study to provide safe locations
for clinicians to place mini-implants where he observed that the inter-radicular
space between the second premolar and first molar root in the upper arch and
inter-radicular space between the first molar and the second molar root in the
lower arch were suitable sites.
Later, Poggio62 provided an anatomical map for placing miniscrews in
the interradicular area in both maxilla and mandible and also came up with the
desired morphological features that an ideal miniscrew should possess, so
that, it could be safely placed in inter-radicular areas.
Wherein studies by Kuroda36 stated that the major problem
encountered with placing TADs inter-radicularly, is the increased risk of root
wherein a tooth has not moved a sufficient distance to an expected position
and is already touching the TAD. This situation that could never occur if they
were placed in the extra-alveolar region, because of the above reason it is
preferable to place mini-implants in the portion above the alveolar process
whenever possible.
The extra-alveolar sites available for placement of TADs include incisive
fossa, premaxillary region, midpalatal region, and symphysis, canine fossa,
infrazygomatic (IZ) crest, anterior external oblique ridge (AEOR), retromolar
area, and sublingual fossa.
Chris Chang13 enumerated many advantages of extra-alveolar sites
over inter-radicular (I-R) sites, which are, less risk of tooth root damage, more
bone at the site of placement which permits a larger screw diameter (2mm), no
interference with the path of tooth movement, adequate anchorage for enmasse
retraction, much lower failure rates and the need for fewer TADs for
comprehensive treatment of severe malocclusions.
In addition to this, Melsen and Verna47 stated other advantages of
placing TADs in extra alveolar sites can provide easier and wider applications
in tooth movement, such as intrusion of posterior segment, retraction of
anterior teeth, molar uprighting, distalisation of maxillary and mandibular
Studies by cortical bone thickness and root proximity in maxillary
inter-radicular sites by Sawada67 stated that a cortical bone thickness of atleast
1 mm is necessary to achieve mini-implant stability. On measuring the cortical
bone thickness, the superior part of the alveolar process tended to be thicker
than the inferior part.
On evaluating cortical bone thickness of the upper jaw, Cassetta6
found that the buccal cortical bone was thinner than the palatal cortical bone.
There is an increase of thickness and density from crest to base of alveolar
bone. Studies by Baumgaertel4showed that the buccal cortical bone thickness
decreased at the 4-mm mark before it increased again at the 6-mm mark.
These findings agree with the study of Kim34 when they investigated
the buccal interproximal areas of the maxilla, found that, the ‘‘cortical bone
was thickest closest to and farthest from the CEJ and thinnest in the middle.’’
This demonstrates that, to maximize cortical bone anchorage in the maxillary
buccal sextants, the mini-implant should be placed more than 4 mm apically
from the alveolar crest, which means that when placing the mini-implants in
the maxillary buccal sextants, it has to be placed close to the mucogingival
junction or perhaps even in mucosa.
But as we go apically, the presence of the nasal cavity and maxillary
perforations less than 2 mm of the maxillary sinus can heal by themselves and
rarely caused complications.
Apart from this the anatomical limitations imposed by the transition
from the attached gingiva to the alveolar mucosa needs to be considered. One
of the potential problem of placing TADs in extra-alveolar bony sites is that, if
placed extra-alveolarly, the TAD will lay in mobile alveolar mucosa, possibly
causing problems.
Shih–Jung Cheng10 stated that, TAD when placed in some
extra-alveolar bony sites, due to the lack of adequate keratinized mucosa may
potentially cause mucosal inflammation, food impaction and discomfort.
Costa15 proposed a way to prevent this, he suggested us to place the TADs in
the mobile mucosa, that is, cover the screw head beneath the mucosa by
incorporating a transmucosal attachment so that orthodontic attachment lay
superior to the soft tissues and this attachment acts as an extension for force
application.
To overcome the above disadvantage of soft tissue coverage, Yi-Jyun Chen80 proposed to use TADs with a longer smooth neck design in the
presence of thicker soft tissue.
Sebastian and Terri3, called the movable mucosa above the
mucogingival junction as a “zone of opportunity.” Mucosa becomes firmly
no mobility, relative to underlying bone, so movable mucosa is an ideal site
for Inter-radicular miniimplant or miniscrew insertion.
Various studies (by Baumgaertel3, Motoyoshi55, Wilmes78,
Kuroda36) state that the cortical bone thickness increases in the apical
direction and the movable mucosa apical to the mucogingival junction offers
TAD sites with more space between the conical dental roots because they
usually diverge in an apical direction.
Chris chang13 conducted a study to compare six-month failure rates
for infra-zygomatic crest (IZC) bone screws inserted into movable mucosa
(MM) or attached gingiva (AG), with the hypothesis that MM would have a
higher failure rate than AG. The study concluded that there was no statistically
significant difference for sites covered with movable mucosa or attached
gingiva.
INFRAZYGOMATIC CREST:
Of all extra-alveolar sites, our study of interest is the infra-zygomatic
region. The infrazygomatic (IZ) crest is an extra-alveolar placement site in the
maxilla for orthodontic miniscrews or miniplates. It has been successfully
used to provide skeletal anchorage for maxillary canine retraction, anterior
retraction, en-masse anterior retraction, and intrusion of the maxillary
The infrazygomatic crest space is a rectangular osseous volume that is
limited by certain distinct borders. The buccal border of the infrazygomatic
crest space is represented by the course of the outer surface of the zygomatic
process of the maxilla and the most apical regions of the alveolar process. The
medial border consist of the lingual root of the maxillary first molar, the
lingual surface of the alveolar process and the surfaces of the nasal cavity.
Anatomically, the IZ crest is a thick pillar of cortical bone along the
zygomatic process of the maxilla. Clinically, it is a palpable bony ridge
running along the curvature between the alveolar and zygomatic processes of
the maxilla. Studies of Kanomi33 and Schnelle69 concluded that it is between
the maxillary second premolar and first molar, in younger subjects and is
above the maxillary first molar in adults.
It is recommended to insert miniscrews at a height beyond the root
apex, where interseptal bone is thicker and there is less chance of root injury.
Eric Liou40 in his study stated that the IZ crest above the maxillary first
molar, was significantly thicker than the lateral wall of the maxillary sinus.
The IZ crest is usually used as an insertion site for orthodontic skeletal
anchorage, because of its thicker bone. He also stated that the IZ crest has 2
cortical plates—the buccal cortical plate and the sinus floor. This is
anatomically advantageous as it allows for bicortical fixation and also offers a
According to Misch and Kircos 50 ,the bone density of the IZ crest is
greater than that of the maxillary alveolar ridge, Where the bone present were
mostly porous cortical bone and dense trabecular bone rather than porous
cortical and trabecular bone present in the alveolar region .(D2/D3 vs D3/D4).
. Structurally, the maxilla has relatively thin cortices that are
interconnected by a network of trabeculae.
Javed 31 in his literature review stated that clinically, a poor degree of
bone mineralization or limited bone resistance is observed in bones with poor
densities, which are often referred to as “soft bones”. It has been shown that
achieving optimum primary stability in soft bones is difficult and is also
related to a higher implant failure rate for the implants placed in such bones.
In an experimental study conducted by Niimi 57, he demonstrated the
removal torque for implants in the fibula, iliac crest, and scapula of cadavers
were related to cortical bone thickness, not total bone thickness and also the
primary implant stability depends largely upon cortical bone thickness.
This was substanciated by another study by Miyamoto, demonstrated that dental implant stability in humans were greatly influenced by cortical
bone thickness. Bone thickness being an important factor, Deguchi19 said
that a thicker bone allows a greater miniscrew biting depth, more osseous
Clinical significance of these studies state that interdental buccal
cortical bone thickness appears to vary according to distinctive patterns.
Studies by Deguchi19, said that shortcomings in cortical bone thickness can be
compensated for by variations of mini-implant angulation or perhaps implant
design (cylindrical vs conical shank).
It is not primarily the ratio of cortical bone to trabecular bone that
influences implant stability, but it is the absolute amount of dense cortical
bone. Holmes, in his investigations, showed that cortical bone has a higher modulus of elasticity than trabecular bone. It is stronger and more resistant to
deformation, and will also bear more load in clinical situations than trabecular
bone. Studies by Roze64, states that the trabecular bone structure seems to play
a minimal role in primary fixation but is certainly of considerable importance
for peri-implant bone healing.
Failure of implants stability was directly associated with the thinner
cortical bone in the posterior regions, when used as orthodontic anchorage.
this was poved by Miyawaki 52.
Hard-tissue quality and quantity affect the success rates of TADs.
Huang27, stated that, TAD insertion loading strain values may exceed the
Recently Sang hoon lee, concluded that increase in cortical bone thickness correlated with the increase in bone density and the primary implant
stability which correlated with the previous studies.
In order to place TADs it is important to assess the quality and quantity
of bone in the proposed site of interest. This is when CT and CBCT has an
important role to play, as this allows us to visualise the area of interest in all 3
planes of space, guiding us in the safe placement of TADs . While, Computed
Tomography (CT) has a definite edge over Cone Beam Computed
Tomography (CBCT) in terms of better assessment of bone, qualitatively and
quantitatively, CBCT, on the other hand, paints sufficient picture of the
dento-alveolar segments three dimensionally with much lesser radiation exposure
and cost.
Ribeiro63 in his study concluded that CBCT is a ground-breaking
diagnostic method in dentistry as it provides high dimensional accuracy of the
facial structures and a reliable method for quantifying the behaviour of the
maxillary halves, dental tipping, bone formation at the suture in all the three
planes of space, as well as alveolar bone resorption and other consequences of
palatal expansion.
Shilpa Kalra32 substantiated that, even though two dimensional intra