Evidence Report 44
February 2012
Developing Occupational Skills
Profiles for the UK: A Feasibility
Study
Andy Dickerson
University of Sheffield
Rob Wilson
University of Warwick
Genna Kik
Senior Manager
Debra Dhillon
Manager
UK Commission for Employment and Skills
Foreword
The UK Commission for Employment and Skills is a social partnership, led by Commissioners from large and small employers, trade unions and the voluntary sector. Our mission is to raise skill levels to help drive enterprise, create more and better jobs and promote economic growth. Our strategic objectives are to:
• Provide outstanding labour market intelligence which helps businesses and people make the best choices for them;
• Work with businesses to develop the best market solutions which leverage greater investment in skills;
• Maximise the impact of employment and skills policies and employer behaviour to support jobs and growth and secure an internationally competitive skills base.
These strategic objectives are supported by a research programme that provides a robust evidence base for our insights and actions and which draws on good practice and the most innovative thinking. The research programme is underpinned by a number of core principles including the importance of: ensuring ‘relevance’ to our most pressing strategic priorities; ‘salience’ and effectively translating and sharing the key insights we find;
international benchmarking and drawing insights from good practice abroad; high
quality analysis which is leading edge, robust and action orientated; being responsive to
immediate needs as well as taking a longer term perspective. We also work closely with key partners to ensure a co-ordinated approach to research.
This current study, which was undertaken by Andy Dickerson at the University of Sheffield and Rob Wilson at the University of Warwick, documents the development and feasibility of a new methodology to improve occupational skills profiles at the Standard Occupational Classification (SOC) unit group (4-digit) level for the UK.
By matching US occupations to UK occupations at a very detailed level, the authors have been able to exploit information contained in the US Occupational Information Network (O*NET) system for US occupations, to generate occupational skills profiles for the UK.
Sharing the findings of our research and engaging with our audience is important to further develop the evidence on which we base our work. Evidence Reports are our chief means of reporting our detailed analytical work. Each Evidence Report is accompanied by an executive summary. All of our outputs can be accessed on the UK Commission’s website at www.ukces.org.uk
But these outputs are only the beginning of the process and we will be continually looking for mechanisms to share our findings, debate the issues they raise and extend their reach and impact.
We hope you find this report useful and informative. If you would like to provide any feedback or comments, or have any queries please e-mail [email protected], quoting the report title or series number.
Lesley Giles
Deputy Director
Table of Contents
Executive Summary ... i
1
Introduction ... 1
2
Background and Methodology ... 3
Chapter Summary ... 3
2.1 The Measurement of Skills ... 3
2.2 The O*NET System ... 7
2.3 Methodology ... 11
2.3.1 Stage 1: Matching O*NET to UK SOC ... 12
2.3.2 Stage 2: Assigning Job Skills and Abilities to UK Occupations ... 12
2.3.3 Stage 3: Summarising Job Skills and Abilities for UK Occupations ... 13
2.3.4 Stage 4: Assessment and Validation ... 14
3
Matching O*NET SOC to UK SOC ... 15
Chapter Summary ... 15
3.1 The UK and US Standard Occupatioanl Classifications ... 15
3.2 CASCOT ... 16
3.3 Matching ... 20
3.4 Outcomes ... 21
4
Assigning Job Skills and Abilities to UK Occupations ... 25
Chapter Summary ... 25
4.1 Weighting Schemes ... 25
4.2 An Illustrative Example ... 26
4.3 Comparison of Weights ... 32
5
Summarising Job Skills and Abilities for UK Occupations ... 36
Chapter Summary ... 36
5.1 Selection of Descriptiors from O*NET ... 36
5.2 Creating a Taxonomy of Job Skills for the UK ... 37
5.2.1 Data-People-Things ... 37
5.2.2 STEM Skills ... 46
5.3 Skills Profiles ... 49
6
Assessment and Validation ... 50
Chapter Summary ... 50
6.1 Assessment ... 50
6.2.1 Required levels of education, experience and training profiles ... 51
6.2.2 Sensitivity and robustness ... 56
6.3 Further work ... 60
7
Conclusions ... 62
Annex A: The O*NET System ... 64
A.1 Overview ... 64
A.2 Content ... 65
A.3 Updating ... 66
A.4 Dissemination ... 66
A.5 Tools ... 67
A.6 Users and Uses ... 68
A.7 New & Emerging and ‘Green’ Jobs ... 69
A.8 Monitoring of Use and Evaluation ... 70
Annex B: UK SOC2010 Occupational Classification... 72
Annex C: US SOC and O*NET-SOC Occupational Classifications ... 75
List of Figures and Tables
Box 1 Scoring in CASCOT ... 17
Box B1 UK SOC2010 Classification ... 72
[image:7.595.75.522.77.754.2]Box C1 US-SOC2009 and O*NET-SOC2009 ... 75
Figure 1 O*NET Reading Comprehension Rating Scale ... 10
Figure 2 CASCOT Classification of 'Economist' to SOC2010 ... 18
Figure 3 CASCOT Classification of 'Builder' to SOC2010 ... 19
Figure 4 Weighting Schemes Based on Scores ... 27
Figure 5 Weighting Schemes Based on Counts ... 28
Figure 6 Comparison of Weighting Schemes ... 31
Figure 7 Distribution of O*NET-SOC Occupation Matches ... 33
Figure 8 Data-People-Things Taxonomy – 4-digit SOC2010 ... 43
Figure 9 Averaging Data-People-Things Taxonomy to SOC2010 Sub-Major Groups ... 44
Figure 10 Averaging Data-People-Things Taxonomy to SOC2010 Major Groups ... 45
Figure 11 Averaging STEM skills to SOC2010 Unit, Sub-Major and Major Groups ... 48
Figure 12 Comparing Required Education & Training Levels at SOC Major Group Level .. ... 54
Figure 13 Standardised Education & Training Levels at SOC Major Group Level... 55
Figure A1 The O*NET Content Model ... 65
Figure C1 Summary of the O*NET Taxonomy ... 77
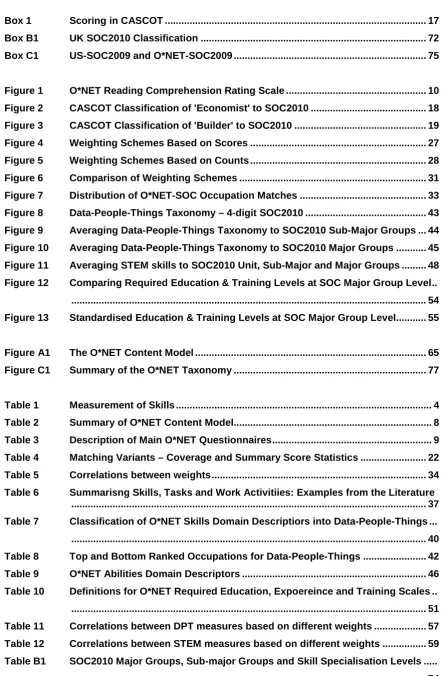
Table 1 Measurement of Skills ... 4
Table 2 Summary of O*NET Content Model... 8
Table 3 Description of Main O*NET Questionnaires ... 9
Table 4 Matching Variants – Coverage and Summary Score Statistics ... 22
Table 5 Correlations between weights ... 34
Table 6 Summarisng Skills, Tasks and Work Activitiies: Examples from the Literature ... 37
Table 7 Classification of O*NET Skills Domain Descriptiors into Data-People-Things ... ... 40
Table 8 Top and Bottom Ranked Occupations for Data-People-Things ... 42
Table 9 O*NET Abilities Domain Descriptors ... 46
Table 10 Definitions for O*NET Required Education, Expoereince and Training Scales .. ... 51
Table 11 Correlations between DPT measures based on different weights ... 57
Table 12 Correlations between STEM measures based on different weights ... 59
Executive Summary
Skills are a major policy priority both nationally and internationally. Yet we only have very imperfect measures of the skills available and in use in employment in the UK today. This report explores the feasibility of the development of a new and comprehensive set of detailed, multi-dimensional occupational skills profiles for the UK which describe the skills required by employers and used by individuals in the modern workplace. These occupational skills profiles can have a myriad of potential uses and users, including providing a much richer and deeper understanding of the changing patterns of the demand for skills in the UK, and informing individuals and those who advise them on the skills that are useful in employment today.
Skills can be measured in a variety of different ways. The two most commonly employed measures are: (i) the qualifications that individuals have previously acquired; and (ii) the occupational classification of the jobs that they do. These both have the considerable virtue of being relatively simple to measure, but are poor proxies for the actual skills required by employers and used by individuals. Indeed, when asked about skills and skills needs, employers tend to focus on aspects of individuals and jobs other than their qualifications or occupations. These other aspects have been variously termed generic, key or core skills and attributes. Examples include communication, problem solving, numeracy and literacy skills. They are rather more difficult to measure precisely, although considerable progress has been made in recent years in the UK Skills Surveys using questionnaires focussed on the nature of the tasks that individuals perform in their jobs1
In contrast to the comparative lack of such information for the UK, the US-based Occupational Information Network (O*NET) system provides almost 250 measures of skills, abilities, work activities, training, work context and job characteristics for each of around 1,000 different US occupations (based on a modified version of the US Standard Occupational Classification), with information gathered from both job incumbents through standardised survey questionnaires, as well as assessments by professional job analysts. This information is also linked to information on current employment levels, rates of pay and future employment prospects. The O*NET system replaced the long-established Dictionary of Occupational Titles (DOT), with the first complete version of O*NET becoming available in 2008.
. However, the Skills Surveys are unable to provide a very detailed or comprehensive picture, mainly due to their limited scope and small sample size.
Ideally we would like to have an O*NET-type system for the UK which could provide a broad set of descriptors of the skills that people utilise in their jobs. We could then use the trends in skills to inform public policy about the skills that are utilised and rewarded in employment in the UK today. This would provide a much richer description than our current measures of skills such as qualifications or simply the fixed and uni-dimensional hierarchy of the Standard Occupational Classification (SOC). However, the costs of developing such as system would be considerable, both financially and in terms of time. As an alternative therefore, this project investigates the feasibility of developing a mapping between the US SOC and UK SOC taxonomies in order to exploit the information that is already collected for the US O*NET system.
The primary objective of this project is therefore to construct a systematic ‘mapping’ between the occupational classification utilised in O*NET and the UK Standard Occupational Classification (SOC). We then develop a methodology for assigning the detailed content of the O*NET system to the UK SOC in order that profiles of the skills and other job characteristics used in all UK occupations in the UK SOC can be developed.
Number Facility (from the abilities domain) and Mathematics, Science, Technology Design, and Programming (from the skills domain). The final stage of the project (Chapter 6) undertakes some evaluation and validation of the methodology in order to assess the quality and robustness of the resulting occupational skills profiles.
Our findings suggest that it is indeed possible to create such a mapping between US and UK occupational taxonomies, and thus to be able to assign the job tasks, skills and other content of the US O*NET system to the matched UK occupations. This mapping appears to be quite robust to the methodological approach employed. When used to generate occupational skills profiles for data-people-things and for STEM skills at the 4-digit (unit group) level of SOC2010, the resulting occupational profiles appear to be sensible and reasonable and conform to our prior expectations. Moreover, when we use the mapping to derive measures of required qualifications and training time and compare these with similar measures taken from the 2006 Skill Survey (Felstead et al, 2007), the correspondence between the two different sources are very high – at least at the SOC Major Group level – giving us further confidence in the validity and robustness of the methodology we have developed.
Exploiting the mapping that we develop between O*NET SOC and UK SOC enables the multi-dimensional O*NET system to be used to generate a comprehensive database of occupational skills profiles for the UK, providing a much more detailed depiction of skills utilisation, and changes in utilisation, than is currently available for the UK. This is crucial if we are to really develop an understanding of skill utilisation and changing skill needs in the UK. The profiles are likely to be of considerable interest to agencies which have an interest in skills and their importance as well as their impact for individual labour market outcomes, and also for macro-economic performance.
Additional potential uses of the methodology developed in this report include:
• An assessment of trends in skills demand (as recorded by their changing utilisation in employment), and estimating future skills demand.
• Supplying useful information to Information, Advice and Guidance (IAG) practitioners – and also to individuals – on the types of skills that are necessary for, and useful in employment today, and are likely to be of importance and value in the future in terms of labour market outcomes.
• Estimating the value of skills in employment.
• Extending the information available to the Migration Advisory Committee (MAC) on the measurement of skills, and on the specific skills that are in shortage
1
Introduction
This project examines the feasibility of constructing a detailed set of occupationally-based ‘profiles’ describing the many different skills that are used in employment in the UK. These occupational skills profiles are intended to be multi-dimensional and therefore would provide a much richer description and measurement of skill demand and skill utilisation than is possible using the existing methods of measuring skills that are commonly employed in UK research and policy. We make use of the most detailed and comprehensive assessment of skills used in employment that exists as provided by the US Occupational Information Network (O*NET) system. O*NET includes self-reported assessments by job incumbents based on questionnaire surveys, as well as professional assessments by job evaluation analysts, across 239 different dimensions2
The primary task in this project is thus to construct a systematic ‘mapping’ between the US O*NET and UK occupational classifications
, including qualifications required, practical and technical skills, and ‘soft skills’ such as communication skills. For two-thirds of the dimensions, both the level and the intensity of their use are recorded. The O*NET system gathers this information for almost 1,000 separate occupations. By matching US jobs to comparable UK jobs in a systematic and transparent manner, we adapt the O*NET skills descriptors to jobs (i.e. occupations) in the UK.
3
There are four main stages to the project:
, and then to assign the skills measures and other content of the US O*NET system to the matched UK occupations.
•
Stage 1: Matching between the O*NET occupational classification and the UK SOC;•
Stage 2: Assigning job skills and abilities provided within O*NET to UK occupationsbased on weighting and aggregating according to the quality of the match;
•
Stage 3: Summarising job skills and abilities to produce useful taxonomies for UKoccupations;
•
Stage 4: Assessing and validating the matching and assignment by makingcomparisons with other measures of job skills and activities.
The remainder of this report is structured as follows. Chapter 2 describes the background and methodology that we use, including a brief outline of the O*NET system. Chapters 3, 4, 5 and 6 report the details from each of the four stages of the project as outlined above.
2
These ‘dimensions’ include abilities, skills, work activities, context and styles, tasks, knowledge, education requirements etc.
3
2
Background and Methodology
Chapter Summary
This Chapter describes the various measures of skills demand and utilisation that are in current usage in research and policy, and briefly describes the US O*NET system that forms the basis of the measures that are developed in this project.
The methodology to be employed, and the four distinctive stages of the project which form the remaining substantive Chapters of the report are then outlined.
2.1
The Measurement of Skills
The importance of skills in modern economies and in economic policy discourse is widely acknowledged. Changing skills are important for example at both micro – individual – level for the distribution of earnings, and at the macro level, for explanations of productivity and growth – especially of the endogenous growth kind. Despite the fundamental importance, both theoretically and practically, of skills to the discourse surrounding the knowledge economy, procedures for measuring skills are comparatively under-developed in the UK. But much more effort has been devoted to this issue in the US, with their O*NET system, which has seen over 50 years of investment and development4
We can identify (at least) 6 distinct ways of defining and measuring skills in contemporary research. These are summarised in Table 1. There are a number of advantages and disadvantages associated with each of the different conceptualisations of skills that are commonly employed as listed in the table. Skills are multi-dimensional, socially constructed, intangible and often unobservable, and each of the different measures of skills can be argued to have some relative merits and demerits associated with them.
. This project explores the potential for the O*NET system to be exploited in a UK context.
4
Table 1: Measurement of Skills
Method Advantages Disadvantages
1. Qualifications and/or
educational attainment
Objective
Long-term trends available
Qualifications only have a loose link with job skills and thereby economic performance. Not all skills will be utilised in the labour market due to mismatch. And education may be a signal of ability rather than as a source of skills supply. Acquisition and depreciation of skills continues after education is completed. Learning at work important for acquisition of new skills and for updating existing skills. Hence the relationship between education and skills, and thereby economic performance, is complex – certainly measuring skills by education qualifications alone will be insufficient. International comparisons of attainment also difficult.
2. Education length
Objective
Long-term trends available Internationally comparable
Variable quality of education – 1 year in country A is not the same as 1 year in country B
Many of the criticisms of the use of qualifications in measuring skills can be similarly applied to the length of education. i.e. there is only a loose link between education and job skills.
3. Occupation Easily available from Labour Force Surveys and/or censuses Internationally comparable (sometimes)
Occupational classifications have a better link with job skills, but even so, the hierarchy of occupations in the SOC for example is contestable, uncertain and changing. Moreover, over time, skills change within occupations.
4. Tests Objective
International comparisons possible
Formal assessments of skills through tests can only ever measure a limited range of skills (literacy and numeracy are typical) and are comparatively rate because of the costs of administering such testing.
There has been criticism of the international comparability of universal testing even when it has been treated very carefully by researchers.
5. Self-assessment
Wide range of skills Subjective, and so used very rarely. However, the 5th interview wave of the National Child Development Survey (NCDS) does record such measures. Major problem is that skill self-assessment is associated with self-esteem. 6. Job
requirements
Wide range of skills
Intimately connected with job
Job requirement measures increasingly being used. Obviously, job skill could differ from person skill (mismatch), and is subjective and will only measure skills of those in employment. But can use existing commercial job analysis data, as well as bespoke surveys. Examples include: O*NET (Occupational Information Network) in the US; German BIBB/IAB- and BIBB/BAuA Surveys on Qualifications and Working Conditions in Germany; UK Skills Surveys. These are surveys which ask individuals about the generic tasks and skills they use in their jobs and use those to infer the skills that they have. Of course, mismatch and underutilisation are still a problem, but they have permitted a much richer description of individuals’ skills, including soft/generic skills simply not captured by the other measures.
In addition to the inherent difficulties associated with measuring skills, different disciplines have somewhat different conceptions of ‘skill’. However, within economics at least, skill is a quite general concept. It can be considered as a characteristic that can be acquired, and that enables individuals to produce valued services in work – i.e. is an element of human capital (and therefore is conceptually the same as health, since both can be invested in, and enhance the stream of revenues that can be earned). It is also conceptually equivalent to behavioural traits – such as honesty and motivation – since these can also be ‘acquired’ and are productive in employment.
Ideally we would like to have objective, internationally-comparable measures of skills. Of the different measures and conceptualisation of skills in Table 1, the most commonly utilised are the qualifications that individuals have acquired (Row 1) and the occupations of the jobs that they undertake (Row 3). These both have the considerable virtue of being relatively simple to measure and afford some international comparability, particularly when international classification systems are employed such as ISCED which is maintained by UNESCO,5 and ISCO which is compiled by the ILO6
The skills subsequently gained while in employment by learning-by-doing, through formal and informal on-the-job training, or in any subsequent off-the-job training and then utilised in employment are those that are of primary interest for individuals and employers, and for public policy. Individuals seeking to move jobs, firms seeking new employees, agencies responsible for assisting people back into work, training providers, HR managers and policy makers responsible for identifying skills shortages, trends and future requirements all require measure of the skills that are used, valued and rewarded in employment.. Moreover, when asked about skill needs, employers increasingly focus not on qualifications, but on other aspects which have been variously termed key, generic, soft, or core skills. Examples include: numeracy and literacy; communication skills; team-working; problem solving etc. Qualifications are, therefore, at best, only a poor proxy for the skills that individuals have acquired or utilise in their jobs. They are also a weak measure of the attributes that individuals possess that are rewarded in the labour market.
. However, qualifications in particular can be regarded as a poor measure of skills used in employment: they are typically gained before individuals enter the labour market, and any skills that are specifically acquired in the process of gaining any particular qualification soon depreciate. Rather, qualifications arguably provide a means of entering particular employments or employment levels.
Occupations arguably provide a more meaningful summary of the skills that individuals are using in employment, particularly where the occupational classification is hierarchical so that higher occupational levels can be associated with higher levels of skills. However,
it still fails to record the actual skills that are being utilised, and nor does it effectively recognise that jobs are typically bundles of skills (Sattinger, 1979, 1993) and thus the skills being utilised in any job cannot be captured by a uni-dimensional indicator such as the SOC code7
More recently, the advantages of the so-called ‘job requirements’ approach (Table 1, Row 6) have found increasing favour. These measure skills that are being used by individuals in their jobs by their (self-reported) answers to questions regarding the degree (and sometimes intensity) to which their jobs require them to perform particular tasks. Examples include the UK Skills Surveys (Felstead et al, 2007). In these surveys, individuals were asked to rank on a 5-point Likert scale (running from ‘essential’ to ‘not at all important’) how important a range of 35 tasks were in their jobs. For example, respondents were asked:
. And, of course, even within occupations, skills can differ – for example, according to sector or organisation size.
In your job, how important is … … paying close attention to detail? … dealing with people?
… instructing, training or teaching people, individually or in groups? … making speeches or presentations?
… persuading or influencing others? … selling a product or service?
… counselling, advising or caring for customers or clients? etc
However, given the relatively small scale of the Skills Surveys (the 2001 and 2006 surveys comprise approximately 4,500 and 8,000 individuals in each survey respectively), it is not possible to use the information to provide a comprehensive assessment of the skills utilised in all occupations in the UK at other than a quite aggregated level. Thus the Skills Surveys are unable to capture much of the heterogeneity within and between jobs. Moreover, the range of job skills recorded is limited to the 35 dimensions captured by the particular job task questions listed above, (together with questions on the level and intensity of computer use).
In contrast, the US has long devoted considerable resources to measuring and recording the skills used in employment in America. Starting with the first edition of the Dictionary of Occupational Titles (DOT) published in 1939, this has evolved considerably over time. O*NET has recently replaced the DOT, and the first full version of this new system was
7
published in June 2008. A brief outline is provided in the next sub-section while further details are in Annex A.
2.2
The O*NET System
8The US O*NET system is the main source of occupational competency information in the US. It utilises a modified version of the US SOC to record information across 6 different ’domains’ as outlined in Table 2 for around 1,000 different occupations. It has been almost 20 years in development as a replacement to the DOT system, with the first complete version becoming available in June 2008 as noted above. Much of the information in the O*NET ‘content model’ is gathered from self-reported assessments by job incumbents based on standardised questionnaire surveys, supplemented by professional assessments by job evaluation analysts, and it is this content model that is the focus here. Additional information on pay, and on recent employment trends and future projections from the Bureau of Labor Statistics (BLS) is also included in the O*NET system.
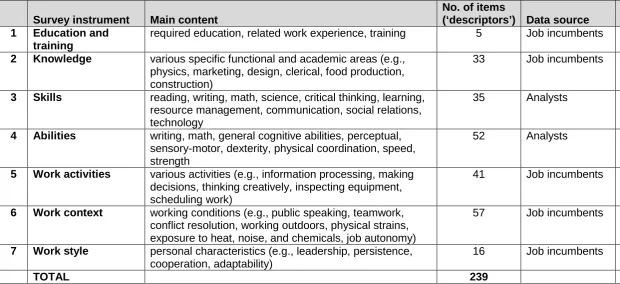
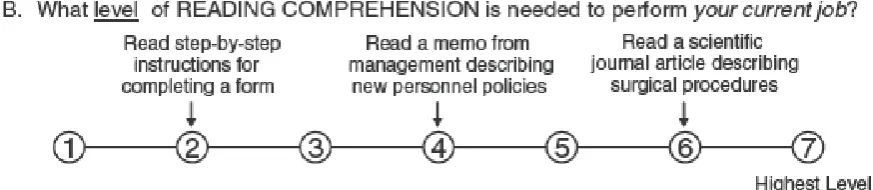
In total, 239 different dimensions or ‘descriptors’ of skills and job characteristics including: qualifications required; practical and technical skills; a wide range of soft skills such as communication skills, stamina etc; as well as details of the tasks involved in the job (see Table 3). For the four domains of Knowledge, Skills, Abilities and Work activities, both the ‘Importance’ and ‘Level’ of each skill or characteristic being measured is recorded. As an example, Figure 1 presents the rating scales for the ‘Reading Comprehension’ skill. There has been some criticism of the level scale and the ‘anchors’ that are used to define the scale points – see Handel (2010) for example – and the fact that importance and level responses are typically highly correlated. However, despite this criticism, clearly the number and range of items recorded are extensive. Indeed, part of the process of defining occupational skill profiles for the UK is to reduce the number of dimensions to a more limited set of descriptors in a meaningful and appropriate manner.
8
Table 2: Summary of O*NET Content Model
DOMAIN ELEMENT DESCRIPTION
1 Worker Characteristics
1 A Abilities Enduring attributes of the individual that influence performance 1 B Interests Preferences for work environments and outcomes
1 C Work Styles Personal characteristics that can affect how well someone performs a job
2 Worker Requirements
2 A Basic Skills Developed capacities that facilitate learning or the more rapid acquisition of knowledge 2 B Cross-Functional Skills Developed capacities that facilitate performance of activities that occur across jobs 2 C Knowledge Organized sets of principles and facts applying in general domains
2 D Education Prior educational experience required to perform in a job
3 Experience Requirements
3 A Experience and Training If someone were being hired to perform this job, how much would be required?
3 B Basic Skills - Entry Requirement Entry requirement for developed capacities that facilitate learning or the more rapid acquisition of knowledge
3 C Cross-Functional Skills - Entry Requirement Entry requirement for developed capacities that facilitate performance of activities that occur across jobs 3 D Licensing Licenses, certificates, or registrations that are awarded to show that a job holder has gained certain
skills. This includes requirements for obtaining these credentials, and the organization or agency requiring their possession
4 Occupational Requirements
4 A Generalized Work Activities General types of job behaviors occurring on multiple jobs
4 B Organizational Context Characteristics of the organization that influence how people do their work 4 C Work Context Physical and social factors that influence the nature of work
4 D Detailed Work Activities Detailed types of job behaviors occurring on multiple jobs
5 Occupation-Specific Information
5 A Tasks Occupation-Specific Tasks
5 B Tools and Technology Machines, equipment, tools, software, and information technology workers may use for optimal functioning in a high performance workplace
6 Workforce Characteristics
6 A Labor Market Information Labor Market Information 6 B Occupational Outlook Occupational Outlook
Table 3: Description of Main O*NET Questionnaires
Survey instrument Main content
No. of items
(‘descriptors’) Data source
Information recorded
1 Education and
training
required education, related work experience, training 5 Job incumbents Levels
2 Knowledge various specific functional and academic areas (e.g.,
physics, marketing, design, clerical, food production, construction)
33 Job incumbents Importance and levels
3 Skills reading, writing, math, science, critical thinking, learning,
resource management, communication, social relations, technology
35 Analysts Importance and levels
4 Abilities writing, math, general cognitive abilities, perceptual,
sensory-motor, dexterity, physical coordination, speed, strength
52 Analysts Importance and levels
5 Work activities various activities (e.g., information processing, making
decisions, thinking creatively, inspecting equipment, scheduling work)
41 Job incumbents Importance and levels
6 Work context working conditions (e.g., public speaking, teamwork,
conflict resolution, working outdoors, physical strains, exposure to heat, noise, and chemicals, job autonomy)
57 Job incumbents Levels
7 Work style personal characteristics (e.g., leadership, persistence,
cooperation, adaptability)
16 Job incumbents Importance
TOTAL 239
Figure 1: O*NET Reading Comprehension Rating Scale
Source: Tippins and Hilton (2010), p.75.
The questionnaires are administered by post by the US Bureau of Labour Statistics and, in order to avoid survey fatigue, job incumbents are only asked to complete a random selection of the questionnaires listed in Table 3. In addition, all respondents provide some background demographic information (which is not released) and are also asked to indicate from a wide range of occupation-specific tasks those that apply to their particular job. Sample sizes are not easy to identify from the information made available since only occupation means rather than the individual micro-data data are publicly released, but one estimate is that there is an average of 31,000 responses for each of the 239 descriptors gathered from around 125,000 returned questionnaires, thus representing an average of just under 40 respondents per descriptor for each of the separate occupations in the O*NET system (Handel, 2010). One of the main strengths of the O*NET design is that it is being updated on a 5-year rolling basis so that changes in skills utilisation within
occupations will be able to be discerned. A completely new set of descriptors for all occupations will therefore be available by 2013.
The O*NET system provides an enormous amount of information on skills used in occupations. National Occupational Standards (NOS) in the UK, and similar systems at a pan-European level, provide some of the same information9,10
9
The German system – the BIBB/IAB- and BIBB/BAuA Surveys on Qualifications and Working Conditions in Germany is particularly notable and covers much of the same ground as the US O*NET system.
do not form part of an integrated labour market information (LMI) system in the same way that O*NET does, and O*NET goes well beyond NOS by gathering information directly and indirectly from employees themselves, rather than simply listing the skills, knowledge and understanding that employers deem are required to perform competently in any given occupation. Furthermore, O*NET provides a wealth of information which is not available in the UK. This project develops a detailed mapping from US to UK occupational categories and thereby enables us to exploit the information in O*NET for the first time.
2.3
Methodology
Ideally we would like to have an O*NET-type system for the UK – that is a broad set of descriptors of the skills that people utilise in their jobs. We could then use the trends in skills use to inform public policy about the skills that are needed in employment (and rewarded in employment) in the UK today. This would provide a much richer description than our current measures of skills such as qualifications or simply the fixed and uni-dimensional hierarchy of the Standard Occupational Classification (SOC)11
In the absence of such a system specifically for the UK, our ambition in this project is to adapt the various measures of skills in the US O*NET content model to the UK SOC in order to provide the same level of detail in terms of both the occupations that can be separately identified and described, and the range of skills descriptors that are available. In essence, we combine the advantages of the occupational measures of skills (Table 1, Row 3) with those of the job-requirement approach (Table 1, Row 6), by exploiting the considerable effort and investment that the US has made in the development of their O*NET system. Job-requirement measures provide us with a better indicator of the demand for skills than qualifications or occupational classifications. Thus we use the skills dimensions that are recorded in the O*NET system (or at least a subset of them) and apply these to occupations in the UK. Assuming that sensible matches can be obtained between occupations, these can then be used to provide a set of descriptors of the skills used in jobs (occupations) the UK.
.
While there are many differences in occupational classification between the UK and the US, there are also many similarities. The review in Wilson (2009) suggests that, although O*NET has been designed specifically for the US, there is considerable potential for it to be exploited in other countries. Many of the characteristics of jobs are common across countries. Indeed, the O*NET system has already been applied (with only minimal modification) to a number of countries outside the US including Australia, Czech Republic, New Zealand, China and Hong Kong. For example, in work currently being
10
O*NET descriptors have also been shown to have application outside the US (Taylor et al, 2008). 11
undertaken for Cedefop, EPC at Charles University Prague are working with Warwick IER to explore the potential for exploiting O*NET at a pan-European level (Koucký et al, 2010; Wilson, 2010).
Our project progresses in number of distinct phases. These are briefly outlined in the following four sub-sections:
2.3.1 Stage 1: Matching
The first stage is to provide a match between the occupational taxonomy in O*NET to that of the UK SOC. This has been undertaken using specialist software, originally developed by Warwick IER, called CASCOT (Computer Assisted Structured COding Tool)12
2.3.2 Stage 2: Assigning Job Skills and Abilities to UK Occupations
. As part of our project, we have separately developed a classification database or ‘dictionary’ specifically for O*NET, and this has potential to be developed further in the future. CASCOT enables us to produce a systematic mapping between the jobs in the US and jobs in the UK, with a matrix of scores (between 0 and 100) which reflect the quality of the match. Further details are in Chapter 3 of this report.
Secondly, we have accessed the O*NET content model database which describes the anatomy of every occupation identified in the O*NET system. The data includes information on the distinctive characteristics of each occupation, including the knowledge, skills and abilities required, and the activities and tasks performed. These are the so-called ‘descriptors’ which are grouped into a number of ‘domains’ according to how the data are collated. We are utilising Version 15.0 of the O*NET database which was released in June 2010 to researchers. A key advantage of using Version 15.0 is that the skills domain measures for over 800 occupations were all updated by job analysts. Since the measures of skills was the area where job incumbents were argued to have found most difficulty in assessing their relative levels, this domain is now exclusively covered by professional job analysts’ responses. Using Version 15.0 of the database will mean that we have access to their comprehensive and completely updated set of measures on skills. The skills domain is also one of the four domains in which both importance and level of each descriptor activity is recorded.
Given the matching matrix constructed in the first stage, we can then assign the skills and other descriptors in the O*NET system to UK occupations. We weight the O*NET descriptors, with weights dependent on: (i) the quality of the match as reflected in the CASCOT scores; and (ii) on the relative ‘importance’ of the occupation (based on
12
occupational employment shares). This weighting thus takes into account how close the match is between any particular pair of O*NET and UK SOC occupations, but also the relative employment of the O*NET occupation in question. Thus, close matches with occupations which account for a larger number of workers are therefore given greater weight than close matches with minor occupations (in terms of employment), and both are given greater weight than weaker matches with the same occupations.
2.3.3 Stage 3: Summarising Job Skills and Abilities for UK Occupations
Given there are 239 dimensions or descriptors of skills and job characteristics recorded on the O*NET system, it is clearly important to select and summarise them in some way in order to provide useful information for the UK. Our primary focus in this project will be on just the skills and abilities domains, but this still yields (35+52=) 87 descriptors (each with both level and importance reported for each descriptor) for each O*NET occupation13Having selected a set of dimensions to focus upon, and an aggregation method for those dimensions, this will enable us to characterise all UK occupations in terms of a set of skills and other characteristics. These will form our occupational skills profiles.
. Statistical methods such as factor analysis (see, for example, Kim and Mueller, 1978) or cluster analysis (see, for example, Everitt, 1993) can be used to combine the descriptors, or particular skills of interest could be selected from the myriad of those available. Examples of such aggregations for skills used previously and which have been found to be useful include that introduced by the Dictionary of Occupational Titles (DOT) which classified skills broadly into ‘data’, ‘people’ and ‘things’. This 3-way classification has been used repeatedly in the literature e.g. Autor et al (2003), and Autor and Handel (2009) (with more descriptive labels of ‘cognitive skills’, ‘interpersonal skills’ and ‘physical job tasks’). A similar approach is used by Abraham and Spletzer (2009) to define ‘analytic skills’, ‘interpersonal skills’ and ‘physical skills’ from just the 41 work activities measures by selecting a limited subset of descriptors amongst these.
2.3.4 Stage 4: Assessment and Validation
The final stage of the project is a validation exercise to assess the quality and robustness of the occupational skills profiles, and to use the profiles to illustrate some different ways in which such information can extend our understanding of skills, their importance, and their utilisation.
13
3
Matching O*NET SOC to UK SOC
Chapter Summary
This Chapter first describes the occupational hierarchies in the O*NET system and in the UK SOC, and then explains how the mapping between the two classifications has been undertaken.
An appropriately modified version of the specialist software programme CASCOT has been used to provide a match between the job/occupational taxonomy in O*NET and that of the UK SOC. We report on the ‘completeness’ or coverage of the mapping, and also on the quality of the matching between the US and UK occupational classifications.
3.1
The UK and US Standard Occupational Classifications (SOC)
For the UK occupational classification, we have adopted the new SOC201014 occupational classification. This classification system has recently replaced SOC2000 (and, for example, will be used to classify occupations for the 2011 Census). As such, it is not yet the standard classification system implemented in the CASCOT software that we are using which still incorporates SOC2000, and so we have obtained a ‘pre-release’ beta version of the new UK SOC2010 classification structure through Professor Peter Elias at IER. Note however that we also still have the ability to match SOC2000 to examine how skill utilisation has developed historically and, by combining with SOC2000-based employment projections, how they may develop into the future.15
For the US, O*NET is currently classified according to a modified (i.e. slightly extended) version of US-SOC2009. This is referred to as the O*NET-SOC2009 taxonomy in what follows. Further details on each occupational classification system are presented in Annex B and Annex C for UK-SOC2010 and US O*NET-SOC2009 respectively.
There are some important differences between the US and UK occupational classification systems and these are worth briefly noting here since they impact upon the matching between the two classification systems.
• Neither classification system is consistent with the revised International Labour Office (ILO) International Classification of Occupations (ISCO) 2008. Hence there is no direct correspondence between the UK SOC2010 and the US SOC classification.
15
• Both classification systems are skill-based, hierarchical and with 4 distinct levels of aggregation:
• UK SOC2010 has nine major groups, 25 sub-major groups, 90 minor groups and 369 unit groups. All UK-SOC2010 occupations are assigned a 4 digit codes. The first digit represents the major group, the second digit represents the sub-major group, the third digit represents the minor group and the final digit represents the unit group.
• US SOC2009 has 23 major groups, 96 minor groups, 449 broad occupations and 821 detailed occupations. This information is recorded in a 6 digit code. The first and second digits represent the major group; the third digit represents the minor group; the fourth and fifth digits represent the broad occupation; and the sixth digit represents the detailed occupation.
• The O*NET-SOC2009 taxonomy (which is the current version used in O*NET) is an extended version of the US-SOC2009 classification. While O*NET does not gather detailed information for all 821 occupations in US-SOC2009, the additional detailed occupations defined O*NET-SOC2009 results in a total of 1,102 O*NET-SOC titles, of which information is separately recorded on 965 (so-called data-level) occupations in the O*NET system.16
• Finally, it is important to note that the primary purpose of an occupational classification is to classify a ‘job’. A job is defined as a set of tasks or duties to be carried out by one person and represents a basic element in the employment relationship. Jobs are recognised primarily by their associated job title. There are 27,739 entries in the job title index for UK-SOC2010, while there are 56,636 entries in the job title index for O*NET-SOC2009.
3.2
CASCOT
We use CASCOT to produce the mapping between UK-SOC2010 and O*NET-SOC2009. CASCOT operates by matching input text to be coded against an index of words (‘dictionary’) to which the relevant codes have been allocated. The codes represent the classification, and for our purposes, this is an occupational classification (UK-SOC2010 or O*NET-SOC2009 as appropriate). A classification is usually described via a structure, an index and a set of rules.
The index is a collection of text descriptions, each associated with a specific category within a classification. The index may be comprehensive: containing the entire range of all possible valid pieces of text. However typically it is representative containing a large number of example pieces of text for each category but not limiting any category only to those entries. Rules provide operations to treat specific text in particular ways – such as
16
resolving common abbreviations, downgrading certain words (eg man, woman), using alternative or equivalent words etc, and conclusions to make when encountering particular text. The set of rules to be associated with any classification are accumulated with experience, and can be added to over time. Currently, for example, there are over 2,000 rules associated with the SOC2010 classification.
Box 1: Scoring in CASCOT
Cascot is designed to assign a code to a piece of text. Ideally the input text should contain sufficient information to distinguish it from alternative text descriptions which may be coded to other categories within the classification and should not contain superfluous words. This ideal will not always be met. Cascot has been designed to perform a complicated analysis of the words in the text, comparing them to the words in the classification, in order to provide a list of recommendations. When compiling this list of recommendations Cascot also calculates a score from 0 to 100 which approximates the probability that the code recommended for a specific piece of input text is correct.
Frequently the input text may be a word or phrases that is descriptive of an occupation or industry but lacks sufficient information to distinguish it from other categories (i.e. without any further qualifying terms). For example in SOC2000 the text ‘Teacher’ cannot be coded unambiguously to a single category because the word occurs in several categories (including: 2315 Primary and nursery education teaching professionals; 2314 Secondary education teaching professionals; 2312 Further education teaching professionals; 2311 Higher education teaching professionals etc). When this situation is encountered there may be a rule which defines a default category, e.g. in SOC2000 the code 8212 is recommended for the unqualified text ‘Driver’. If there is no default category Cascot will still list recommendations but the score is limited to below 40 to indicate the uncertainty associated with the suggestion. For example in SOC2000 ‘Teacher’ or ‘Engineer’ have no default category.
If the input text is not sufficiently distinctive it may be the case that the top recommendation, the one with the highest score, is not the most appropriate code. This is likely to occur when there are two or more closely competing categories to which a text description could be coded.
Sometimes Cascot will not list any recommendations at all. This may be because of a rule defining the input text to be unclassifiable (eg ‘Mother’ for SOC2000), or because the input text bears little relationship to any other term in the index or the classification.
Source: CASCOT help documentation
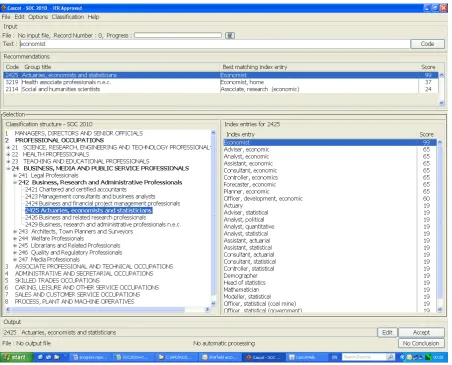
However, there are other possibilities too and these are listed with lower scores under the entry for SOC 2425 – these are SOC 3219 and SOC 2114 corresponding to index entries ‘home economist’ and ‘research associate (economics)’ respectively. These additional choices enable an experienced operator to select accordingly if the top recommendation does not look appropriate.
Figure 2: CASCOT Classification of ‘Economist’ to SOC2010
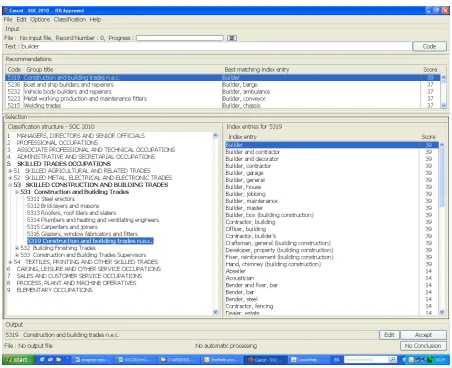
Unfortunately, not all input text can be classified so unambiguously. Figure 3 reports the CASCOT response to the entry ‘builder’, This is clearly an ambiguous term – the term ‘builder’ is indexed under a number of categories, and this is recognised in the score that CASCOT allocates. While ‘SOC 5319: Construction and building trades n.e.c.’ is chosen as the top category, it is only given a score of 39 reflecting its ambiguity i.e. the fact that builders can build many different things as shown in the recommendation list. Ambiguous text is limited to a score of 39 in CASCOT – essentially this is regarded as a ‘fail’.
[image:31.595.79.532.268.636.2]This ‘best match’ classification system can be automated – i.e. multiple text entries can be supplied to CASCOT and processed in batch – and this is the approach that we have implemented.
Figure 3: CASCOT Classification of ‘Builder’ to SOC2010
3.3
Matching
Given suitable dictionaries for UK SOC2010 and for O*NET-SOC2009, matching can, in principle, be either from UK SOC into O*NET SOC or vice versa. The advantage of matching from UK SOC into O*NET SOC is that it will ensure that all UK SOC occupations get matched (at least with some score) to O*NET occupations, since the UK SOC would be used as the input text. Coding from O*NET SOC into UK SOC may result in some UK SOC codes not being matched at all, and our ultimate purpose is to be able to match all of the 369 unit groups (4-digit occupations) in UK SOC in order to be able to construct occupational skills profiles for all 4 digit occupations in SOC2010.
The major disadvantage of matching from UK SOC to O*NET SOC is that the rules that exist to help improve the matching apply for coding into UK SOC rather than into any other occupational classification, and these rules will not necessarily apply well when coding into O*NET SOC17
CASCOT already has a SOC2010 classification dictionary available. This has 27,739 index entries (job titles) associated with the 369 4-digit unit groups in SOC2010, an average of 75 job titles per occupational unit group. However, in order to perform ‘reverse’ matching from UK SOC into O*NET SOC, we have had to construct our own O*NET classification dictionary. O*NET provides a ‘Lay Title File’ (which was revised in August 2010 to be compatible with Version 15.0 of O*NET-SOC2009). This has 56,634 lay titles (job titles) associated with the 1,102 O*NET-SOC2009 occupational titles, an average of 51 per occupational group. The CASCOT editor was then used to construct the O*NET classification dictionary from the job titles and their associated codes which together describe the O*NET structure. It is then possible to code into O*NET using this as the classification dictionary.
. However, even in the absence of a set of rules for O*NET coding, matching in this ‘reverse’ way can be used to provide some information relevant for validation and robustness checks on the coding from O*NET SOC into UK SOC.
We have undertaken 4 variants of matching:
Variant 1: Matched 1,102 O*NET-SOC2009 occupational titles into SOC2010 using
the SOC2010 classification dictionary.
Variant 2: Matched 369 SOC2010 unit group titles into O*NET SOC using the O*NET
classification dictionary.
Variant 3: Matched 56,634 O*NET-SOC2009 job titles into SOC2010 using the
SOC2010 classification dictionary.
17
Variant 4: Matched 27,739 SOC2010 job titles into O*NET SOC using the O*NET classification dictionary.
One potential advantage of Variants 1 and 2 is that, given the relatively small number of text entries to be classified, it is possible to perform this matching ‘by hand’ – that is, if appropriate, to intervene in the matching process to select other than the best match SOC2010 unit group or O*NET occupational title that CASCOT selects. An experienced CASCOT user/operator can process this number of entries relatively quickly (hours rather than days). However, these variants produced quite a large number of anomalies where CASCOT did not appear to find a good match between O*NET SOC and UK SOC2010, and also between UK SOC2010 and O*NET SOC.
One possible cause of the problems in identifying a good match between the two classification systems using occupational/unit group titles is that CASCOT is specifically designed to classify jobs, but the names given to the 369 SOC2010 unit group titles (and also the 1,102 O*NET-SOC2009 occupational titles) are not jobs per se. Rather,they are labels provided by the those responsible for designing the occupational classification system to be generic descriptions of the group of jobs that the particular occupation code encompasses. It is therefore not really appropriate to attempt to match these to index entries since they are not actually jobs, but rather are simply words and phrases used to describe a collection of job titles. For this reason, we have subsequently disregarded these first two forms of matching in what follows. However, it will be possible to use Variants 1 and 2 as part of the validation and robustness assessment at a later stage of the project.
Our main focus will therefore be on Variants 3 and 4 above. In particular, Variant 3 benefits from the rules incorporated in the SOC2010 classification dictionary to classify the O*NET job titles since the rule set has been developed explicitly for matching into SOC2010. Note that it is not practical to intervene in this matching exercise given its scale – almost 60,000 O*NET job titles are classified – and hence some post-matching processing of the resulting information is required. It is also important to examine whether all 369 SOC2010 unit groups are matched with at least some O*NET-SOC2009 job titles since our aim is to provide a complete set of SOC2010 occupational skills profiles.
3.4
Outcomes
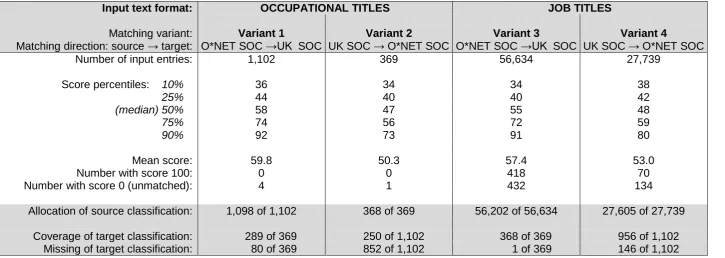
Table 4: Matching Variants – Coverage and Summary Score Statistics
Input text format: OCCUPATIONAL TITLES JOB TITLES
Matching variant: Variant 1 Variant 2 Variant 3 Variant 4
Matching direction: source → target: O*NET SOC →UK SOC UK SOC → O*NET SOC O*NET SOC →UK SOC UK SOC → O*NET SOC
Number of input entries: 1,102 369 56,634 27,739
Score percentiles: 10% 36 34 34 38
25% 44 40 40 42
(median) 50% 58 47 55 48
75% 74 56 72 59
90% 92 73 91 80
Mean score: 59.8 50.3 57.4 53.0
Number with score 100: 0 0 418 70
Number with score 0 (unmatched): 4 1 432 134
Allocation of source classification: 1,098 of 1,102 368 of 369 56,202 of 56,634 27,605 of 27,739
Matching is, in general, better when matching into UK SOC than when matching into O*NET SOC as expected given the rules that are designed to assist in matching text entries into SOC2010. Matching into SOC using O*NET occupational titles (Variant 1) or job titles (Variant 3) produces higher mean and median scores than when matching into O*NET using SOC occupational titles (Variant 2) or job titles (Variant 4). In all variants, most of the input text entries – whether occupational titles or jobs – are matched with at least some positive score. However, around 25% of the scores are at less than 40 – which means that the match is ambiguous according to the CASCOT scoring conventions. There are a few unclassified input entries (score 0 – unmatched) in all variants, but these are never a significant proportion. Some of these are a result of differences in spelling or language, while others are because there is no corresponding occupation or job. Some examples include:
• Variant 1: O*NET occupation title ‘Anesthesiologists’ is one of only 4 input entries classified as ‘no conclusion’ (score 0) in SOC2010, but using the UK spelling (’Anaetheologists’), it obtains a score of 27 for ‘2211: Medical practitioners’.
• Variant 3: O*NET job title ‘Tire molder’ is classified as ‘no conclusion’ (score 0) in SOC2010, but using the UK spelling (‘Tyre moulder’), it obtains a score of 96 for ‘8115: Rubber process operatives’.
• Variant 4: words such as labourer and cabbie are unrecognised, as are some UK-specific qualifications and abbreviations used as job titles (eg SEN, GP, MP), and so are classified as no conclusion. Similarly, specific professional and senior grades in the civil service are not recognised within O*NET and hence receive very low matched scores.
It is apparent that extending the set of rules (or rather, developing a set of rules specifically for the O*NET classification) would eliminate many if not most of these remaining difficulties.
While Variants 3 and 4 have numerically more unmatched input entries (mainly due to the very country-specific nature of some jobs (eg snowmaker) or differences in language as noted above, using the considerably more numerous job titles as input text ensures much greater coverage of the target classification. In particular, in Variant 3, all but one of the 369 SOC2010 unit groups is matched to at least one O*NET job title with a positive score. The one unmatched unit group is ‘3115: Police community support officers’ which is never selected as the best match to any of the 56,634 O*NET job titles. It would be relatively straightforward to assign O*NET occupational codes to this one remaining SOC unit group however. For the 368 matched unit groups, there is a mean (median) of 153 (83) O*NET jobs per SOC unit group, but the distribution is very uneven, and ranges from a minimum 1 job in a SOC unit group (there are two instances of this: O*NET job title ‘architectural technologist’ which is the only match to SOC2010 2435: chartered architectural technologist (score 94); and ‘window cleaner’, which is again the only match to 9231: Window Cleaners (score 94)), through to a maximum of 1,858 jobs in a unit group which is for SOC 8125: Metal working machine operatives (average score 49.5).
4
Assigning Job Skills and Abilities to UK
Occupations
Chapter Summary
The second stage of the project devises suitable schemes for amalgamating the CASCOT output on the US-job-title to UK-job-title matches to provide an O*NET-detailed-occupation to UK-SOC-O*NET-detailed-occupational-unit-group correspondence. This is necessary since each occupation in O*NET SOC typically comprises several thousand jobs as does each occupation in UK SOC.
There are a number of different ways in which this can be accomplished and there is no optimal method. We illustrate a variety of the possible schemes using a simulated example, and then illustrate the resulting patterns in weights between O*NET and UK SOC occupations.
Having selected a weighting scheme between O*NET and UK SOC occupations, it is then possible to assign O*NET occupational information to the UK SOC unit group occupations.
4.1
Weighting Schemes
Having matched the 56,634 O*NET job titles to the 27,739 UK SOC2010 job titles using CASCOT, the next stage of the project is to use the resulting matching matrix to produce a weighting scheme that can be used to map the skills and other job and worker domains which are recorded at the O*NET detailed occupational level (for the data level occupations) into the SOC unit group occupations. That is, we need to amalgamate the 56,634 rows (US job titles) by 27,739 columns (UK job titles) in the job-job matching matrix into a matrix of 965 rows (O*NET-SOC2009 data-level occupations) and 369 columns (UK SOC2010 unit group occupations). There are a number of issues here that need to be considered:
• Should the job-job matching be ignored when scores are less than 40 (which is essentially regarded as a ‘fail’ in CASCOT – usually due to ambiguity)?
• Should the job-job matching take account of non-matched jobs in averaging or aggregating to occupation-occupation weights (i.e. should these blanks be ignored or treat as zero scores)?
• Should weighting take into account the number of job-job matches in the occupation-occupation match rather than (or as well as) just the scores for the match?
• Should weighting take into account the aggregate scores across all job-job matches in the occupation-occupation match rather than average scores?
By way of illustration of these considerations, the next section implements a variety of aggregation methods for a simulated example, and graphically presents the resulting weighting schemes.
4.2
An Illustrative Example
This subsection presents an illustrative example of the matching process and alternative aggregation methodologies. For reference, the notation used is as follows:
O• = O*NET occupations (O1, O2, ...)
S• = UK SOC occupations (S1, S2, ...)
oj• = O*NET jobs (oj1, oj2, ...)
sj• = UK SOC jobs (sj1, sj2,...)
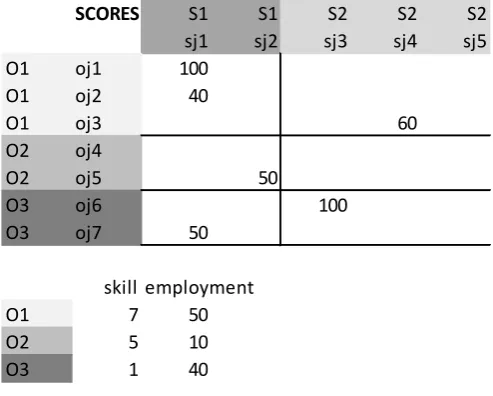
Figure 4: Weighting Schemes Based on Scores
Reading down the oj’s: oj1 matches with sj1 (score 100); oj2 also matches with sj1 (score 40); oj3 matches with sj4 (score 60); oj4 does not match with any of the sj1-sj5; oj5 matches with sj2 (score 50); oj6 matches with sj3 (score 100); oj7 matches with sj1 (score 50). Reading across the columns, all sj’s except sj5 are matched with at least one oj.
Finally, each of O1-O3 has some matched jobs to at least one of S1 or S2 with the exception that no jobs in O2 match with any jobs in S2.
SCORES S1 S1 S2 S2 S2
sj1 sj2 sj3 sj4 sj5
O1 oj1 100
O1 oj2 40
O1 oj3 60
O2 oj4
O2 oj5 50
O3 oj6 100
O3 oj7 50
skill employment
O1 7 50
O2 5 10
O3 1 40
SCHEME A OCCUPATION AVERAGE SCORES (IGNORING BLANKS)
SCORES ONLY SCORES & EMPLOYMENT
SCORES S1 S2 WEIGHT S1 S2 WEIGHT S1 S2
O1 70.0 60.0 O1 0.412 0.375 O1 0.583 0.429
O2 50.0 0.0 O2 0.294 0.000 O2 0.083 0.000
O3 50.0 100.0 O3 0.294 0.625 O3 0.333 0.571
sum 1 1 sum 1 1
skill 4.647 3.250 skill 4.833 3.571
SCHEME BOCCUPATION AVERAGE SCORES (BLANKS AS ZEROS)
SCORES ONLY SCORES & EMPLOYMENT
SCORES S1 S2 WEIGHT S1 S2 WEIGHT S1 S2
O1 23.3 6.7 O1 0.483 0.286 O1 0.651 0.333
O2 12.5 0.0 O2 0.259 0.000 O2 0.070 0.000
O3 12.5 16.7 O3 0.259 0.714 O3 0.279 0.667
sum 1 1 sum 1 1
skill 4.931 2.714 skill 5.186 3.000
SCHEME COCCUPATION TOTAL SCORES
SCORES ONLY SCORES & EMPLOYMENT
SCORES S1 S2 WEIGHT S1 S2 WEIGHT S1 S2
O1 140.0 60.0 O1 0.583 0.375 O1 0.737 0.429
O2 50.0 0.0 O2 0.208 0.000 O2 0.053 0.000
O3 50.0 100.0 O3 0.208 0.625 O3 0.211 0.571
sum 1 1 sum 1 1
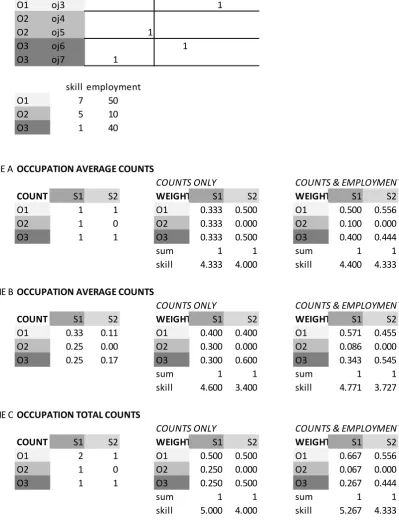
Corresponding to this SCORES matrix, Figure 5 counts the number of job-job matches which are shown as either 1 or blank in the COUNT matrix at the top of the Figure. Using counts rather scores reflects the number of matches in any occupation-occupation cell regardless of the ‘quality’ of the match as indicated by the CASCOT scoring algorithm.
Figure 5: Weighting Schemes Based on Counts
Below these matching matrices, we also provide some simulated data for each occupation O on employment and a measure of job skill. We consider a variety of
COUNT S1 S1 S2 S2 S2
sj1 sj2 sj3 sj4 sj5
O1 oj1 1
O1 oj2 1
O1 oj3 1
O2 oj4
O2 oj5 1
O3 oj6 1
O3 oj7 1
skill employment
O1 7 50
O2 5 10
O3 1 40
SCHEME A OCCUPATION AVERAGE COUNTS
COUNTS ONLY COUNTS & EMPLOYMENT
COUNT S1 S2 WEIGHT S1 S2 WEIGHT S1 S2
O1 1 1 O1 0.333 0.500 O1 0.500 0.556
O2 1 0 O2 0.333 0.000 O2 0.100 0.000
O3 1 1 O3 0.333 0.500 O3 0.400 0.444
sum 1 1 sum 1 1
skill 4.333 4.000 skill 4.400 4.333
SCHEME BOCCUPATION AVERAGE COUNTS
COUNTS ONLY COUNTS & EMPLOYMENT
COUNT S1 S2 WEIGHT S1 S2 WEIGHT S1 S2
O1 0.33 0.11 O1 0.400 0.400 O1 0.571 0.455
O2 0.25 0.00 O2 0.300 0.000 O2 0.086 0.000
O3 0.25 0.17 O3 0.300 0.600 O3 0.343 0.545
sum 1 1 sum 1 1
skill 4.600 3.400 skill 4.771 3.727
SCHEME COCCUPATION TOTAL COUNTS
COUNTS ONLY COUNTS & EMPLOYMENT
COUNT S1 S2 WEIGHT S1 S2 WEIGHT S1 S2
O1 2 1 O1 0.500 0.500 O1 0.667 0.556
O2 1 0 O2 0.250 0.000 O2 0.067 0.000
O3 1 1 O3 0.250 0.500 O3 0.267 0.444
sum 1 1 sum 1 1
weighting schemes between the Os and the Ss derived from the CASCOT matching scores/counts, possibly in combination with relative employment shares, in order to produce a weighted skill score for each occupation S. That is, we examine different methods of summarising the 7 × 5 matrix of job-job scores as would be produced by CASCOT into a 3 × 2 matrix of occupation-occupation weights. The weighting schemes differ in terms of how the job-job matching scores are combined.
• In Scheme A, averages across all identified (i.e. non-zero) matches in the occupation-occupation cell are taken (i.e. ignoring the blanks (non-matches)).
• In Scheme B, the non-matches are explicitly taken into account by averaging over all job-job cells (i.e. regarding blanks (non-matches) as scores of zero). In terms of relative weights, this is also equivalent to averaging over the row sums of oj within each S (since each oj has a maximum of one entry in any row).
• In Scheme C, the aggregate total score in each occupation-occupation cell is computed.
The results of implementing these three schemes are shown in the first column of occupation-occupation grids in Figure 4. For the count-based scoring in Figure 5, combining the counts in each scheme uses the same principles as for the scores. Thus for Scheme A, all occupation-occupation averages are either 1 or 0. Including zeroes as in Scheme B is equivalent to taking into account the number of oj that make a match within any S. Finally Scheme C counts the total number of matches in each occupation-occupation cell.
Having combined the scores and counts, the relative weights can be calculated. These are just the normalised (i.e. sum to unity) scores/counts for each occupation S (i.e. for each column). This enables any S to be expressed as a weighted average of all of the O’s; the weight will be zero if there are no matches between an O*NET occupation and a SOC occupation as shown in the O2-S2 cells in the second column of occupation-occupation grids in Figures 4 and 5.
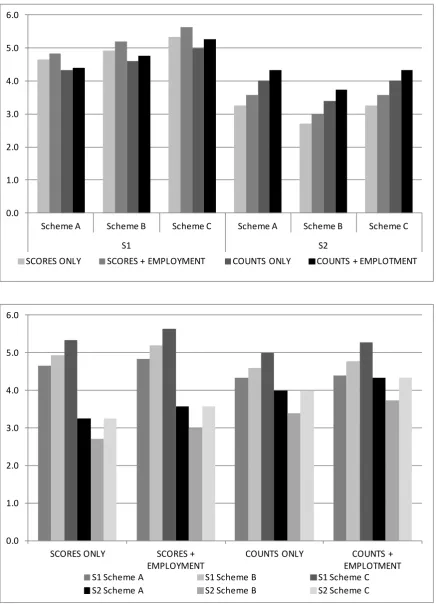
For each of the 12 weighting methods (3 (Schemes A, B, C) × 2 (without or with employment) × 2 (SCORES or COUNTS)), we illustrate the impact of the different methods using a measure of ‘skill’ at the O*NET level. The ‘skill’ row in Figures 4 and 5 beneath the weights is the weighted average skill for each S based on the weights in the grids immediately above. These weighted average skill scores are illustrated in Figure 6.
The top graph presents for the 4 methods of weighting (scores only, scores+employment, counts only, and counts+employment) the estimated skill score for S1 and S2 using Scheme A, B and C. Average Skill is consistently greater in S1 than in S2 which suggests that (at least in these limited data), the weighting does not changing the rankings, although the difference in skill scores vary quite a lot between Schemes, and between methods. Within method, the difference is greatest for Scheme B (averaging including blanks as zeroes) and smallest for Scheme A (averaging ignoring blanks). Indeed, for the final method (counts+employment) and Scheme A (ignoring the blanks) the average skill is actually the same in S1 and S2.
The bottom graph presents the same data organised rather differently. Now, for each S and Scheme, the average skill for the four differen