Differential
achievement:
what does
the ISR profile
tell us?
Peter Davies
th
e
ag
enc
y
c
o
mment
Published by the
Learning and Skills Development Agency
Feedback should be sent to Information Services,
Learning and Skills Development Agency,
3 Citadel Place, Tinwor th Street, London SE11 5EF Tel 020 7962 1066 Fax 020 7840 5401
www.LSagency.org.uk
Registered with the Charity Commissioners
Editor: Jennifer Rhys
Designers: Dave Shaw and Joel Quar tey Printer: Copyprint Ltd, London
ISBN 1 85338 604 9
© Learning and Skills Development Agency 2000
You are welcome to copy this repor t for internal use within your organisation. Other wise, no par t of this publication may be reproduced, stored in a retrieval system, or transmitted in any form or by any means, electronic, electrical, chemical, optical, photocopying, recording or other wise, without prior written permission of the copyright owner.
Raising Quality and Achievement Programme
Run by the Learning and Skills Development Agency in par tnership with the Association of Colleges (AoC).
● We aim to reach all colleges and all levels of staff.
● We offer extra suppor t to colleges that are receiving Standards Fund money to improve their practice.
● All our activity themes are backed by a programme of research and evaluation.
● The Raising Quality and Achievement Programme is sponsored by the DfEE and all activities are subsidised.
Contents
Preface 1
Summar y 1
1. Background and aims 2
2. Methodology 3
3. Findings 4
4. Conclusions 18
References 21
Preface
The research project on which this repor t is based, is par t of the Raising Quality and Achievement programme, sponsored by the Depar tment for Education and Employment (DfEE). Work on the project star ted in Februar y 2000.
The repor t sets out the findings of the first stage of the project, which investigated the extent to which inter-institutional differences in FE-sector achievement rates can be explained by relative differences in the profiles of enrolled students. Work has now star ted on Stage 2, which aims to evaluate the complementar y impact on achievement of differences in institutional practices. It is anticipated that the final repor t from the project will contain guidance to colleges on effective strategies to raise achievement, and information aimed at clarifying the relative influence of institutional performance and of demographic factors.
In under taking this work, the Learning and Skills Development Agency acknowledges the considerable assistance received from the Further Education Funding Council (FEFC) and the Responsive College Unit (RCU), without which this repor t would not have been possible.
Peter Davies
Project Leader
Terry Rudden
Statistician
Summary
Since 1998, the Fur ther Education Funding Council (FEFC) has identified a group of general FE and ter tiar y colleges serving areas with high levels of deprivation – high widening par ticipation (WP) factor colleges – that taken overall, have rates of student retention and achievement significantly below those of other FE-sector colleges. Even within this high WP factor group, however, achievement rates var y considerably.
There is a relationship between these differences in achievement rates and the differences in the profiles of the student bodies concerned, as recorded in the FEFC’s Individualised Student Record (ISR) data. High WP factor colleges with the lowest achievement rates are associated with propor tionately larger numbers of students in ISR categories that exhibit below average achievement rates. Broadly speaking, for ever y additional 10% of the total student numbers in a college that are drawn from postcodes that trigger the so-called widening par ticipation uplift, long course achievement rates fall by around 3%.
Never theless, relative differences in
ISR profiles are only able to explain a minorityof the inter-institutional differences in achievement. The achievement rates of the lowest achieving colleges are below average primarily because they are lower across the large majority of ISR categories, not because their student profiles differ in ways that act to reduce overall achievement rates – though that is also the case. The correlation between achievement rates and the proportion of students who trigger the WP uplift is weak, and there are several high achieving colleges that have high percentages of students drawn from deprived areas.
Our overall conclusion from the first stage of this project is that the majority of the inter-institutional differences in achievement rates among high WP factor colleges must be explained by:
● geodemographic and other factors outside the direct influence of colleges, that are not captured by the ISR, or by other measures currently used to profile student bodies
● differences in institutional ethos, systems, procedures and practices that affect student performance.
The Learning and Skills Development Agency is now working with ten colleges on an investigation of the impact of institutional practice on the main-tenance and improvement of student achievement. Fur ther analysis is also being done on the relationship between demography and achievement. A final repor t on the project will be published in 2001.
Please note
This report is based on analysis of ISR data for 1997/98. Since it was prepared, the data for 1998/99 has become available. Although there are some differ-ences in the details of the patterns of student achievement compared with those repor ted here, analysis of the 1998/99 data confirms our main conclusions. Though the achievement gap between colleges has closed, comparative differences in ISR profile cannot explain the bulk of the gap.
1. Background
and aims
1.1. In the drive to raise standards and improve student achievement across the FE sector, it has been recognised for some time that there appeared to be wide differences in the retention and achievement rates of different colleges which were not obviously explicable by relative differences in student demography, or other factors outside the direct influence of colleges (Audit Commission/Ofsted 1993).
1.2. FEFC has already under taken some analysis to identify links between deprivation and retention/ achievement. Since 1998 each college has been allocated a widening par ticipation (WP) factor. It is based on the number of students recruited from areas with different levels of deprivation and uses a modified version of the Depar tment of the Environment, Transpor t and the Regions’ index of local conditions. The higher the number of students from postcodes with high levels of socio-economic deprivation, the higher the WP factor. Retention and achievement rates for a group of 41 general FE and ter tiar y colleges which have a WP factor of 1.025 or above were found to be significantly below those of other colleges of the same type. No other group showed significant differences. However, even within the high WP factor group there is a considerable range of achievement rates (FEFC 1999a).
1.3. In recent years FEDA and the Learning and Skills Development Agency have established robust evidence to demonstrate that student retention is influenced substantially by factors within the sphere of college influence. A number of college-level intervention strategies have been shown to be capable of effecting significant improvements in retention rates (Mar tinez and Munday 1998). A body of case-study evidence has been assembled which indicates that the same also applies to achievement rates (Mar tinez 2000).
1.4. Nonetheless, the relative impact on retention and achievement rates of demography and of institutional performance was still not known with any great precision. Aside from the consider-able implications for funding, colleges remain concerned not to be put in a position where they set unrealistically high benchmark target.
Nor do they wish to devote additional resources to tackling achievement rates which are below the average for apparently equivalent institutions if, in fact, they are really performing well, once accurate allowance is made for comparative student profiles. Equally, some colleges with achievement rates above average for the sector may be lulled into undue complacency if in practice they are not able to make such allowances.
1.5. A rich data source exists as a basis for investi-gating the links between student profiles and achievement rates in the form of FEFC’s Individualised Student Record (ISR),
which contains comprehensive data on ever y student enrolled on courses leading to approved qualifications. During 1999, FEFC kindly granted ‘analysis par tner’ status to a number of
organi-sations – including FEDA, AoC and RCU – allowing them direct access to the complete ISR data collection for England. The code of practice which governs the use of the data collection by ‘analysis par tners’ forbids the publication of detailed ISR statistics in a way that would allow individual students or colleges to be identified without their permission.
1.6. In this context, therefore, FEDA established the ‘Differential achievement’ research project to:
● investigate the reasons for the
large variations in student achievement, within and between institutions, and between different groups of students
● assess the extent to which demographic factors are determinants of inter-institutional differences in rates of achievement
● identify institutional practices connected with higher and lower levels of achievement to inform college-level improvement strategies.
1.7. Stage 1 of the project, with which this
repor t deals, was primarily directed to the first two aims, and involved analysis of ISR data. In the second stage Learning and Skills Development Agency consultants under took a programme of visits to a sample of ten colleges to examine systems and practices that might affect achievement. The visits aimed to identify more precisely than hither to the strategies that appear most effective in securing good achievement rates, and any practices that appear to threaten achievement. The Learning and Skills Development Agency co-ordinated Stage 2 with the parallel investigation of retention and achievement in FE by the National Audit Office (NAO).
2. Methodology
2.1. The analysis on which this repor t is based makes use of the ISR data collection for 1997/98 (ISR 13) which, at the start of the project, contained the most recent, fully audited data available. The 1996/97 data collection was also investigated for purposes of comparison, to check the extent to which there had been significant movement from one year to the next.
2.2. Analysis concentrated on examining the relationships between student profiles and achievement rates. Generally speaking, if inter-institutional differences in achievement rates are accounted for primarily by relative differences in student profiles, we would expect strong correla-tions between colleges’ overall achievement rates and the relative breakdown of the different fields within the ISR. It should be noted here that the FEFC calculates achievement rates as the total number of qualification aims achieved, expressed as a percentage of the total number of qualifica-tion aims for which students have completed learning programmes.
2.4. FEDA also commissioned RCU to under take analysis of the ISR, building on RCU’s work on behalf of Newham College of Further Education and Tower Hamlets College. The aim was to enhance the performance indicator information already provided by the FEFC (FEFC 1999b). This employs broad categories based on the percentage of students at each college receiving a widening par ticipation tariff uplift to reflect the degree of relative deprivation in colleges’ student bodies. The analysis under taken by RCU concentrated on colleges identified as having high, or ver y high deprivation among the student bodies (i.e. respectively, 35%–50%, and over 50% of students, qualifying for the uplift). There are 33 colleges in the former group and 25 in the latter, though one of the latter group was excluded from the analysis as its data had been identified by FEFC as being insufficiently reliable. As might be imagined, there is considerable overlap between the composition of this group, and that of the slightly smaller one involved in the Learning and Skills Development Agency’s analysis, as defined in the previous paragraph.
2.5. The findings that follow are structured according to the broad groupings of the fields within the ISR. The full breakdown of the data on which the figures in the text are based is set out in the appendix to the repor t.
3. Findings
Overall
3.1. There is a considerable spread of achievement rates across the high WP factor colleges, ranging from 44% for the lowest achieving group to 78% for the highest achieving group, with an overall rate for the whole group of 63%. Among the group of ver y high deprivation colleges involved in the RCU study, overall achievement rates for all courses range from 34% to 83%, and among the high deprivation group from 48% to 90%.
Gender
3.2. Females had higher achievement rates than males across the high WP factor colleges involved in the Learning and Skills Development Agency’s analysis. Female achievement rates ranged from 47% in the lowest group to 81% in the highest, with a rate of 65% across the whole group. The equivalent rates for males were 41%, 76% and 60% (see Figure 1a opposite).
3.3. There is considerable variation in the gender structures of the ver y high deprivation group of colleges involved in the RCU study, the percentage of females ranging from 33% to 68%.
3.4. The lowest achieving group of colleges has a more even gender balance than that of the whole high WP group, where females outnumber males. This pattern also applies to the highest achieving group of colleges (see Figures 1b and 1c opposite). However, these relative differences in the gender profile of the ISR can only explain a small amount of the difference between the overall long course achievement rates of the highest and lowest groups. It is notable that the male achievement rate for the highest group, and across all high WP colleges, is markedly better than the female achievement rate for the lowest group.
Figure 1a | Long course achievement rates of colleges with high WP factors – gender
Figure 1b | Comparative proportions of students on long courses in ISR categories associated with below average achievement – gender
6 Differential achievement
[image:8.595.28.353.55.184.2]Figure 2a| Long course achievement rates of colleges with high WP factors – ethnicity
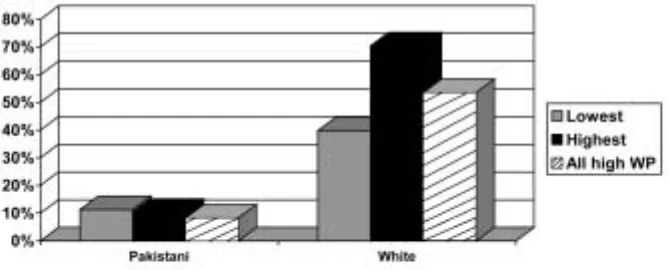
[image:8.595.33.309.232.363.2]Figure 2b| Comparative proportions of students on long courses associated with below average achievement – ethnicity
Figure 2c| Comparative proportions of students on long courses associated with above average achievement – ethnicity
[image:8.595.28.363.420.555.2]Ethnicity
3.5. Across all high WP colleges, all ethnic groupings listed in the ISR, other than Pakistani and White, are associated with long course achievement rates below the overall figure for this group (63%). The rates range from 52% (Black–Caribbean) to 67% (White) (see Figure 2a opposite).
3.6. The spread of ethnic populations across colleges is far from even, with large concentrations of par ticular groups in only a few colleges, and many having small numbers. Three colleges in the FEFC’s ver y high deprivation categor y draw close to three-quar ters of their full-time students from Black or Asian ISR categories, while six have less than a third. At 51%, the median for the ver y high deprivation group is notably greater than for the high deprivation group (24%). A fur ther complication is the percentage of records in the Unknown categor y, var ying from 1% to 58% across the very high deprivation group. This suggests that some colleges have more successful ethnic monitoring systems than others, although there is also known to be active resistance in some areas to the inflexibility of current ethnic monitoring categories.
3.7. This makes it difficult to distinguish consistent patterns of achievement according to ethnicity. Cer tainly, the lowest achieving colleges have significantly greater than average propor tions of students from some ethnic groups, while the opposite is true for the highest group – especially the categories Black – African, Black – Caribbean, Black – Other, Other Asian, Other and Unknown (see Figures 2b and 2c opposite). However, as with gender, the achievement rates of the highest group are notably better across all categories. It does not appear, therefore, that differences in the ethnic profile of colleges can adequately explain more than a small par t of the gap in achievement rates.
Disability
3.8. Students who are identified within the ISR as disabled have an achievement rate that is much the same as the overall figure for the high WP colleges. Within the lowest group, however, the disabled categor y is associated with below average achievement (see Figure 3 opposite).
3.9. The percentage of students who identified themselves as having learning difficulties or disabilities within the ver y high deprivation group of colleges varies from 9% to well under 1%. This variation may reflect differences in data recording policies as well as actual differences in client groups.
3.10. The lowest achieving group of colleges has a slightly higher than average proportion of disabled students (6% compared with just under 5% overall), but this also applies to the higher group. In all three groupings of colleges, sizeable propor tions of students are categorised as Unknown so far as their disability status is confirmed. Given this pattern, it is difficult to be precise about the impact of disability on overall achievement rates. In view of the relatively small numbers involved, though, it would seem to account for ver y little, if any, of the inter-institutional differences.
Destinations
3.11. Only two categories within the ISR fields concerning student destinations are associated with achieve-ment rates below the overall figure for the high WP colleges – Other and Unknown (see Figure 4a overleaf). Within the destination fields there is a wide range of achievement rates, ranging from 56% (Unknown) to 81% (Higher education).
8 Differential achievement
[image:10.595.30.345.233.350.2]Figure 4a| Long course achievement rates of colleges with high WP factors – destinations
Figure 4b| Comparative proportions of students on long courses in ISR categories associated with below average achievement – destinations
[image:10.595.32.348.420.534.2]Fee remission
3.13. Across the whole group of high WP colleges, there is a considerable variation in achievement rates within the ISR fields relating to fee remission, ranging from 40% (Fees waived – asylum seeker) to 65% (Fees waived – unwaged dependents and Unknown). The pattern of achievement rates is by no means uniform, however, and differs in respect of the lowest and highest groups of colleges (see Figure 5a overleaf).
3.14. Judgements about the relationship between categories within these ISR fields and inter-institutional differences in achievement rates are rendered difficult by the fact that around three-quar ters of records are listed as Unknown. Though there are some instances where the lowest group of colleges has relatively higher propor tions of students in categories associated with below average achievement, in each case the numbers involved are too small to be significant statistically (see Figures 5b and 5c overleaf). Once again, therefore, it is unclear how the data within this set of fields can account for the overall pattern of inter-institutional differences in achievement.
Mode of attendance
3.15. Full-time par t-year and par t-time modes of atten-dance are both associated with below average achievement rates (see Figure 6a, page 10).
3.16. The lowest group of colleges has significantly higher propor tions of records in these two fields than the highest, or the whole group of high WP colleges (see Figures 6b and 6c, page 10). Though this could help to account for some of the inter-institutional differences in achievement, it does not appear to be able to explain most of them. It is notable that even the full-time full-year mode at the lowest achieving colleges has an achievement rate well below that for any of the mode categories in the highest, or across the whole group.
Qualification level
3.17. Generally speaking, achievement rates rise with level of qualification. Though this pattern is not entirely uniform, it is especially true of the lowest achieving group of colleges (see Figure 7a, page 12).
3.18. The lowest achieving colleges have a somewhat larger than average propor tion of students at level 2, and smaller than average propor tions at levels 3, 4/5 and other (see Figures 7b and 7c, page 12). The make-up of the curriculum por tfolio by level of qualification therefore does seem to have some connection with gaps in achievement rates between different colleges. Nonetheless, the achievement rates at levels 1–3 in the lowest achieving colleges are below the overall figures for the whole group of high WP colleges, and notably so in the case of the highest achieving group. Here again, therefore, inter-institutional differ-ences in achievement appear to be explicable only to a limited extent by relative differences in student profiles.
Qualification category
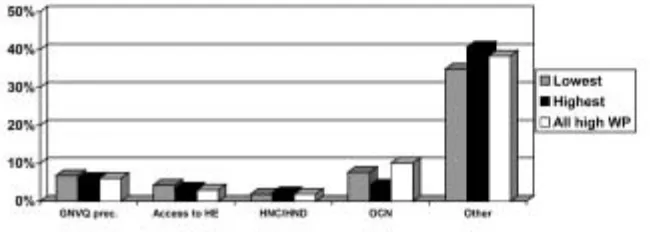
3.19. Across the whole group of high WP colleges, achievement rates by qualification categor y var y from 57% (A/AS-level) to 73% (HNC/HND). Categories associated with below average achievement are A/AS-level, GCSE, GNVQ, NVQ and Additional NVQ/GNVQ. However, the pattern is not uniform for the lowest and highest achieving groups of colleges (see Figure 8a, page 13).
10 Differential achievement
[image:12.595.29.360.233.409.2]Figure 5a| Long course achievement rates of colleges with high WP factors – fee remission
Figure 5b| Comparative proportions of students on long courses in ISR categories associated with below average achievement – fee remission
[image:12.595.29.343.459.578.2]Figure 6a | Long course achievement rates of colleges with high WP factors – mode of attendance
Figure 6b | Comparative proportions of students on long courses in ISR categories associated with below average achievement – mode of attendance
[image:13.595.71.380.417.534.2]12 Differential achievement
[image:14.595.33.354.232.362.2]Figure 7a| Long course achievement rates of colleges with high WP factors – qualification level
Figure 7b| Comparative proportions of students on long courses in ISR categories associated with below average achievement – qualification level
[image:14.595.30.349.421.538.2]Figure 8a | Long course achievement rates of colleges with high WP factors – qualification category
Figure 8b | Comparative proportions of students on long courses in ISR categories associated with below average achievement – qualification category
[image:15.595.65.390.419.535.2]Age
3.21. Within the ISR age categor y fields for the whole group of high WP colleges, there is relative little variation from the overall achievement rate except in those with only small numbers of records (see Figure 9a opposite).
3.22. There is not much variation in the age structures of different colleges, though the mean age for students at the ver y high deprivation group of colleges (24) is two years higher than for the high group (22).
3.23. There are a number of differences between the age profiles of the lowest achieving and highest achieving groups of colleges, and between each of these groups and the whole group of high WP colleges (see Figures 9b and 9c opposite). However, taken together these differences do not appear to account for any of the gaps in overall achievement rates between the three groups.
Guided learning hours
3.24. Generally speaking, achievement rates are at their highest in the categor y 600 and over guided learning hours (glh) (see Figure 10a, page 16). Across the whole group of high WP colleges, they range from 59% (200–299 glh) to 72% (600 and over glh).
3.25. The lowest achieving group of colleges has slightly higher than average propor tions of records in the former categor y, and substantially lower than average in the latter (see Figures 10b and 10c, page 16). The make-up of the curriculum by course length therefore does seem to account for some of the inter-institutional differences in achievement, albeit a minority of them.
Programme area
3.26. Achievement rates across the whole group of high WP colleges var y from 59% (Engineering) to 69% (Health and Community Care), though there is more variation about the average in the highest achieving group and, especially, in the lowest achieving group (see Figure 11a, page 17).
3.27. Generally speaking, the lowest achieving colleges have somewhat higher propor tions of records in the programme area fields associated with below average achievement, and lower pro-por tions in those associated with above average achievement (see Figures 11b and 11c, page 17). However, here again relative differences in student profiles do not appear to account for more than a small element of the gaps between the overall achievement rates.
Figure 9a | Long course achievement rates of colleges with high WP factors – age
Figure 9b | Comparative proportions of students on long courses in ISR categories associated with below average achievement – age
[image:17.595.70.391.418.545.2]16 Differential achievement
[image:18.595.27.345.234.351.2]Figure 10a| Long course achievement rates of colleges with high WP factors – guided learning hours
Figure 10b| Comparative proportions of students on long courses in ISR categories associated with below average achievement – guided learning hours
[image:18.595.26.341.421.534.2]Figure 11a | Long course achievement rates of colleges with high WP factors – programme area
Figure 11b | Comparative proportions of students on long courses in ISR categories associated with below average achievement – programme area
[image:19.595.68.389.419.550.2]4. Conclusions
Connection of ISR profile
with achievement rates
4.1. It does not appear from our analysis of the data that, taken together, the relative differences in student profiles as recorded by the ISR are capable of explain-ing the major par t of inter-institutional variations in achievement. The achievement rates of the lowest achieving group are below average primarily because they are lower across most of the fields in the ISR, not because that group of colleges has higher than average propor tions of students in the fields associated with below average achievement – even though the latter is usually also the case.
4.2. It is difficult to make valid theoretical projections about what we could expect to be the effects on the overall achievement rates of the lowest and highest achieving groups if their student profiles did not differ from that of the whole group of high WP colleges. Adjustments to the propor tions in any one field within the ISR can affect all others. Nonetheless, we estimate that at the absolute maximum the impact would not exceed +or
−8 percentage points. In other words, on this evidence less than half of the variations from the overall achievement rate for the whole group of high WP colleges could be attributed to relative differences in student profiles.
Reliability of data
4.3. There are a number of potential explanations for inter-institutional variations in achievement in addition to those related to relative differences in ISR profiles. One possibility is that that data within the ISR is inaccurate to an extent that exaggerates the differences we have identified. So far as FEFC is concerned, there are only three cases among the high WP colleges where the 1997/98 achievement rates are flagged as being inaccurate, all of which were excluded from our analysis. There are some variations between the 1996/97 and 1997/98 long course achievement rates for high WP colleges that provoke suspicion about the reliability of at least one of those year’s figures. For example, one of the colleges that lay within the highest achieving group in 1996/97 fell within the lowest achieving group the following year. Two other colleges journeyed almost as far in the opposite direction. Given the acknowledged improvements in the reliability of the ISR over time, though, it is difficult to believe that inaccuracies in the data could have more than a marginal impact on the main comparisons we have made.
Qualifications per student
4.4. A fur ther possibility is that the lowest achieving group of colleges tend to enter students for a greater than average number of qualifications, while the higher achieving group do the opposite. However, when the average numbers of qualifica-tions per student are plotted against the achieve-ment rates for all high WP colleges, there is little or no correlation (see Figure 12 opposite). This hypothesis can therefore be rejected.
Other demographic factors
4.5. There are factors that might affect the relative profiles of student bodies in addition to those we have used as a basis for our analysis. The ISR is perhaps limited in its ability to measure deprivation as it affects individual students. Postcodes are widely used as proxy indicators of relative depri-vation and in as far as this method of measurement is successful, it captures a range of factors related to deprivation. If differences in the relative depri-vation of student bodies provide an explanation for inter-institutional differences in achievement rates across the high WP group of colleges, we should expect there to be a correlation. In fact, the relationship between achievement rates and the percentages of students from postcodes that trigger the WP uplift is weak (r =0.376). The line of best fit suggests that for ever y additional 10% of total student numbers that trigger the uplift, overall achievement rates fall by around 3%. But the weakness of the correlation is revealed by the significant minority of relatively high achiev-ing colleges that have student profiles comprised over whelmingly of students who trigger the uplift (see Figure 13 opposite). The RCU study pro-duced a broadly similar picture, though there was a stronger negative correlation for shor t and medium-length courses.
Figure 12 | High WP factor colleges – achievement rates by qualifications per student
[image:21.595.69.362.260.393.2]4.6. It is also possible that some of the fields within the ISR provide a level of discrimination between different types of students that is insufficient for assessing the true impact on rates of achievement. For example, the ethnicity categor y Black – African lumps together individuals who are refugees in severely deprived circumstances, for whom English is not their first language, along with English speakers from largely middle-class backgrounds. The former are concentrated in two colleges in Greater London. In these circumstances, there is clearly the potential for the achievement rates of the two colleges concerned to be disproportionately affected. However, as neither lies within our lowest achieving group we do not consider that this issue invalidates the general conclusions that we have reached.
Prior attainment
4.7. This investigation has not examined in detail the relationship between achievement rates and prior attainment in nationally recognised qualifications. This is a complex field, which the Learning and Skills Development Agency is investi-gating in another project concerning value added. It is now generally accepted that there are signifi-cant correlations between GCSE scores and performance in A/AS-levels. There also appear to be correlations between GCSE scores and GNVQ performance, albeit less strong. No reliable evidence yet exists as to the relationship between GCSE scores and other qualifications.
4.8. The relationship between the overall achievement rates of colleges, and relative differences in the prior attainment profile is not entirely clear. As we have seen, there is clearly a negative correlation between overall achievement and the relative proportions of students at each qualification level. However, as the Learning and Skills Development Agency has pointed out elsewhere, in theor y the prior attainment profiles of students should not impinge fur ther on FE, provided that students are enrolled at the level appropriate to their abilities (Mar tinez, 1999). The fact that the lowest achie-ving group of colleges has a near average pro-por tion of students at level 1 and a higher than average propor tion at level 2, does not suggest any evidence that they have a greater than average propensity to enter students for qualifications at levels beyond those with which they are able to cope.
Institutional performance
4.9. The major par t of institutional differences in achievement rates cannot be explained by relative differences in student profiles as recorded in the ISR, or in other available measures. Therefore, the conclusion must be that the main explanation lies in the influence of:
● geodemographic and other factors outside the direct influence of the college, which are not captured by the ISR, or by other measures that are used to profile student bodies
● differences in institutional ethos, systems, procedures and practices that affect student performance.
Evidence on the influences on student retention leads us to believe that, in general, the latter are likely to account for a substantial propor tion of the inter-institutional differences in achievement rates, probably at least half.
Next steps
4.10. In the next stage of this project, the Learning and Skills Development Agency worked with ten colleges to investigate in detail the impact of institutional practices on the maintenance and improvement of student achievement. In parallel, fur ther analysis will be under taken to supplement our understanding of the relationship between demography and achievement. A final repor t containing advice and guidance to policy-makers and to college managements and staff will be published in 2001.
References
Audit Commission/Ofsted (1993)
Unfinished business: full-time educational courses for 16–19 year olds. HMSO
FEFC (1999a) Benchmarking data 1995–96 to 1997–98
FEFC (1999b) Per formance indicators 1997–98
Mar tinez P and Munday F (1998) 9,000 voices.FEDA
Mar tinez P (1999) Aiming at achievement.FEDA
Appendix:
Comparative
ISR profiles
The tabulation set out in the following pages contains comparative 1997–-98 ISR aggregated data for:
● the whole group of 38 high WP factor general FE and ter tiar y colleges involved in the analysis (All 38 colleges)
● the group of 6 high WP factor colleges with the lowest long course achievement rates (Lowest)
● the group of 6 high WP factor colleges with the highest long course achievement rates (Highest).
Figures are presented for each of these three groups, as follows:
● the number of qualification aims within each field for which students have completed learning programmes (Number)
● the propor tion of the total number of completed learning programmes that is associated with each field (%)
● the achievement rate associated with each field, expressed as the total number of qualification aims achieved as a percentage of the total number of qualification aims for which students have com-pleted learning programmes (Ach. Rate %).
What is the relation between low rates of student retention and achievement and the ISR profiles of the students? Is there one? Or can the majority of differences be explained by geodemographic factors, or the college ethos? This publication examines this and other important questions, based on rigorous analysis of the complete ISR data collection for England.
ISBN 1 85338 604 9
th
e
ag
enc
y
c
o