BUSINESS SUPPORT FOR SOCIAL
ENTERPRISES: FINDINGS FROM A
LONGITUDINAL STUDY
Gordon Allinson, Paul Braidford,
Maxine Houston, Fred Robinson
and Ian Stone
Policy Research Group,
University of Durham
Acknowledgments
The authors would like to gratefully extend their thanks to all the organisations which took part in the research for both their time and their willingness to engage fully with the research process. The research was funded by the Office for Civil Society and managed by the Department for Business, Innovation and Skills.
Contents
Executive Summary ... 9
1
Introduction ... 14
1.1
Policy context ... 14
1.1.1
A developing theme ... 14
1.1.2
Recent strategy ... 15
1.2
Aims of project... 16
1.3
Structure of the report ... 17
2
Methodology ... 18
2.1
Background and derivation of the sample ... 18
2.2
Telephone survey ... 18
2.3
Longitudinal research ... 19
3
Literature Review: Social Enterprise, what defines the sector? ... 21
3.1
Characteristics, conceptual models and size of the sector ... 21
3.1.1
Conceptual models ... 21
3.1.2
Definition used by current study ... 22
3.1.3
Size of SE sector ... 23
3.2
Distinguishing SEs from SMEs and Other CSOs ... 23
3.2.1
Sectoral ... 23
3.2.2
Origins ... 24
3.2.3
Sources of income ... 25
3.2.4
Turnover ... 26
3.2.5
Employment ... 27
3.2.6
Volunteers ... 28
3.3
The need for business support ... 29
3.3.1
SE use of business support ... 29
3.4
Supply-side diagnosis of SE business support needs ... 30
3.4.1
Engagement and terminology... 30
3.4.2
Emphasis on start-ups ... 30
3.4.3
Ability to pay ... 31
3.4.4
Appropriate models of support ... 31
3.5
Factors influencing demand ... 31
3.5.1
Lack of self awareness in the sector ... 32
3.5.2
SE perceptions of business support ... 32
3.5.3
Finance-related issues ... 33
3.5.4
Understanding how SEs operate: Governance and effective staff
management ... 34
3.6.1
Role models and networking ... 35
3.6.2
Appropriate language and focus ... 35
3.6.3
Understanding how SEs make their decisions ... 35
3.6.4
Guidance for business support advisors ... 36
3.6.5
Delivering support more effectively ... 37
3.7
Key points ... 37
4
Social Enterprises in business ... 39
4.1
What’s in a name? Sector attitudes towards the ‘social enterprise’
classification ... 39
4.2
Quality and accreditations ... 41
4.2.1
Badging the sector- Value placed on SE mark ... 41
4.3
The importance of how and why SEs get started ... 42
4.4
Values – their importance and influence ... 43
4.5
Business models – combining mission and enterprise ... 44
4.5.1
Degrees of financial independence ... 44
4.5.2
Dependency on fundraising – grants and donations ... 45
4.5.3
Operating models ... 46
4.6
Objectives and performance ... 48
4.7
Measuring social impacts ... 49
4.7.1
Measuring methods ... 49
4.7.2
Reporting outcomes and using data to drive performance ... 50
4.8
Governance and board roles ... 52
4.8.1
How SE boards are constituted ... 52
4.8.2
Recruitment to the board ... 52
4.8.3
The contribution of boards ... 54
4.8.4
The role of the board ... 55
4.8.5
Training board members ... 56
4.9
Human Resources ... 57
4.9.1
Recruitment and retention of staff ... 57
4.9.2
Staff development and training ... 58
4.9.3
Contracting out ... 61
4.9.4
Volunteers ... 61
4.9.5
Labour relations, employment law, contracts and terms and conditions
62
5
Challenges and responses across the study period ... 64
5.1
Big Society and the changing business environment ... 64
5.1.1
Big Society ... 64
5.1.2
Financial impacts - trends and changes during 12 months ... 65
5.1.3
External funding and relationships with public sector clients ... 66
5.2
Ambitions for growth ... 70
5.2.1
Internal factors affecting growth ... 71
5.3
Barriers to growth ... 74
5.3.1
Issues common to SEs and SMEs ... 74
5.3.2
Where SEs and SME s differ ... 74
5.3.3
Perceived barriers to growth... 75
5.4
Management and leadership ... 77
5.4.1
Skills gaps ... 77
5.4.2
Bringing in management experience from outside ... 78
5.4.3
Cultural issues in addressing HR issues ... 79
5.4.4
Using the board’s talents to address gaps ... 80
5.4.5
Addressing gaps – training ... 82
5.5
Strategic capacity ... 82
5.5.1
Business plans - content ... 84
5.5.2
Business plans – route maps or side issues? ... 84
5.5.3
Business planning practices ... 85
5.6
Seeking the finance for growth ... 85
5.6.1
External finance ... 85
5.7
Achieving sustainability: financial security ... 87
5.7.1
Financial management ... 87
5.7.2
Bad debts ... 88
5.7.3
Payment terms ... 88
5.7.4
Purchasing policies ... 88
5.7.5
Pricing policies ... 89
5.7.6
Information for planning ... 89
5.7.7
Reviewing donations, using existing client data ... 89
5.8
Sales and marketing ... 90
5.9
External relationships and building partnerships ... 92
5.9.1
Relations with other social enterprises ... 93
5.9.2
Opportunistic growth ... 94
5.9.3
Relationships with funders ... 94
5.9.4
Role of professional memberships and sector bodies ... 94
5.9.5
Social Enterprise Networks ... 94
5.9.6
Networking for social objectives ... 95
5.9.7
Summary of relationships ... 95
6
SE business support needs: how they are – or could be - met ... 96
6.1
Management and leadership ... 96
6.2
Strategy and planning ... 96
6.3
Governance ... 97
6.4.1
Levels of demand and levels of success ... 97
6.4.2
Loan finance ... 98
6.4.3
Finding grants ... 99
6.5
Key functional skills ... 100
6.5.1
Management accounting ... 100
6.5.2
Human resources ... 100
6.5.3
Sales and marketing ... 100
6.5.4
Improving social outcomes ... 101
6.6
External support ... 102
6.6.1
External consultants ... 102
6.6.2
Recurrent support transactions ... 103
6.6.3
Dealing with regulations ... 103
6.6.4
Business Link ... 104
6.6.5
Smaller, specialist providers ... 104
6.6.6
Other support ... 105
6.7
Putting a value on business support ... 105
6.7.1
Finance ... 105
6.7.2
Workforce & skills ... 106
6.7.3
Business planning ... 106
6.7.4
Sector specialists ... 106
6.7.5
Miscellaneous ... 106
6.8
The sector supporting itself ... 107
6.8.1
Mentors ... 108
6.8.2
Sharing skills and sharing staff ... 108
6.9
Increasing the use of business support ... 108
6.9.1
Self-diagnostics and toolkits ... 109
6.9.2
Support for planning and strategy ... 109
6.10
Broader, generalised support from the public sector ... 110
6.10.1
Adding weight to civil society status ... 110
6.10.2
Social Enterprise branding ... 110
6.10.3
Public sector funding and procurement ... 110
6.10.4
Public sector worker placements ... 111
Bibliography ... 112
Appendix 1
Telephone questionnaire ... 115
List of figures
Figure 1 A spectrum of organisational models ... 22
Figure 2 The hybrid spectrum between nonprofit and for-profit organisations ... 22
Figure 3 Sources of income generation ... 25
Figure 4 Differences in Business Support Needs for SEs ... 30
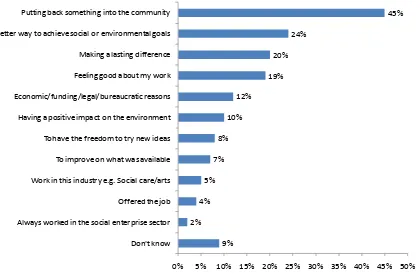
Figure 5 Motivations for setting up or working in a SE ... 43
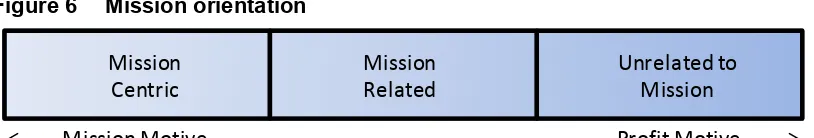
Figure 6 Mission orientation ... 44
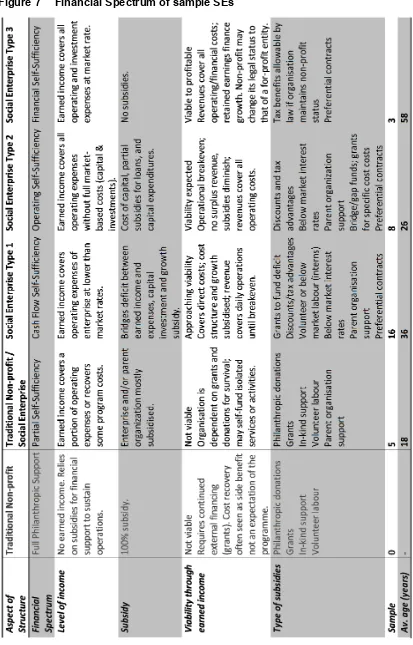
Figure 7 Financial Spectrum of sample SEs ... 46
Figure 8 Organisational/business goals and ratings ... 48
Figure 9 Board alignment and likely outcomes ... 56
Figure 10 Net Business confidence of social enterprises (by source of income) (%) ... 72
List of tables
Table 1 Comparison of standard industrial classifications ... 24
Table 2 Form in which SE began ... 24
Table 3 Sales turnover comparisons ... 26
Table 4 Employment comparisons with SMEs ... 27
Table 5 Historic growth (12 months 2009-10): Proportions of growth in employment terms 27
Table 6 SEs forecasting higher employment over the next year (%) ... 27
Table 7 Employment comparisons of SEs with Other CSOs (Full-time equivalents) (%) ... 28
Table 8 Proportions seeking general advice and information in the last 12 months... 30
Table 9 Awareness and usage of Business Link Health Checks ... 30
Table 10 Paid staff engaged in training in the last 12 months ... 59
Table 11 Aggregate year-on-year changes in key indicators for the study group ... 66
Table 12 Aggregate year-on-year change by trajectory of growth or contraction (£) ... 66
Table 13 Average ratings of research team (1-10) by trajectory of growth or contraction . 72 Table 14 Reported obstacles to business success ... 76
Table 15 Enablers and barriers for SEs (%) ... 77
Table 16 Self-reported deficiencies in management skills ... 78
Table 17 Proportion of respondents with a current business plan (n=100) ... 84
Table 18 Proportion with current business plan by origin of enterprise (n=99) ... 84
Table 19 Reasons for seeking finance ... 85
Executive Summary
Social enterprises (SEs) have been growing in number and importance to the economy; their objectives and ways of operating offer a good fit with the ethos of the Big Society – providing they can survive and flourish. The current study was designed to provide a fuller
understanding of the opportunities and challenges faced by SEs in the changing economic environment and the business support available to overcome those challenges. Findings are based on an extensive literature review, a telephone survey of 100 SEs, followed by intensive longitudinal research with 32 SEs over twelve months, exploring business experiences and support needs across that period.
• There is no single social enterprise operating model– SEs are highly differentiated; founding motivations, social missions and values are deeply embedded and highly important to the ways in which SEs operate. Though turnover is generally lower amongst SEs than SMEs, latest SBS data (2010) shows a higher proportion of SEs had increased their turnover in the previous year - 33 per cent versus 23 per cent for SMEs.
• In the study sample younger organisations explicitly formed as SEs, had business models with more clarity and greater medium term growth ambitions. No relationship could be established between actual growth across the study period and stated growth ambitions at the start. In some instances, the ethical dimension and sense of mission places limitations on the extent to which SEs can diversify or grow. Those SEs which grew were generally operating in less constrained markets, and with sufficient financial security to take risks associated with growth, while trading primarily with the public sector constrains the possibilities for many SEs and their ability to act quickly.
• The impacts of the recession and public sector funding cuts on SEs were uneven. Some had been affected very little, while others had made cost savings, redundancies or contingency plans, due to realised or anticipated drops in income. In most cases, growth plans were deferred or abandoned, with maintenance of the status quo and continuance of the service to beneficiaries taking precedence.
• SEs’ business support needs are broadly similar to other SMEs. However, their social missions and consensual decision-making processes can lead to complications in applying mainstream support products, typically geared towards increasing the wealth of the owner and/or shareholders.
• The sense of ‘not being understood’ works against SEs in the targeting and uptake of business support. SEs believe the term ‘social enterprise’ is well-understood by funders, but not by the wider public. Identification with the term and enthusiasm for it varies considerably: some are wary of using the term, in case it is taken to imply lower levels of efficiency, detracting from their wish to be seen and to compete as ‘proper businesses’.
• Broader understanding and a workable definition of the social enterprise ‘brand’ would be welcomed by most SEs but the term itself needs greater meaning. SEs reported that the Social Enterprise Mark was not widely used; they felt it was too easy to obtain and should be more thoroughly audited. Most did not seek any new or further
wanting to be recognised as ‘doing enterprise well and differently’. Larger, more business-oriented SEs thought the SE mark would be unlikely to make any difference to them, but were happy to sign up to add weight and support others in the sector.
• Recognition in the procurement process of SEs’ multiple objectives and contributions would certainly be valuable, but there was concern that some organisations would ‘qualify’ as SEs without a genuine claim. Yet establishing a genuine claim is
dependent upon demonstrating social impacts, but this is patchy in the sector. There are some shining examples but many SEs see measurement of social impacts as desirable but expensive, and it often lacks quantification and analysis. For others it is fundamental, to evaluate and plan what they do and to influence those they deal with and ‘spread the word’.
• Sales and marketing presented particular problems to some SEs. They were aware of this but did not regard it as a priority amongst their other concerns. Those
organisations with strengths in marketing stood out, proficiency and success in this area reflected in other aspects of their business. Such SEs often took their CRM further - collecting and analysing their customer data thoroughly, through websites, booking sites, visitor data and/or specific customers surveys, using it to build their customer base, target marketing and modify activities - but this was relatively rare.
• Gaps in management experience were evident in many areas, mostly in finance (financial and cost management, raising external finance and investment readiness), but also in sales and marketing and operational and strategic planning. Managers tended to receive relatively little training once in post - although many were keen to do more if the resources were available. Recently appointed managers were usually ‘outsiders’, with experience gained externally,. Their skillsets tended to differ from those of staff and they were often brought in to manage growth transitions and bring about transformations. This often necessitated cultural adjustments on both sides.
• Board functions ranged from developing fundamental strategic plans and providing practical assistance, to some with little real power or oversight, some predominantly outward facing, offering contacts and advocacy on behalf of the SE, others more inward-looking, supporting and filling gaps. Achieving the ‘right’ combination of talents was important, especially where SE management skills would benefit from being supplemented by those of board members.
• Most SEs reported that they faced little difficulty in recruiting board members; however, recruiting a different type of board member could pose greater challenges,particularly in rural and deprived areas. Very occasionally board members had failed in their basic duty to provide financial oversight. Expert training delivered directly to board members had proved very useful to a small number of SEs and could have wider beneficial effects.
to arise within the business itself, through the recruitment of new staff, or a change in emphasis for existing management.
• Below management level, internal and external training of staff was common. However, with many smaller SEs training was ad hoc, whereas larger organisations had training needs analyses and plans. Training was very price sensitive, with managers sourcing as much as possible at low cost or for free, utilising funding schemes and subsidies wherever possible.
• Volunteers are used extensively by SEs, in proportions comparable to CSOs. Estimates from NSCSE 2010 suggest 95% of SEs and CSOs use volunteers. They are regarded as an asset, but not as one-for-one equivalents for paid staff. Many are less flexible and require management and supervision support, as well as induction, training and recruitment resources.
• Many SEs have responded positively to recent economic difficulties, reviewing
business processes comprehensively and making changes and improvements across a range of areas. But some of these changes were overdue, suggesting a reactive approach to business amongst some SEs, rather than proactive, strategic planning. SE growth plans seem particularly vulnerable to exogenous influences, suggesting a need to reinforce the resilience of the sector and the accuracy of operational forecasts.
• SEs are not passive recipients of external support, many are support providers in terms of staff time, skills or mentoring to other SEs. There is a strong preference for face-to-face support, personal recommendations and those with sector-specific experience. Support takes place most frequently in peer-to-peer exchanges, between mature and less experienced SEs, and is also often business sector-specific. Some SEs even act as small-scale grant-making organisations in their own right, helping CSOs and other SEs financially, through the redistribution of surpluses.
• Many managers had or would use a mentor for support – as an effective way to improve their management style. Several had been mentors to other organisations, mainly informally, and had found it beneficial to both parties – evidence of the sector’s ability to help itself and the benefits of a shared, common understanding of the
purpose and ethos of SEs.
• Networking is popular and effective, supporting the informal exchange of information and helping to build relationships which expand the sector’s capacity to bid for contracts. Questions remain about how to draw in SEs outside current networking arrangements, in order to extend benefits and to improve the sector’s ‘offer’ to potential contractors, partners, beneficiaries and/or customers.
• There is substantial untapped goodwill in this area, as well as strong demand for support from people or organisations with SE knowledge and experience. BIS-supported Horse’s Mouth or Mentorsme are strong possibilities for finding/becoming mentors, though these were little known among our sample.
sources of support, such as accountants and solicitors, were relatively straightforward, but uptake for one-off issues or tasks is lower.
• There is wariness about mainstream and generalist providers, caused by perceptions of the variability of services provided and poor understanding of SEs. Levels of engagement were highly dependent upon the skills of individual advisors. Yet recent users of Business Link amongst sample SEs reported satisfaction with the general service, finding business skills seminars relevant and of good quality. In general, the promotion, design and delivery of business support might be more effective if it took account of differences around emphasis and terminology in the SE sector and included awareness-raising for advisors.
• Interestingly across the study period five ‘Partially self-sufficient’ SEs in the sample reported the same levels of growth ambition (like the other SEs) but all contracted (unlike the others). This group also reported the least intensive use of external business support.
• The Big Society concept was not clearly understood by SEs in the study group, although they like the idea, believing it captures much of what they already do. Many would welcome more clarity and the development of practical ideas about how they can contribute. In order to be able to make their maximum contribution and to help realise the Big Society vision SEs stressed the importance of being treated as ‘partners’ rather than ‘contractors’ – i.e. being given as much information as early as possible, and having input into planning processes.
• SEs use different sources of external finance to SMEs. Bank finance is not widely used and grants (in particular) are used to a greater degree. Our sample, and
particularly the smaller organisations, had low levels of debt, either through preference (e.g. to not risk the future of the organisation through building up debt), or prohibition through their constitution or legal form. Despite this, SEs are significantly more likely to seek finance for improving buildings, refinancing and marketing than their SME counterparts.
• SEs’ awareness was limited mainly to mainstream finance products from the high street or specialist civil society lenders), as well as CSO equivalents (Charity bank etc.). Knowledge of more novel ways of raising finance (e.g. social investment bonds, community shares, crowdsourcing) was marginal, as well as how to assess the relative merits and subsequently access the products - suggesting a skills/capability issue amongst some SEs. Some awareness-raising is necessary to build knowledge and stimulate demand for these financial products, preferably via case studies to
demonstrate the benefits and drawbacks of each.
• Most SEs agreed that in specific areas training or professional development would be useful if it was (a) free or low cost; (b) readily accessible; and (c) the benefits of
• A central website listing endorsed online grant-finding sites was considered a better solution than adding more complexity to an already crowded market (e.g.
1 Introduction
Social Enterprises (SEs) operate in almost every industry in the UK, from health and social care to renewable energy, from retail to recycling, from employment to sport, from housing to education. Amongst the most well known examples are Traidcraft, the Eden Project, Big Issue and Jamie Oliver’s Fifteen restaurants, but these represent only a small fraction of the sector.As with all businesses, SEs compete to deliver goods and services but profits are reinvested for social or environmental purposes, in the business or in the community, rather than for the benefit of shareholders and owners. SE activity itself usually takes account of additional factors in the way business is done, with many pursuing gains on a double or triple bottom line, seeking and measuring social responsibility and environmental sustainability, as well as earnings.
1.1 Policy context
1.1.1 A developing themeLike SMEs in general, SEs are capable of contributing to economic growth and job creation. However, SEs in particular provide a good fit with the government’s aim of developing the ‘Big Society’, and could play a distinctive part in relation to deficit reduction. The
government has repeatedly stressed the need to control public spending as well as to ‘modernise public services’. Modernisation involves, crucially, a move away from the assumption that public services must necessarily be provided by public sector agencies. Both the private sector and civil society organisations are being encouraged to undertake the delivery of public services, as set out in the recent Open Public Services White Paper
(2011). It is envisaged that this shift will provide substantial opportunities for SEs across a whole range of service delivery. Part of the rationale for the current study is to ensure that SEs are in the best position possible to respond to those opportunities.
During the past decade, there have been a number of initiatives to affect a step change in the role played by SEs in service delivery and in the economy more generally. In many ways it signifies a development or further iteration of the ‘Third Way’ policies of the 1997 Labour Government, which led to the formation of a Social Enterprise Unit in the DTI
(Department of Trade & Industry), subsequently subsumed into the Office of the Third Sector in the Cabinet Office in 2006. Two key policy documents were forthcomi
of SEs and in the range and number of services they were capable of delivering. The former outlined an enabling role for government, with a number of aspects (i) creating the
appropriate regulatory and legal environment; (ii) delivering support for business
1.1.2 Recent strategy
The Open Public Services Paper (2011) represents the next step, though expressed in somewhat different terms than those of the previous government, and in a very different economic context. The aspiration it describes is that SEs will bid to deliver public services and programmes previously run by central and local government. Public sector workers are to be encouraged to set up SEs or mutuals, bringing their previous experience and
knowledge to bear in the expectation that, freed from government bureaucracy (local and central), they will be more efficient, customer-focused and innovative.
The overarching vision is of a ‘Big Society’, where decisions are taken locally, individuals take more responsibility and communities do more for themselves. Under proposals in the Localism Bill 2010-11, people will have new community rights to buy local assets – and run them as SEs for the benefit of the wider community. Councils are to be provided with new powers to help save local facilities and services threatened with closure, and voluntary and community groups will have the right to challenge local authorities over their services. As yet CSOs may not have the capacity or the confidence to rise to the challenge. The coalition however, has sent out strong signals that the era of big government is unsustainable. Policy has shifted from the state as the principal and often the only provider, towards a more open, mixed economy of provision.
Access to finance for SMEs in general is already a concern and has led to the
implementation or continuation of a range of measures, such as the Enterprise Finance Guarantee (EFG) and the Project Merlin agreement with High Street banks. The intended increased role for SEs is to be facilitated, at least in part, by raising the levels of finance earmarked for CSOs, as announced i dormant accounts and £200m from Project Merlin banks, to make more investment capital – including leveraged private sector investment - available to the SE sector. Other provisions include greater use of charitable assets and endowments for investment purposes; a pilot social stock exchange; and the use of standardised methods to quantify the social value of investments. Financial advice and support will emphasise investment-readiness, in order to foster capacity and growth orientation in SEs.
The policy-making process focusing on civil society is taking place out alongside major changes in the business support environment. The government is undertaking a major programme to change the way that people running a business can access information, guidance and support. Over the current spending review period the government is:
a) Reforming the www.businesslink.gov.uk website to include both ‘My New Business’ a dedicated start-up service on the website, bringing into one place the available information for those thinking of starting or running a new business and a ‘Growth and Improvement Service’ that provides interactive and tailored tools and content that will help people who are looking to grow their business
b) Providing a new Business Link support helpline, to assist businesses who cannot find the information they need on the web or who are not connected to the internet c) Working with the British Bankers’ Association (BBA) and providers of mentoring to
d) Establishing a new Business Coaching for Growth Programme to enable SMEs with high growth potential to realise their potential, to launch from January 2012.
e) Closing the Business Link regional advisory service in November 2011.
Other business support will be provided by private sector-led Local Enterprise Partnerships (LEPs), which bring together public and private stakeholders to understand local conditions for business development and provide appropriate advice, support initiatives and
signposting, as required. This may include promoting a more entrepreneurial culture, both generally and specifically, in disadvantaged communities.
Face-to-face and more intensive publicly-funded support for business is restricted largely to (a) start-up support for the unemployed; (b) a streamlined set of Solutions for Business products (now reduced from 30 to 13), targeted at areas where there may be market failure and government intervention is seen as the most practical solution, including trade deals and new technology; and (c) support to businesses with high growth potential, delivering
specialist support which brings together finance networks with professional and business services. This has been complemented from April 2011 by the Regional Growth Fund (RGF), worth £1.4bn over three years, to create sustainable jobs and businesses and to rebalance local areas away from over-reliance on the public sector, and the Business Growth Fund, a bank-financed equity fund worth £2.5bn for viable growth-oriented businesses.
1.2 Aims of project
Speaking in March 2011 and stressing the importance of social enterprise and government’s ambitions for the sector Vince Cable, Secretary of State for Business Innovation and Skills, said
It can be difficult for those of us who deal with policy to get our heads round it [the SE sector] because there are so many different organisational forms...with social enterprise we are dealing with a whole set of different institutional structure...what we have to do in Government is to understand them and see in what ways they can be reinforced by legislation and regulation.
The current research is a two part project: the first was a Social Enterprise Barometer published in April 2010, involving a quantitative survey of 500 SEs. This, the second part, has involved qualitative research over the course of a year, with a heterogeneous set of SEs covering the variety of size, growth rates, enterprise focus, mission goals and legal
structures (including Community Interest Companies (CICs)). It was designed to provide a fuller understanding of the opportunities and challenges SEs face and to examine the availability and quality of business support to overcome those challenges. The report combines evidence from the Social Enterprise Barometer and the current qualitative study, and the comparison and contextualisation of findings with other information about business support for SEs. Data from the Social Enterprise Barometer survey is included, as is research examining support from Business Link and Solutions for Business and from a range of other organisations: Social Enterprise Coalition and Office for Civil Society.
the demand side, looking at business support needs from the perspective of SEs. The work aims to inform evidence-based policy grounded in the actuality of SEs’ experiences and needs. The study sought to identify gaps and instances of market failure in business support for SEs in a changing economic environment; how SEs have responded, where mainstream business support offerings struggle to meet the needs of the sector or to engage SEs in the first place, and whether mainstream services are appropriate or bespoke services are required for particular SEs.
To address the latter questions analysis has involved identifying the diverse needs of a highly heterogeneous sector and how or if support should be segmented to cater for these varying needs. This has included the consideration of potentially differentiating features, such as age, size, legal form, social purposes, sources of income etc. and how these relate to the support issues faced, and the sector’s capacity to resolve emerging issues internally. The study has also sought to identify specific difficulties relating to operational issues,
trading and business development, and challenges arising from transactions with customers, other businesses and government. In order to assess the scope and need for the
segmentation of business support for SEs. The research objectives have been refined to describe:
(i) How SEs understand the support environment and how they locate support for specific issues.
(ii) The internal capability and capacity of SEs to be self-supporting as a sector and their recourse to external support.
(iii) The mixture of different sources of external support, including government-sponsored support.
(iv) The business areas addressed by external support and the consequences of such intervention.
(v) The extent to which business support for SEs should be differentiated from support aimed at SMEs.
(vi) The extent to which support should be segmented across different types of SE.
1.3 Structure of the report
2 Methodology
2.1 Background and derivation of the sample
The current research project builds on the Social Enterprise Business Barometer, a
quantitative survey of 500 SEs. BIS’s Business Barometer 2010 surveyed 500 SMEs across the UK, but the subsample of SEs contained within the Business Barometer is relatively small. The Social Enterprise Barometer provides a more robust evidence base for SEs. This consisted of a telephone survey of 500 SEs conducted by IFF Research in February 2010 (the report was published in April 20101
To build on the results of the IFF survey, Durham University were commissioned to undertake an in-depth telephone survey of 100 SEs in June 2010. The sample was principally selected from respondents to the Social Enterprise Barometer Survey; non-English respondents were excluded thus reducing the usable sample from 473 to 343, of which 82 enterprises were interviewed by the Durham team. A further 20 enterprises were identified through the Social Enterprise Coalition and other umbrella organisations, leading to a total achieved sample of 102 responses.
). Their sample was drawn from the earlier Annual Small Business Survey (now the Small Business Survey or SBS), and records obtained from Dun & Bradstreet and Guidestar. The 500 interviews included 27 enterprises with no employees, resulting in an effective sample size of 473 for the report.
While there are a number of different definitions of a ‘social enterprise’ (discussed more extensively in Section 3), the definition adopted by the survey (and by this report) requires an organisation to satisfy all
(i) generates more than 25 per cent of its income from trading goods and services (earned income)
of the following criteria:
2
(ii) derives less than 75 per cent of its turnover from grants or donations (unearned income)
;
3
(iii) has mainly social and environmental aims; ;
(iv) does not pay more than 50 per cent of trading profits or surpluses to owners or shareholders;
(v) principally reinvests its surpluses in the business or the community.
2.2 Telephone survey
The telephone survey served a dual purpose: (i) to capture a greater level of detail about the characteristics of SEs, their sources of income, barriers to progress and use of business support; and (ii) to generate a shortlist of candidates to participate in the second phase of the research: an intensive longitudinal qualitative study over the course of a year. The full survey is shown in Appendix 1.
1 www.bis.gov.uk/assets/biscore/enterprise/docs/s/10-1076-social-enterprise-barometer-feb-2010 2 Earned income includes all transactions with businesses and consumers, as well as long-term contracts with public sector agencies. It will also include grants from funding bodies for the provision of specific services.
2.3 Longitudinal research
The second phase of the research aimed to involve a minimum of 25 SEs, with each to be visited five times across twelve months by a designated research team member (beginning June 2010). This sample was chosen to reflect a range of different types of SEs. The selection criteria aimed to facilitate segmentation of the sample and the identification of barriers and support needs by subgroups of SEs and included:
(i) range of sizes of SEs (micro, small and medium) (ii) at least one enterprise from each English region
(iii) a variety of sectors, including SEs with environmental aims (iv) at least three Community Interest Companies (CICs) (v) representation from Social Enterprise Coalition members
A total of 32 SEs consented to participating in the second phase of the research and five visits. This represented an oversampling of eight enterprises, as a precaution against the potential attrition of the sample across the year. A full (anonymised) list of participating organisations can be found in Appendix 2.
The use of a longitudinal study facilitated the development of a trust relationship with each enterprise, and the identification of development priorities, internal capacity and business support needs as they emerged during the course of normal operations (rather than relying on recall or speculation). This facilitated the attribution of outcomes and impacts to key influences on the SEs more precisely and to construct a more accurate narrative, related to processes underlying organisational change.
The first wave of interviews began in June 2010; subsequent visits took place at intervals of approximately two to three months. Visits provided an opportunity to build relationships with relevant personnel – usually a senior manager or Chief Executive. Subsequent interviews included other personnel as appropriate; in most cases one interview was conducted with a member of the SEs’ board (usually the Chair). A substantial body of company literature (business plans and longer-term strategies, financial and social accounts, annual reports and publicity materials) was obtained from each enterprise to provide context and
supplementary information.
Interviews were semi-structured, and covered:
(i) The overall objectives of the business, as defined by interviewees, how targets were set and reviewed (including, for example, the use of KPIs and social accounts).
(ii) Strategic trading objectives, covering future plans (e.g. employment growth, diversification into new markets) and social objectives, with respect to how they related to and interacted with trading activity.
(iv) Governance and the interaction of the management team and the board (if relevant). This covered the recruitment and selection of board
members/trustees, their roles and the emphasis of trustees’ priorities in relation to business or social objectives.
(v) Operational issues covering financial management; access to finance; fundraising; sustainability; human resources; use of volunteers; skills and training; ICT; marketing and communications; quality and contracting out. (vi) Business support and SE sector’s internal capacity to overcome barriers.
This covered the extent of recourse to external support, formal and informal; support agencies, experts such as accountants and solicitors; the use of peer support, and accessing the expertise on the board. Consideration included the self-awareness of the sampled SEs - if the organisations were capable of assessing the need for external support, along with other barriers, such as awareness of or how to access support.
(vii) The future of the organisation, expressed in terms of continuity for the
business or for the social and/or business activities it undertook. This covered plans for growth, possible mergers or divestment of activity, or diversification. Subsequent sessions provided updates in the areas above and followed live issues
emerging in earlier sessions and progress towards their resolution. New issues were also explored, allowing a ‘diary’ of events to be constructed, focusing on business issues arising across the study period, the deployment of internal or external solutions, and general reflections on the progress of enterprises.
Throughout the sessions, specific questions were also used in relation to:
(i) the relevance of the term ‘social enterprise’ to interviewees and the desirability of accreditation and recognition of organisations as ‘social enterprises’ (e.g. through kitemarks)
(ii) the direct and indirect effects of public sector reorganisation and budget cuts (iii) how the SEs have given support to other organisations themselves (e.g. as
mentors)
(iv) sample SEs participation in the ‘Big Society’ and what the term means to them Interviews with board members provided a fuller perspective and were used to corroborate the views of management and test the extent to which vision and values were shared across organisations. These interviews also presented the opportunity for the adequacy of the governance function itself to be considered, including whether support specifically aimed at board members would be appropriate.
3 Literature Review: Social Enterprise, what defines the sector?
As stated in Section 1 the purpose of the current research is to provide a fullerunderstanding of the opportunities and challenges faced by SEs, and to examine the availability and quality of business support to help overcome those challenges. In order to achieve those objectives greater clarity is needed about what defines social enterprises and the sector as a whole. SEs are commonly regarded as different from both for-profit and not-for-profit organisations but more precise definitions are important for a number of reasons:
• to identify which enterprises are to be considered by the study and derive from those enterprises the pertinent issues to be considered;
• in order to ascertain the size of the sector and therefore the resource implications of support needs;
• significance to representative bodies in the sector, making clearer what it is they represent and as a result strengthening their authority to act as a voice; and
• qualifying (or disqualifying) individual organisations for access to support services, grant funding and loans.
3.1 Characteristics, conceptual models and size of the sector
While the precise wording of SE definitions adopted by academics and practitioners is not always in agreement, the following four characteristics, drawn from a study of SEs by Defourny (2004) across 15 EU countries occur most frequently:
(i) A high degree of autonomy
(ii) Activities include paid work – even a minimal amount (iii) An explicit aim to benefit the community
(iv) Decision-making power not based on capital ownership
The following two characteristics, also proposed by Defourny, occur in several definitions but are actively contested by other studies:
(v) The level of economic risk SEs encounter – though this may also be common to many Civil Society Organisations (CSOs) facing uncertain levels of
donations
(vi) Citizens are the engine for creating SEs, - thereby excluding transitions of former public or private sector organisations (including charities) into SEs. 3.1.1 Conceptual models
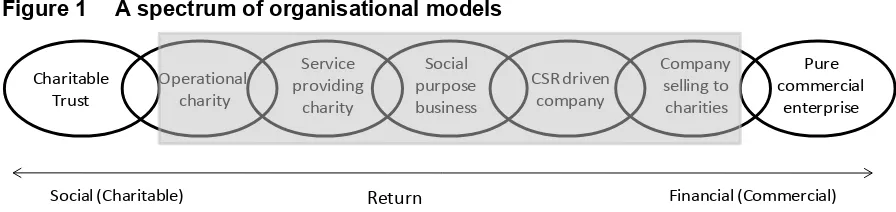
Figure 1 A spectrum of organisational models
Charitable
Trust Operationalcharity
Service providing charity CSR driven company Company selling to charities Pure commercial enterprise Social purpose business
Social (Charitable) Return Financial (Commercial) Source: Adapted from Bolton et al (2007)
Alter’s (2007) conceptual model (Figure 2) is similar, but places more emphasis on the social rather than financial outcomes. This schema is somewhat clearer however, locating SEs as distinct from both nonprofits with income-generating activities and from ‘socially responsible’ businesses.
Figure 2 The hybrid spectrum between nonprofit and for-profit organisations
Traditional nonprofit Nonprofit with income generating activities Social Enterprise Socially responsible business Corporation practising social responsibility Traditional for-profit Profit-making motive Shareholder accountability
Profit redistributed to shareholders Mission motive
Stakeholder accountability Income reinvested in social programmes or operational costs
Hybrid spectrum
Source: Alter (2007)
3.1.2 Definition used by current study
The definition of a ‘social enterprise’ adopted by the current study is that adopted by the SBS and requires that all
The business must
the following criteria be satisfied:
• generate more than 25 per cent of its income from trading goods and services (earned income);
• derive less than 75 per cent of its turnover from grants or donations;
• have mainly social and environmental aims;
• not pay above 50 per cent of trading profits or surpluses to owners or shareholders;
• principally reinvest its surpluses in the business or the community.
This BIS definition suffers from a relative weakness, in terms of distinguishing between those SEs which are growing and those which may be failing: the relatively low 25 per cent
[image:22.595.71.519.74.180.2] [image:22.595.74.526.284.464.2]3.1.3 Size of SE sector
Lyon et al (2010) report that major UK surveys use different methods and datasets to select their samples4
Almost half of CSOs (48 per cent) satisfy the less stringent BIS definition of SEs (25 per cent earned income). Using the narrower criteria (50 per cent of income earned through trading and 50 per cent of surplus used for social or environmental goals) just 8,500 of the CSO population can be described as SEs. Lyon et al (2010) suggest a methodological problem here in that the profit question discounts those organisations which only broke even or registered a loss. They suggest a truer figure for the number of CSOs which could be classified as SEs is probably closer to16,400.
but also observe that the most quoted figures derive from BIS’s Small Business Survey. The 2010 survey suggests a SE population of 68,000 organisations with employees, although many of these may in fact be purely private sector organisations.
There are some problems: the weakness of such surveys is that they are based on self-declarations of having social or environmental objectives and therefore open to considerable interpretation; debate about the validity of including SEs with sports or cultural purposes; how trading with the public sector is understood - some exclude this from their reporting of earned income.
3.2 Distinguishing SEs from SMEs and Other CSOs
This section explores further the characteristics of SEs, in order to better understand how SEs differ from SMEs and Other CSOs. This provides an indication of the areas where SEs may require differentiated support, due to the different contexts in which they operate and the various goals they are pursuing. Data has been taken from BIS’s Business Barometer and Social Enterprise Barometer (both from February 2010) and the 2010 Small Business Survey (SBS), supplemented by the SEC’s State of Social Enterprise 2009 (SOSE) and Fightback Britain (2011) and the National Survey of Charities and Social Enterprises (NSCSE) for 2008 and 2010. All figures relate to organisations with fewer than 250 employees.
3.2.1 Sectoral
SEs are more likely than SMES to be involved in community development or mutual aid, culture & leisure, economic well-being, accommodation and training activities, and the delivery of public services.
BIS data shows that SEs are represented across all the major business sectors, though their sectoral distribution differs from that of SMEs as a whole (Table 1). Large numbers of SEs are found within the primary industries (mainly agriculture), while there is a very low
proportion in manufacturing.
The proportion in wholesale, retail, hotels & catering is very similar for SEs and SMEs (around 20 per cent) and there is generally high representationin ‘people-orientated’ businesses. This is particularly the case in health and social work, plus other community, social and personal activities; both of which have triple the representation of SMEs (17 per
cent), and represent just over 40 per cent of all SEs. This pattern is broadly corroborated by NSCSE. The greatest differences are found in business services and other services. SEs are under-represented in the former (11 per cent or around 1 in 10, compared with 30 per cent or 1 in 3 SMEs).
Table 1 Comparison of standard industrial classifications
Standard Industrial Classification SEs % Other SMEs %
Primary 8.8% 5.1%
Production 1.4% 12.1%
Construction 8.3% 12.7%
Wholesale, retail, hotels & catering 20.5% 19.6% Transport, storage and communication 8.1% 2.9%
Business services 10.8% 30.2%
Other services 42.1% 17.4%
Source: SBS 2010 (weighted)
Compared to Other CSOs, SEs are more likely to be involved in community
development/mutual aid, culture/leisure, economic well-being, accommodation and training activities, and less likely to be involved in international development and faith-based
activities. SEs are also substantially more likely to be involved in the delivery of public services (29 per cent, against 19 per cent of Other CSOs).
3.2.2 Origins
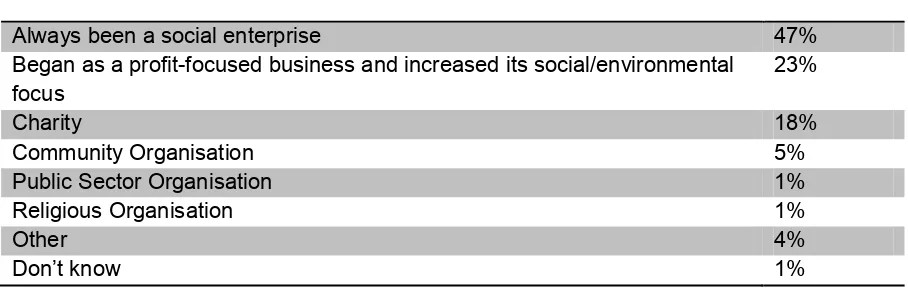
The origins of SEs – how they came to be formed, their background and its legacy, often influence how SEs operate today, as well as how and where they would seek or accept business support. The Social Enterprise Barometer looked at how SEs began (Table 2). Almost half reported that their organisations started as SEs. A further quarter began as profit-focused businesses and almost one in five as charities. Relatively few emerged from the public sector or from religious organisations, although some regard this as an inherent bias of SBS and other BIS surveys, which privilege ‘businesses’ over CSOs in their wider form(s).
Table 2 Form in which SE began
Always been a social enterprise 47%
Began as a profit-focused business and increased its social/environmental
focus 23%
Charity 18%
Community Organisation 5%
Public Sector Organisation 1%
Religious Organisation 1%
Other 4%
Don’t know 1%
[image:24.595.66.520.573.717.2]3.2.3 Sources of income
SEs are motivated by different concerns to SMEs (e.g. social and environmental goals) and operate different business models in order to address those goals. These, along with
constraints derived from how and why they have been set up (and the wish to remain faithful to those original aims and objectives) mean that SEs are not always ‘free’ to take
commercial decisions. This can impact upon how they do business and potential sources of business support: some are fundamentally constrained in their ability to reduce
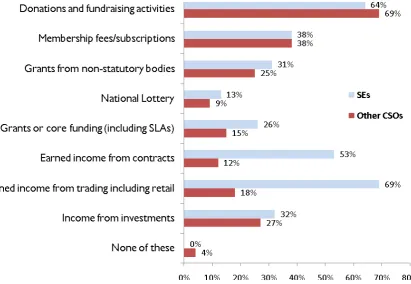
grant-dependency, whereas others adopt more market-orientated models from their inception. Figure 3 Sources of income generation
Source: NCSCE (2010) Multiple answers permitted.
As Figure 3 shows, SEs have broadly similar income profiles to Other CSOs. The critical areas of divergence are ‘earned income from contracts’ and ‘earned income from trading’: where a far greater proportion of SEs are active compared to Other CSOs (four times as frequently in both cases).
The increasing proportion of SEs reporting donations and fundraising as a source of income since 2008 is of note: while the percentage of Other CSOs reporting this remained the same (69 per cent). While other sources of income remained broadly the same, 64 per cent of SEs reported donations and fundraising as an income source in 2010 versus 57 per cent in 2008 – an increase of around 12%. The Social Enterprise Barometer records similar findings to NSCSE with regard to donations, with 46 per cent of organisations receiving private donations and 18 per cent from corporate sources. Membership fees and
subscription income demonstrate a difference, recorded by only 3 per cent in the Barometer, suggesting that the Barometer’s sampling frame may omit clubs and societies. The
[image:25.595.94.506.224.508.2]among organisations of each particular form of income generation, not the amount derived which may well reveal a different picture.
3.2.4 Turnover
Though turnover amongst SEs is generally lower than that of SMEs, latest SBS data (2010) shows a higher proportion of SEs had increased turnover in the previous year - 33 per cent versus 23 per cent for SMEs.
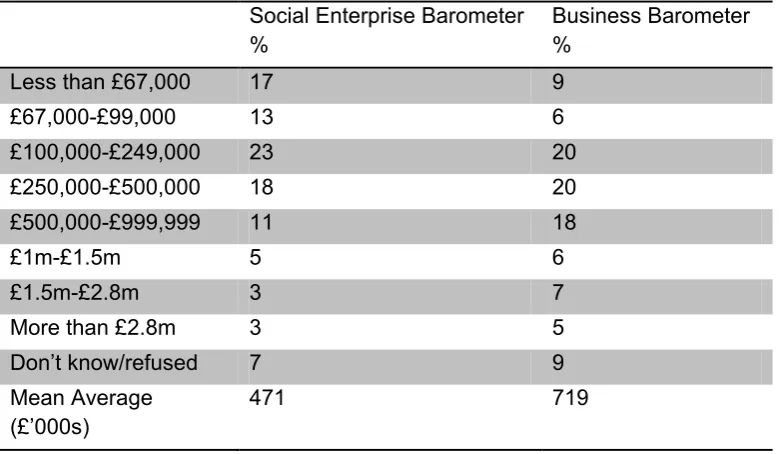
According to the Social Enterprise Barometer (2010) the mean annual turnover of SEs was £471,000 - substantially lower and two-thirds of the average for SMEs (£719,000). Twice as large a proportion of SEs as SMEs earned less than £99,000 (30 per cent and 15 per cent respectively). This may be related to the business sectors in which SEs tend to operate i.e. those offering relatively low rates of income (e.g. social work) and SEs more frequent use of trading models producing lower turnover. At the other extreme the representation of SEs with an income over £1m was over half that of SMEs (11 per cent and 18 per cent
[image:26.595.67.458.354.581.2]respectively) (Table 3). Looking at civil society, NSCSE figures show that SEs have a higher turnover than Other CSOs (NSCSE 2009). While the median income for SEs is in the £100-250,000 bracket, for Other CSOs it is between £10,000 and £25,000.
Table 3 Sales turnover comparisons
Social Enterprise Barometer
% Business Barometer %
Less than £67,000 17 9
£67,000-£99,000 13 6
£100,000-£249,000 23 20
£250,000-£500,000 18 20
£500,000-£999,999 11 18
£1m-£1.5m 5 6
£1.5m-£2.8m 3 7
More than £2.8m 3 5
Don’t know/refused 7 9
Mean Average
(£’000s) 471 719
Source: Social Enterprise Barometer (2010)
Taken together, figures for staffing and turnover imply that SEs are more labour intensive than SMEs, requiring higher average levels of employment for a lower average turnover. The pursuit by SEs of multiple goals or outcomes, rather than bottom line gains alone may be worth bearing in mind here, along with the earlier point, about the impact the use of volunteers can have on staff resources and thereby on productivity. However, not all SEs operate their enterprising activities in this way and the pattern may be changing.
3.2.5 Employment
[image:27.595.74.517.159.253.2]On average, SEs have higher employment levels than SMEs or CSOs5
Table 4
. The proportion of micro-businesses is significantly lower and the proportion of small businesses is significantly higher ( ).
Table 4 Employment comparisons with SMEs Social Enterprise
Barometer Business Barometer
Micro-businesses (1-9 employees) 78 84
Small businesses (10-49 employees) 19 14
Medium businesses (50-249
employees) 3 2
Source: Social Enterprise Barometer (2010)
Figs in bold statistically significant at 95% confidence level between the two surveys.
[image:27.595.64.515.374.441.2]Not only are SEs likely to be larger in employment terms but there are indications of higher levels of growth in employment. A slightly higher proportion of SEs than SMEs reported increased employment in 2009-10 (Table 5), and fewer had contracted.
Table 5 Historic growth (12 months 2009-10): Proportions of growth in employment terms
All Micro Small Medium
Social Enterprise
Barometer 18 14 30 43
Business Barometer 16 15 24 34
Source: Social Enterprise Barometer (2010)
Figs in bold statistically significant at 95% confidence level against overall survey findings
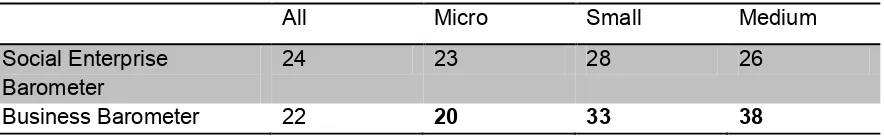
[image:27.595.71.513.576.644.2]We should be careful about placing too much weight upon this comparison – it could be related to trends in the specific sectors where SEs operate more frequently, rather than differences between SEs and the general business population. Nevertheless, this trend of higher levels of reported employment growth was projected to continue into 2010-11 (Table 6) among micro SEs, though not small or medium-sized organisations.
Table 6 SEs forecasting higher employment over the next year (%)
All Micro Small Medium
Social Enterprise
Barometer 24 23 28 26
Business Barometer 22 20 33 38
Source: Social Enterprise Barometer (2010)
Figs in bold statistically significant at 95% confidence level against overall survey findings
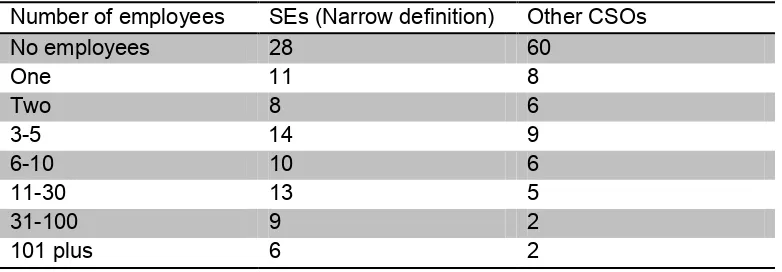
SEs are more likely to be an employer than Other CSOs (Table 7). Only 28 per cent of SEs had no employees, compared with 60 per cent of CSOs, and they are over-represented in each of the small, medium and large categories, compared to SMEs and CSOs.
Table 7 Employment comparisons of SEs with Other CSOs (Full-time equivalents) (%)
Number of employees SEs (Narrow definition) Other CSOs
No employees 28 60
One 11 8
Two 8 6
3-5 14 9
6-10 10 6
11-30 13 5
31-100 9 2
101 plus 6 2
Source: NSCSE (2008)
3.2.6 Volunteers
In making comparisons between SEs, Other CSOs and SMEs, volunteer numbers cannot be included wholesale in the headcount or to calculate productivity.
As might be expected, another point of difference between SEs and SMEs is the use of volunteers, with SEs employing a volunteer labour force comparable to Other CSOs and certainly no smaller. Some 8 per cent of SEs have no volunteers, while 66 per cent have 1-20, compared to 7 and 71 per cent respectively for Other CSOs (NSCSE 2010). This
broadly suggests that SEs are likely to have similar issues and priorities surrounding the use of volunteers (recruitment, training, management etc) as other civil society organisations, although the precise details of how they deploy volunteers may differ. SOSE (2009)
reported that 70 per cent of survey respondents used volunteers in their businesses. Some deploy volunteers as direct substitutes for paid labour to operate core services - potentially useful in financially constrained organisations. Others use volunteers more sparingly and sporadically, often in specific areas of the business or in roles that do not fully compensate for paid staff.
Some SEs provide volunteering opportunities to help people improve their employability, and the SEs are sometimes (but not always) paid for this by, for instance, JCP, DWP or a local authority. As different waves or cohorts move through organisations productivity can be affected until volunteers reach reasonable levels of proficiency – at which point they may well move on. Grossman and Furano (2002) identify three management inputs as crucial to the success of volunteering: screening potential volunteers to ensure appropriate entry and placement in the organisation; orientation and training to provide volunteers with the
withdraw, potentially damaging recipients of services in the process."6
3.3 The need for business support
Thus the needs of volunteers can mean that, rather than contributing to staff cover, they actually require significant inputs of staff time. Many SEs see this as part of their social role – to provide volunteering opportunities – even though at times it may detract from the resources they are able to devote to their core business.
In general terms, the market failures which affect the demand for and take up of business support by SMEs are well understood7, the main ones being the result of information failure.
Some SMEs do not recognise the value of externally provided advice and support. In some cases there appears to be a lack of self awareness in terms of recognising and identifying their own support needs. Some do not know how or where to access support. Others are unable or unwilling to pay for such support. All of these failures tend to be asymmetrical; that is they tend to be most prevalent and most important in smaller businesses with fewer resources and less ability to pay8
In this section we look at evidence of business support use by SEs, contrasted with the usage patterns of SMEs – evidence based on what they actually do and, amongst other factors, shaped by the supply of business support – what’s available to SEs. We then go on to look at evidence describing the business support needs of SEs as perceived by the supply side – the business support providers. Finally we consider how a demand-led approach might be adopted by support agencies.
. One of the key research questions is the extent to which SEs are the same as other SMEs in these respects and to identify any ways in which they differ.
3.3.1 SE use of business support
While they do not address issues relating to support requirements nor the extent of SEs internal capability and capacity for problem-solving and growth, several surveys provide indications of the extent of use of support by SEs compared with other SMEs. The Small Business Survey (2010)9
The Social Enterprise Barometer indicates that SEs across all sizebands are actually more likely to seek advice and information (of any kind) than SMEs (
indicates few significant differences between SEs and other SMEs in terms of their propensity to seek advice and support, the type of advice and support sought and source(s) used.
Table 8). Interestingly while they are less likely to be aware of Business Link Health Check, SEs are slightly more likely than SMEs to have made use of the initiative (Table 9). This is consistent with the findings of Nairne et al (2010b) in their study of the business support experiences of SEs: having actually accessed the service, approximately three-quarters of the SEs surveyed found the Business Link service was appropriate to their needs; dissatisfaction tended to centre around the service being too generic.
6 Grossman J and Furano K (2002) Making the Most of Volunteers. Public/Private Ventures. Available at
7 See, for example,
8 See, for example,
Table 8 Proportions seeking general advice and information in the last 12 months
All Micro Small Medium
SEs 45 43 55 54
SMEs 30 28 37 41
Source: Social Enterprise Barometer (2010)
[image:30.595.69.534.188.267.2]Figs in bold statistically significant at 95% confidence level against overall survey findings
Table 9 Awareness and usage of Business Link Health Checks
All Micro Small Medium
SEs - aware of Health Check 58 56 70 52
SEs - used Health Check 17 16 23 6
SMEs - aware of Health Check 70 69 78 74
SMEs - used Health Check 13 12 16 18
Source: Social Enterprise Barometer (2010)
Figs in bold statistically significant at 95% confidence level against overall survey findings
3.4 Supply-side diagnosis of SE business support needs
3.4.1 Engagement and terminologyThe 2010 OTS evaluation of the SE business support improvement programme is broken down into two reports, one looking at the supply-side (Nairne et al, 2010a), the other at demand (Nairne et al, 2010b). A third, final report has been published subsequently Business Support for Social Enterprises: National Evaluation (Nairne et al, 2011) drawing the evidence together and setting findings in the context of the coalition Government, elected in May 201010
The supply-side survey of respondents from RDAs, Business Links and regional SE Networks (Nairne et al, 2010a) indicated a broad perception that, apart from a few specific areas, SE support needs were similar to those of other businesses, but that the engagement strategy and vocabulary (rather than content) need to be different.
.
Figure 4 below lists the specific areas reported by Nairne et al (2010a) where supply-side stakeholders consider the support needs of SEs to be ‘different’ from other SMEs.
Figure 4 Differences in Business Support Needs for SEs
Legal and governance structures Understanding the drivers of business formation
Linking social and commercial objectives Management arrangements
Distributing surpluses Presentation and vocabulary
Managing assets Approaches to marketing
Managing volunteers Involvement in diverse activities
Lack of commercial expertise Close working relationships with advisers
Source: Nairne et al (2010a)
3.4.2 Emphasis on start-ups
An examination of supply and demand in the South West (Roger Tym & Partners, 2006) concluded that support for SEs tended to concentrate on start-up rather than the
development of existing organisations, and that the capacity to understand and respond to
[image:30.595.65.528.562.668.2]social enterprise needs varied substantially, indicating that enhanced CPD would be helpful (also recommended by Lyon et al, 2005 and Hynes, 2009). Stakeholders in general felt that SEs required more ‘hand-holding’, particularly in the start-up phase (Nairne et al, 2010a). 3.4.3 Ability to pay
Nairne et al (2010a) reported that SEs faced greater difficulties in (or were more reluctant about the prospect of) paying for support than other SMEs; again, this was most acute during start-up and early development. In some areas there have been attempts to address this through vouchers, but this has met with mixed success, with no clear conclusions on the correct value of vouchers or the proportion of costs payable by the client. Moving away from grant dependency was also regarded as important and SEs needed help to commercially exploit markets for products or services, as well as to undertake market research to facilitate the move (Hynes, 2009).
3.4.4 Appropriate models of support
Specialist SE support has evolved in a piecemeal, organic manner over the course of many years (GHK, 2005;Rocket Science UK, 2007; Taylor and Hämeenaho, 2005; Lyon et al, 2005) with organisations emerging as a result of particular funding streams or initiatives in an ‘unjoined-up’ manner. This led to variability in coverage, quality and links to other business support, resulting in a movement towards mainstreaming support through the Business Link IDB model, and launching more specific initiatives aimed at SEs (as laid out in the 2006 Social Enterprise Action Plan), with a recognition of the increasing importance of the sector in contributing towards key targets on social cohesion.
Amongst providers (along with SEs and their umbrella bodies) there is recognition that the IDB model of support is not readily applicable to SEs, given (a) the need for greater proactivity; (b) the complex support landscape; (c) the longer-term developmental support required by SEs emerging from small-scale community and voluntary programmes or regeneration initiatives; and (d) the larger number of stakeholders involved in start-up and development of a SE. On this point however, Guild
for SEEM (2005) notes that the IDB model is more applicable to mature trading SEs rather than those in the start-up or pre-start phases, suggesting that the journey to marketisation is the key phase when SEs need distinctive, intensive support. Once the appropriate trading model has been identified and operationalised, support needs are thought by suppliers to converge more towards those of other SMEs, though still remaining distinct in some ways.
3.5 Factors influencing demand
The literature generally approaches business support for SEs from the supply-side i.e. considering the effectiveness and appropriateness of support that is available or has been delivered (Hines, 2005), rather than looking at support needs from an organic, bottom-up demand perspective. In her study based on 30 organisations, Phillips (2006) examined the business support SEs require – from the demand side and as distinct from other types of organisation. Her study concentrated on growth and more ‘business-focused’ SEs. Even within such parameters, Philips found
This leads Philips (2006) to conclude that any promotion of a growth strategy for SEs based on greater degree of marketisation ‘would be resisted’. Philips suggests that, in part at least, this would derive from a sense of not being properly understood and of being different, but also that the standard means for achieving growth, such as aggressive marketing, increased efficiency, flexibility, cost-cutting and focusing on top revenue earning activities would
compromise the qualities which SEs regard as distinguishing them from mainstream businesses. The result is that, unassisted, a social enterprise may well be inherently less able to diversify its products or enter new markets than an SME, due to the constraints of its social mission.
3.5.1 Lack of self awareness in the sector
The sector’s own ability to recognise and diagnose its’ own support needs is crucial if appropriate help is to be identified and supplied. Rocket Science UK (2006) reports a clear deficiency in marketing skills and capacity among their sample of Scottish SEs, particularly at a strategic level. Some of this is judged to be based on a lack of self awareness in the sector: Lyon et al (2005) found an unperceived gap for support in terms of the
demonstration of social impact. This could be crucial in raising income, particularly winning public service delivery contracts and from new customers attracted by success stories. Bull and Crompton (2006) note that SEs in their sample were slow to market the USP differentiating them from mainstream SMEs, namely their social benefits. In some ways there is reluctance, such as already raised by Philips (2006); marketing is often seen as counter-cultural and synonymous with promotion, thereby dispensing with its strategic value and the market positioning effective marketing could bring. It may be that individual SEs are not best placed to convey the totality of the message about the sector’s distinctiveness in how and why they do business.
3.5.2 SE perceptions of business support
While the barriers to business growth faced by SEs are, broadly, very similar to those faced by SMEs, the commitment to a cause can exacerbate and/or raise those barriers. Phillips (2006) emphasises the social enterprise sense of difference and complexity, relative to mainstream business, and reviewing a number of sources, the
widespread perception [amongst SEs] that the usual sources of business support, including Business Link, do not unde