Evaluation of the Pupil Deprivation Grant
Final report - December 2017
Mae’r ddogfen yma hefyd ar gael yn Gymraeg.
This document is also available in Welsh. SOCIAL RESEARCH NUMBER: 77/2017
Evaluation of the Pupil Deprivation Grant - Final report
December 2017
Julia Pye, Lucy Lindley (Ipsos MORI)
Chris Taylor, Daniel Evans
(WISERD)
Katy Huxley
(
Administrative Data Research Centre – Wales
)
Views expressed in this report are those of the researcher and not necessarily those of the Welsh Government
For further information please contact: David Roberts
Social Research and Information Division Welsh Government
Sarn Mynach
Llandudno Junction LL31 9RZ
0300 062 5485
Table of contents
1. Executive summary 4
2. Introduction 14
3. Inputs 19
4. Management of the Pupil Deprivation Grant 27
5. Activities 41
6. Outputs 55
7. Impact analysis 65
List of tables
Table 1.1. Key findings from analysis of National Pupil Database ... 13
Table 3.1 Key policy changes since the introduction of the Pupil Deprivation Grant... 19
Table 5.1 Staff training and development involved in delivery of main PDG interventions (showing top six responses) ... 46
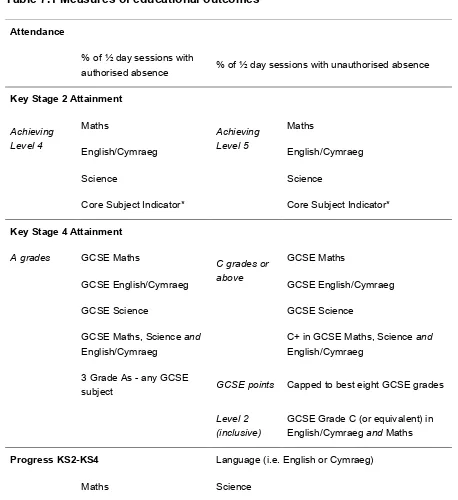
Table 7.1 Measures of educational outcomes ... 66
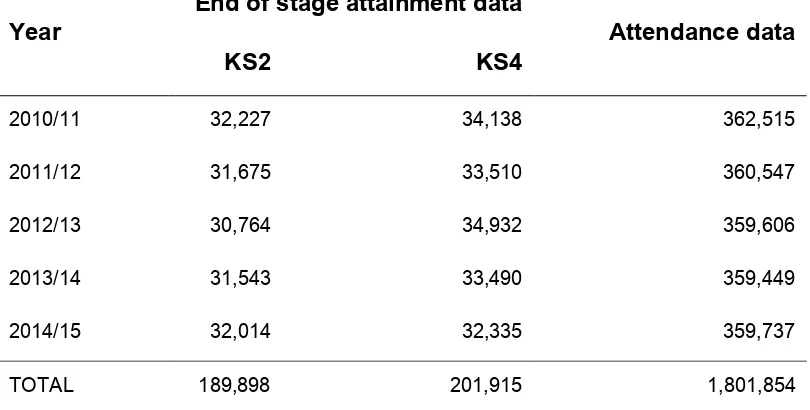
Table 7.2 Number of pupils available for analyses of educational attainment by year ... 68
Table 7.3. Number of pupils used in the analysis of attendance by Year Group ... 69
Table 7.4. Absence by year (all ages) ... 70
Table 7.5. Change in the proportion of sessions with absence (all ages) ... 71
Table 7.6 Unauthorised absence by year (all ages) ... 72
Table 7.7 Change in the proportion of sessions with unauthorised absence (all ages)... 72
Table 7.8 Persistent absence by year (all ages) ... 73
Table 7.9 Change in the proportion of pupils with persistent absence ... 73
Table 7.10 Achieving Level 4 or above in Key Stage 2 Maths ... 74
Table 7.11 Achieving Level 4 or above in Key Stage 2 English or Welsh ... 75
Table 7.12 Achieving Level 4 or above in Key Stage 2 Science ... 75
Table 7.13 Achieving Level 4 or above in Key Stage 2 Maths, English/Welsh and Science 76 Table 7.14 Achieving GCSE Maths Grade C or above ... 78
Table 7.15 Achieving GCSE English or Welsh Grade C or above ... 79
Table 7.16 Achieving GCSE Science Grade C or above ... 79
Table 7.17 Achieving Grade C or above in GCSE Maths, English/Welsh and Science ... 80
Table 7.18 Relative change in the proportion of pupils achieving Grades C or above in ‘core’ GCSE subjects ... 81
Table 7.19 Achieving Level 2 (inclusive) ... 82
Table 7.20 Relative achievement of all Year 11 KS4 pupils (unless specified otherwise) in GCSE and BTEC Science, 2015 ... 85
Table 7.21 Relative progress in Maths between Key Stage 2 and GCSE ... 87
Table 7.22 Relative progress in English/Welsh between Key Stage 2 and GCSE ... 87
Table 7.23 Relative progress in Science between Key Stage 2 and GCSE ... 88
List of figures
Figure 4.2 Groups targeted by PDG-funded initiatives... 34 Figure 4.3 Evidence used by schools when planning how to spend the Pupil Deprivation
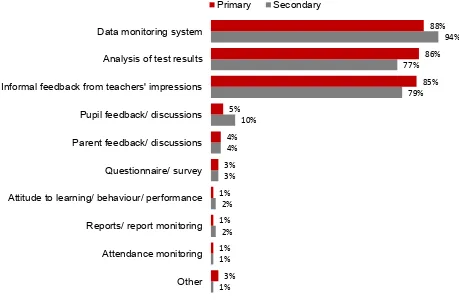
Grant (unprompted responses) ... 36 Figure 6.1 How schools measure the impact of PDG ... 56 Figure 6.2 Sustainability of PDG-funded interventions ... 63 Figure 7.1 Relative achievement of eFSM pupils compared to non-FSM pupils by KS2
subject ... 76 Figure 7.2 Relative achievement of eFSM pupils compared to non-FSM pupils achieving
grade C or above by GCSE subject ... 80 Figure 7.3 Relative achievement of eFSM pupils compared to non-FSM pupils achieving
1.
Executive summary
1.1 Ipsos MORI and WISERD were commissioned by the Welsh Government in April 2013 to conduct a process and impact evaluation of the Pupil Deprivation Grant (PDG). The PDG was launched in 2012 and provides additional funding to schools based on the number of pupils on their roll eligible for Free School Meals (eFSM) or who are Looked After Children (LAC). Schools are provided with funding per eFSM pupil, and are directed to spend the additional funds on evidence-based
interventions to help close the attainment gap. The evaluation aims to understand how the grant is being used by schools, and its impact on eFSM pupils.
1.2 This report is based on the third and final year of evaluation activity, and focuses on reporting on in-depth case studies with 22 schools conducted in 2013/14 and
2014/15, and follow-up visits to 14 of these schools in 2015/16 allowing for
consideration of progress made or change in approach that may have occurred in the meantime. The report also contains findings from an analysis of data from the National Pupil Database conducted in 2015. Where relevant, we refer to findings from a survey of 201 schools conducted in 2014 during the first year of the
evaluation. In March 2017 the PDG was renamed the Pupil Development Grant1.
Key findings
1.3 When considering this analysis, it is important to bear in mind that the PDG is a relatively recent (and with regard to schools being able to plan for future spending; short term) grant aiming to effect improvements on a long-standing and large attainment gap. Evidence from case study schools highlights that a longer-term view of pupils’ progress is essential in evaluating the effectiveness of the grant; and that systems to tackle disadvantage will continue to evolve over time. In March 2017 the Welsh Government announced that the grant would be guaranteed until the end of the current Assembly term.2
Inputs
1.4 PDG represents a significant source of funding for schools to invest in approaches to tackle disadvantage and is considered an ‘invaluable’ source of funding for specific types of activity to reduce the attainment gap. Schools often pool PDG
funds with other funds and general school budgets; as such, as a part of the full suite of funding provided to schools the impact of the PDG is reliant on the
existence of other funding streams with similar or complementary aims. The PDG involves significant financial inputs from the Welsh Government; staff and resource inputs from local authorities (LAs) and regional education consortia (REC) which support and challenge schools in their spending of the grant; and from schools themselves. Survey evidence shows that schools top up the funding used to run PDG activities from their own budgets and/or other funding streams by substantial amounts3. Schools’ contributions were significant, representing 50-100% of the Government PDG allocation; more recent qualitative work among a smaller sample suggests that schools continue to supplement the PDG in this way, pooling funding from grants with complementary aims.
1.5 Local support has helped in forming effective regional partnerships; Challenge Advisors are helping to inform school leaders but the evaluation found little evidence of the ‘challenge’ role in practice. Schools found the guidance received from the Welsh Government, their LAs and regional consortia helpful in guiding their spending. There is evidence in more recent case studies of significantly more
regional partnership activity that has been instigated by consortia, LAs and schools. This included the pooling of PDG funds across local school networks, information- and evidence-sharing sessions to share information about practices used in effective schools, and in one case a whole-cluster literacy and numeracy strategy. Case study schools welcomed the opportunity to discuss plans with Regional Challenge Advisors; while some schools mentioned the Advisors introducing them to new sources of evidence to inform their PDG planning (including the Sutton Trust Toolkit), none of the case study schools reported that the input from Advisors had changed their PDG spending decisions. Notably, the support that Advisors provide to schools to close the gap varies by region, and by the category of the school4. Given that some schools do not make full use of the most cost-effective initiatives to close the gap, there may be scope for Advisors to further develop their mechanisms for challenging school strategies and spending.
3 The survey of schools conducted in 2014 found that around nine in ten schools (86% primary, 91% secondary) supplemented the funding of PDG-funded activities, usually from the general school budget and/or the Schools Effectiveness Grant. Primary schools on average added £10,240 from other funds, and secondary schools added an average £44,356. Considering this in the context of the value of the PDG funding for schools: primary schools received an average of £12,676, and secondary schools an average £61,311 in PDG funding in 2012-13.
Management of the PDG
1.6 Some schools continue to use their own discretion in applying broader definitions of disadvantage or deprivation to target activities than eFSM status alone. As a result, the overall impact of the PDG specifically on eFSM pupils’ outcomes could be diluted as schools target interventions to counter ‘disadvantage’ more broadly. Schools understand the stated WG aim that the PDG is intended to benefit disadvantaged pupils, however case study schools considered eFSM status as a proxy used by government as a way of distributing funds. When deciding on how to spend the funds they use a much broader definition of disadvantage that
encompasses other factors such as home circumstances and other measures of socio-economic disadvantage. Case study schools were using sophisticated
tracking systems alongside their own knowledge of pupils’ circumstances to identify pupils they considered disadvantaged and/or in need of targeted additional support. Decisions about providing additional support were often made on a pupil-by-pupil basis, with the relative weighting given to eFSM status varying widely between schools. Schools that had the best track records in closing the gap explained that eFSM had been a priority for them prior to the PDG. A few other schools explained that the PDG had helped to prioritise the role of schools in tackling pupil
disadvantage, and that eFSM had become more significant in their decisions about targeting additional support. In contrast, case study schools with lower attainment levels continued to target PDG spending at lower-attaining pupils in general - regardless of disadvantage or eFSM status – on the grounds that there is often a substantial overlap between disadvantage and lower levels of attainment. However, it is worth reiterating that schools top up PDG funding by a considerable amount. It is therefore difficult to assess the extent to which the additional funding works with PDG to support a wider cohort of learners, who, schools consider, experience broader disadvantage than just being e-FSM.
1.7 There remains some ambiguity in schools about whether the PDG should be used to help lower attaining eFSM pupils or help all FSM pupils fulfil their potential5. Where schools regarded the PDG as a grant to close the attainment gap, they concentrated on low attaining (eFSM) pupils; where schools perceived it as a grant to help eFSM children fulfil their potential the funds were used for all eFSM pupils. In more recent case studies a few schools with better attainment records took the
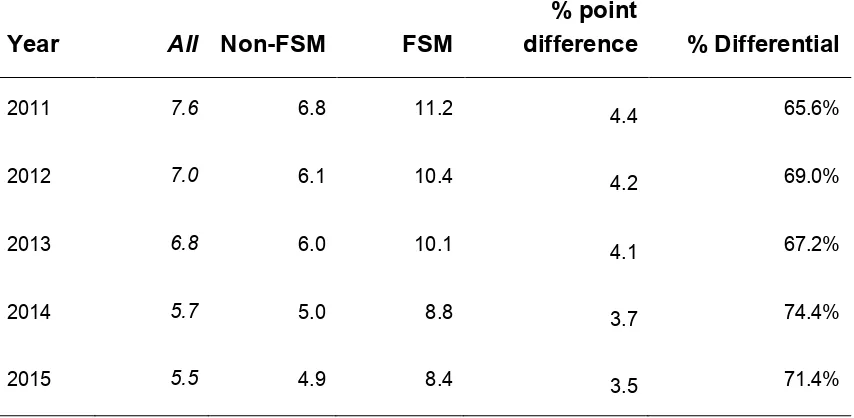
latter view and also provided support to More Able and Talented (MAT) eFSM pupils, although most schools continued to focus on low-attaining disadvantaged pupils. In line with this, the NPD impact analysis shows that the gap between eFSM and non-FSM pupils attaining the highest grades (A* or A) remains large and has not changed over the past five years, despite the overall attainment gap at Key Stage 4 closing.
1.8 Head teachers and teaching staff felt that pupils, regardless of their attainment levels, could be classified as ‘disadvantaged’ for a number of reasons, including pupils that were not able to get the same chances as their peers, pupils who found any aspect of learning difficult, pupils just above the poverty line, and pupils
impacted by short-term circumstances such as family breakdown. Case study schools relied heavily on their staff’s knowledge of individual pupils and families to target the PDG, and felt that the eFSM indicator does not capture all children of disadvantage that need additional support.
1.9 The PDG has encouraged schools to develop more sophisticated data tracking systems and enhanced the skills of teachers in analysing data they collect. There is evidence of good monitoring and evaluation of activities at the school level. Case study schools explained they had initially invested PDG in resources and
establishing data monitoring systems to track pupils’ progress using the funds, but that funds are now concentrated on the delivery of interventions. Case study
schools had strong tracking systems to monitor attainment and attendance. All case study schools monitored pupil-level data against individual targets. A few schools explained that they had not previously monitored eFSM pupils separately, or that they had not previously monitored the impact of specific interventions. There are examples of schools making spending decisions, and changing the way in which interventions operate, on the basis of the data they have collected to improve effectiveness.
1.10 Local partnerships are helping to disseminate evidence of what works. However, there is still scope to improve schools’ use of formal robust external data and evidence to ensure they are using the most effective approaches to tackling the attainment gap. In line with greater levels of local partnership activity observed in more recent years of the evaluation, recent case study visits demonstrated
of evidence more credible than formal external evidence sources – such as the Sutton Trust Toolkit – because it had worked in settings similar to their own. 1.11 A few case study schools were using the Sutton Trust Toolkit effectively to identify
cost-effective approaches, and to consider how those approaches could be adapted within their own settings. These were often schools with a culture of using evidence, challenging existing practice, and making good progress in closing the gap.
However, some other case study schools were sceptical about the Toolkit; in
several cases this was because they disagreed with its recommendations about the value and in particular the most effective use of TAs in classrooms. Others felt that the Toolkit endorsed what they were already doing, was not applicable to their setting, or was less helpful than their own experience. As a result, few of the case study schools were incorporating the low-cost high-impact strategies suggested in the Toolkit – such as enhanced feedback – into their approaches, which in turn could limit the impact of the PDG.
Activities
1.12 Recent case studies highlight many examples of very effective practice in closing the attainment gap. The most effective strategies had evolved over many years, and sometimes pre-dated the PDG. They included an example of whole-cluster literacy and numeracy strategies that had been developed by a secondary school. The strategies draw on meta-cognitive approaches to help decompose literacy and numeracy skills for children. The strategies were developed and tested within the school’s own English and Maths departments, before being rolled out to other departments at the school, and then to local feeder primary school staff. All staff, parents, governors and pupils across the region are trained on the strategy. The strategies have helped to ensure a consistent approach to literacy and numeracy across the cluster, eased transitions from primary to secondary level, and have helped to raise attainment significantly, both at the point primary pupils enter secondary school, and at the end of Key Stage 4.
1.13 Across the case studies there were many examples of schools developing innovative approaches to engaging with pupils and parents in ways that are recommended in the PDG guidance, including:
whole-school strategies to improve teaching and learning;
innovative uses of technology to engage and motivate children and parents;
focusing on attendance and behaviour, and in particular methods to engage pupils with the school and learning more effectively to incentivise good attendance and behaviour; and,
supporting the social and emotional skills of learners.
1.14 Case study schools appreciated the benefits of using the PDG to invest in family and pupil engagement and pastoral support for pupils and their parents. Case study schools often used PDG funds to employ Teaching Assistants (TAs) in a range of roles including family liaison roles and/or pastoral support roles for disadvantaged pupils: this gave TAs and the wider teaching staff insights into the home lives and specific barriers faced by individual pupils.
Outputs
1.15 There have been a variety of different impacts on school culture and attitudes to disadvantage as a result of the PDG. Some schools considered they already had a strong focus on disadvantage and that the grant provided them with extra funding. However, other schools felt that the PDG had significantly raised the profile of disadvantage and how schools should cater for disadvantaged learners. In these cases, it appeared that an increased focus on data monitoring was as responsible for changes in attitudes as the PDG activities. A few schools acknowledged they now have a much greater focus on eFSM than they did earlier in the life of the grant, and put this down to clearer guidance from the Welsh Government and their regional consortia. As well as schools’ own pre-existing commitment to tackling disadvantage, contextual factors – such as schools’ financial security and overall attainment levels – are significant in determining how much focus is placed on tackling disadvantage and the PDG. Where there were significant competing priorities, tackling disadvantage was not always a high priority.
for a range of roles they undertook, and in particular pastoral and family liaison roles, because they live in the same communities as parents, have strong relationships with families already and are perceived as less threatening than teachers.
1.17 Overall, the impact of the PDG on teachers appears to have been less significant than that seen with Teaching Assistants. However, a few recent case studies highlighted a shift in practice, with a move away from using TAs to deliver literacy and numeracy interventions in favour of using very highly skilled teachers (such as the Head of English or Maths). Recent case study visits also highlighted schools investing in staff training on assessment for learning and meta-cognitive
approaches that are recommended in the guidance and Sutton Trust Toolkit as being disproportionately beneficial for disadvantaged learners.
1.18 Case study schools noted that while quantifiable evidence of impact is a long-term goal that will need time to emerge, in the short term they have noted substantial improvements in ‘softer outcomes’ such as pupil well-being, confidence and self-esteem. Staff in case study schools consistently report that pupils grow in
confidence and self-esteem as a result of the interventions they have introduced; in some cases, pupils are more likely to participate in lessons afterwards. In addition, schools note that there are knock-on impacts for those pupils who remain in class (as they are not eligible for the PDG) when other pupils are withdrawn to take part in PDG interventions, as there are then fewer interruptions or disturbances for the remaining pupils and teachers.
Key strengths of the PDG
1.19 The PDG is associated with an increased focus on tackling disadvantage in both schools’ budgets and development plans, as well as within the role of Regional Consortia and Challenge Advisors. This has led to numerous positive impacts, including:
Increased and more tailored support being offered to schools to close their attainment gap;
Schools being challenged and held more accountable for the spend and impact of initiatives to tackle disadvantage. This has led to interventions being
Evidence of schools developing close working relationships with local authorities, consortia and communities, who supported the management of PDG and the implementation of PDG-funded initiatives. In line with this, there has been increased sharing of best practice;
Beyond the immediate use of the PDG to fund a wide range of interventions, the grant has been significant in changing schools’ culture in some instances. The most successful case study schools placed a strong emphasis on the PDG, with the school leaders’ vision being clearly articulated, shared and acted upon by all members of the staff in the school and wider partnerships.
An increased focus on whole-school strategies to improve areas such as
behaviour, attendance, family engagement and restorative approaches. Among case study schools where established behaviour/engagement systems were already in place, there was greater evidence of schools using PDG to invest in improved teaching and learning approaches.
1.20 Overall, PDG is considered hugely valuable by schools, and ‘invaluable’ for many case study schools. Its significance is primarily as a source of funding that is used to increase staffing which allows schools to provide tailored support for
disadvantaged pupils to cater for a wide range of academic, emotional, and social needs. Schools have actively embraced the WG directive to focus on pupils’ wider needs, and not just academic attainment: interventions cover pastoral activity, family support, as well as literacy and numeracy skills for example. Over time, case study schools have engaged in greater efforts to engage parents: while this involved some trial and error, these schools had developed a range of effective approaches to involve parents in the life of the school and their children’s learning.
Impact analysis
1.21 Findings from analysis of the outcomes of eFSM and non-FSM pupils from the National Pupil Database are summarised below. The aim of this analysis is to monitor the size of the educational attainment gap between e-FSM and non-FSM pupils at the national level prior to, and during the life of, the PDG in order to
1.22 In general, the analysis finds that the gap between eFSM and non-FSM pupils has narrowed over the past five years. However, the analysis shows that this trend of improvement pre-dated the introduction of the PDG in most cases, and so cannot at this stage be confidently attributed solely to the effects of the Grant. It should be noted however that:
Despite the results being mixed across different measures there is now an emerging pattern of success in reducing the ‘effect’ of being eligible for free school meals on measures of educational progress between KS2 and KS4 in English, Maths and Science.
Table 1.1. Key findings from analysis of National Pupil Database
Area Impact
Absence
Attendance has improved every year (prior to and after the introduction of the PDG and has improved for non-FSM and eFSM pupils at the same rate. Although it is possible that the PDG is having some impact on overall
attendance (e.g. in preventing the gap from widening further) unfortunately it is not possible to isolate the impact of the PDG from other policies improving attendance.
It does appear that the PDG could be having an important impact on unauthorised absence. This has improved significantly for eFSM pupils between 2011 and 20156. This contrasts with the rate for non-FSM pupils
where the rate has remained fairly constant.
While there have been significant improvements in the levels of persistent absence in Wales for all pupils, including eFSM pupils, the results suggest that other policies to improve attendance could be having a greater impact than PDG alone.
Key Stage 2 achievement
In English/Welsh, Maths and Science, the attainment ‘gap’ between eFSM and non-FSM pupils has reduced considerably over the past five years, with the rate of improvement greater for eFSM than non-FSM pupils.
Although, the gap was closing before the introduction of the PDG the rate of improvement for eFSM pupils achieving Level 4 in all three core subjects markedly increased in the last year of analysis which may suggest that improvements in KS2 attainment of eFSM pupils is beginning to speed up.
Key Stage 4 achievement
The attainment ‘gap’ between eFSM and non-FSM pupils in all three ‘core’ GCSE subjects has narrowed over time and figures for 2015 show this trend continuing.
Although the attainment gap between eFSM and non-FSM pupils at the end of Key Stage 4 remains large there is evidence that it is beginning to improve and much of this improvement has occurred since the PDG was introduced. The attainment ‘gap’ at GCSE is especially large when considering pupils gaining the highest grades (A* or A) rather than ‘pass’ grades (C or above), with non-FSM pupils more than four times as likely to achieve the highest grades. There is little change here since before the PDG was introduced.
Value-added
In Maths and English/Welsh the relative progress of eFSM pupils compared with non-FSM pupils has improved in the past year. However, the trends for eFSM pupils’ relative progress have been unstable over time: if this trend were to continue next year then we could be more confident about the association with the PDG.
2.
Introduction
2.1 Ipsos MORI and WISERD were commissioned by the Welsh Government in April 2013 to conduct an evaluation of the Pupil Deprivation Grant. The Pupil Deprivation Grant (PDG) is a central element of the Welsh Government’s policy efforts to close the educational attainment gap between children from more and less affluent families. The PDG was launched in 2012 and provides additional funding to schools based on the number of pupils on their roll eligible for Free School Meals (e-FSM) or who are Looked After Children (LAC). As of April 2015, PDG funding for eFSM pupils and LAC is delivered through two separate channels: PDG funding for eFSM pupils is delivered directly to the school, whilst PDG funding for LAC is provided to the consortia. In April 2016, PDG and EYPDG was made available to eligible learners in Pupil Referral Units; some of Wales’ most disadvantaged learners are educated in Pupil Referral Units and previously had not been supported by the additional funding provided by PDG. This evaluation focuses primarily on PDG funding for eFSM pupils.
2.2 Welsh Government guidance to schools suggests that schools should aim to spend the additional funds on evidence-based interventions to help close the attainment gap.
2.3 This is the final report of a three-year programme of evaluation of the PDG, two previous reports covering Year 1 and Year 2 are available on the Welsh
Government website7.
2.4 The rest of this chapter outlines the aims and methodology of the evaluation, and provides an overview of the contents and scope of this report.
The Pupil Deprivation Grant
2.5 The Pupil Deprivation Grant reflects education priorities within the Tackling Poverty Development Plan to address the causes and lived effects of poverty. It also addresses one of the three key priorities for education in Wales: closing the
achievement gap between socio-economic groups.8 As such, it formed a key part of
7http://gov.wales/statistics-and-research/evaluation-pupil-deprivation-grant/?lang=en
2012’s Improving Schools plan,9 which outlined a range of initiatives to improve
standards in response to concerns about both Wales’ overall educational
performance,10 and the widening/persisting gap in the attainment of pupils eligible
for Free School Meals (e-FSM) and other pupils (non e-FSM). Improving literacy and numeracy and closing the educational attainment gap are the two priorities underlining the plan. 2014’s Rewriting the future: raising ambition and attainment in Welsh schools plan recognises closing the educational attainment gap as an
ongoing priority, stating that: “the attainment of learners from deprived backgrounds in Wales is far too low and progress to improve outcomes is far too slow”.11
2.6 Rewriting the future: raising ambition and attainment in Welsh schools highlights the significance of schools’ role in reducing the effects of poverty on children’s
educational outcomes: the gap in attainment widens as children progress through the education system, but effective school practice has been shown to narrow the attainment gap between disadvantaged learners and their more affluent peers. Rewriting the future: raising ambition and attainment in Welsh schools sets out a number of strategies to help improve the attainment of disadvantaged learners, including: family and community engagement; a focus on early years; high-quality learning and teaching; and setting high expectations and aspirations for children. The Pupil Deprivation Grant, and the associated guidance for spending the grant, aims to help ensure that improving the outcomes of disadvantaged learners
becomes a higher priority for LAs and schools, and that schools are encouraged to work more effectively by diverting funds into activities that are proven to work. 2.7 Together with the Education Improvement Grant (EIG)12, the Pupil Deprivation
Grant represents the Welsh Government’s principle means of providing financial support for improving educational outcomes in schools. The EIG is aimed at supporting measures to improve the quality of teaching and learning and school leadership, while the Pupil Deprivation Grant’s key priority is to reduce the impact of poverty on educational achievement.
9 A more recent version of the plan, Qualified for Life, was published in 2014: http://gov.wales/docs/dcells/publications/141001-qualified-for-life-en.pdf
10 For example, Wales’ performance relative to other nations in the 2009 and 2012 PISA assessments: Wales performed relatively poorly compared with other UK nations, and its overall ranking – and in particular rankings for mathematics scores – fell. https://www.oecd.org/unitedkingdom/PISA-2012-results-UK.pdf
11 http://gov.wales/docs/dcells/publications/140616-rewriting-the-future-raising-ambition-and-attainment-in-welsh-schools-en.pdf
12 The EIG encompassed 11 discrete grants, one of which was the Schools Effectiveness Grant. The Schools
2.8 Similar initiatives are associated with success: for example, an Ofsted report on the Pupil Premium in England showed that the introduction of the Pupil Premium
coincided with significant improvements in the attainment of the pupils targeted: the proportion of e-FSM pupils gaining five A*-C grades at GCSE rose from 57% in 2011 to 80% in 2012, which reduced the gap between e-FSM and other pupils from 27 to 8 percentage points.13
2.9 PDG was preceded in Wales by Raising Attainment and Individual Standards in Education (RAISE), which funded schools in Wales’ most deprived areas to fund initiatives to support socio-economically disadvantaged pupils.14 However, an evaluation of RAISE found that the money was not always spent effectively, or on the target group of pupils, and lessons from RAISE have directly contributed to the guidance and governance arrangements for the PDG.15
Aims and objectives of the evaluation
2.10 The evaluation of the PDG is investigating issues around the implementation of the PDG, as well as the grant’s impact. The evaluation looked at how the PDG is being interpreted and implemented, and what impact it has had on pupil performance and school practice. The specific aims were to:
Assess the extent to which the overall aims and objectives of the PDG have been met;
Determine the impact of the PDG on improving the educational outcomes of pupils receiving support through PDG-funded provision;
Determine the impact of PDG by assessing its contribution to improvements in standards of education and any long-term capacity building in improving the educational attainment of socio-economically disadvantaged pupils.
Identify how effective LAs, regional consortia and clusters have been in ensuring the grant is used effectively;
Identify the key strengths of PDG and any constraints/ issues that may have impeded its effectiveness; and
13 The Pupil Premium: How schools are spending the funding successfully to maximise achievement. Note that the Pupil Premium has a number of different features to the PDG: the funds were greater per pupil (£900) before the PDG was increased), and eligibility is defined slightly differently (the Pupil Premium uses the ‘Ever6’ rule whereby any pupil eligible for eFSM in the past 6 years attracts the funding, while the PDG operates on the previous year’s eFSM eligibility only). 14http://www.raise-wales.org.uk/raise/raise-about.htm
Provide recommendations as to how the Welsh Government, LAs and schools can best build upon the PDG in meeting the priority to reduce the impact of deprivation on academic attainment.
Methodology
2.11 The evaluation comprised three main elements:
School survey: a survey of 201 schools in the first year of the evaluation (2014) provided in-depth evidence about the initiatives funded via PDG.
Impact analysis: analysis of the National Pupil Database looked for evidence of the impact of the PDG in terms of narrowing the attainment gap. This analysis has been conducted for each year of the evaluation, using the latest attendance and attainment data available for each cohort.
Case studies in 22 schools between May 2013 and June 2015, including longitudinal repeat visits to 14 schools in 201616. These investigated how the PDG is being used in practice, teachers’ perceptions of the impact of PDG-funded initiatives, and schools’ own measures of impact. The follow up visits in 2016 allowed for an understanding of any changes over time. For more details, see Annex A.
Focussed interviews with Regional Consortia representatives Scope and limitations of this report
2.12 The quantitative survey data used in this report is based on a survey of 201 schools conducted from February to April 2014. The commentary on this data in this report is based primarily on findings at the aggregate level for primary and secondary schools. While the survey findings are referenced throughout this report, the evidence presented here is based primarily on more recently-gathered qualitative evidence from the 14 follow up school case study visits undertaken in the
spring/summer term of 2016. The survey findings were reported in detail in the Year 1 Evaluation report17.
2.13 The case studies do not aim to provide evidence about a representative sample of schools. Qualitative research is designed to be exploratory and provides insight into people’s perceptions, feelings and behaviours. The research is not designed to provide statistically reliable data, but to provide in-depth understanding of a
16 Budget pressures meant that repeat visits to all 22 were not possible
3.
Inputs
3.1 The PDG has changed during the lifetime of the evaluation. The most significant changes include increases in the per-pupil funding available (from £450 in 2012 to £1,050 in 2015); and changes in the way schools are supported via written
guidance, and LA and regional scrutiny and assistance.
Table 3.1 Key policy changes since the introduction of the Pupil Deprivation Grant
Year Key policy changes
2012-13 PDG introduced. Guidance issued as part of a combined guidance document with School Effectiveness Grant.
2013-14
PDG extended to Looked After Children (LAC)18.
New guidance issued to schools December 2013: The guidance recommends that the additional Grant funds made available in 2014-15 are spent on the CPD of staff to better enable them to support this group of learners, and to generate a sustainable impact from the increase.
2014-15
PDG funds doubled to £918 per eligible pupil for 2014-15 academic year.
Welsh Government and LA support and challenge to schools strengthened: consortia expected to take a more pro-active role in tackling the effects of poverty on attainment, and Estyn reports to comment on how well schools use resources (including PDG) to support e-FSM learners.
2015-16
PDG funding increased to £1,050 per eligible pupil for 2015-16 academic year.
Early Years PDG introduced, extending funding of £300 per pupil to eligible 3- and 4- year olds19.
2016 -17.
PDG funding increased to £1,150 per eligible pupil for the 2016-17 academic year.
In April 2016, PDG was made available to eligible learners in Pupil Referral Units; some of Wales’ most disadvantaged learners are educated in Pupil Referral Units and previously had not been supported by the additional funding provided by PDG
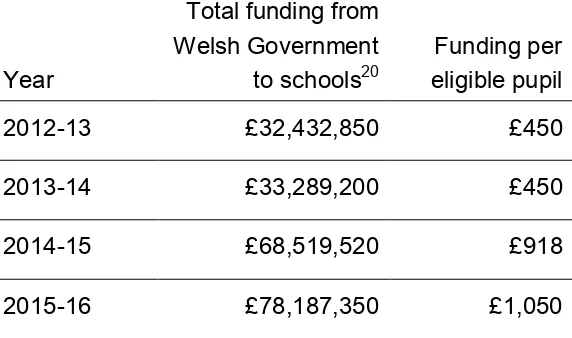
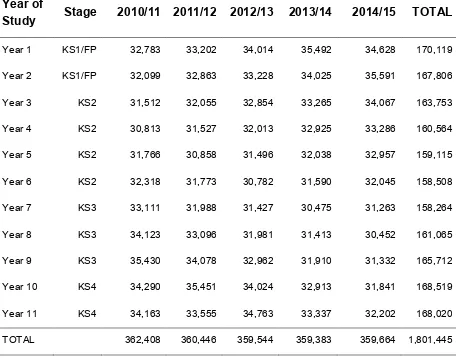
3.2 Increases in the per-pupil funding rate have meant the total financial contributions from the Welsh Government to the PDG have increased substantially over the grant’s lifetime (see table below). In 2015-16 over £78m was distributed to schools in Wales, of which 58% went to primary schools (£44,994,900), 40% to secondary or middle schools (£31,495,050) and 2% to special schools (£1,697,400).
[image:22.595.96.382.271.440.2]3.3 In addition, schools in Communities First clusters could apply for matched funding grants of up to £75,000 per cluster. In total, £ 4,547,671 was distributed via Communities First matched funding.
Table 3.2 Total funding from Welsh Government over the lifetime of the grant
Year
Total funding from Welsh Government to schools20
Funding per eligible pupil
2012-13 £32,432,850 £450
2013-14 £33,289,200 £450
2014-15 £68,519,520 £918
2015-16 £78,187,350 £1,050
3.4 This means primary schools received an average of £38,755 in PDG funding, secondary and middle schools received £147,864, and special schools received £43,523 in 2014-15. The survey conducted in the first year of the evaluation found that 9 in 10 schools ‘topped up’ the PDG with funds from their general school budget, and/or the School Effectiveness Grant/ EIG. Schools’ contributions were significant, representing 50-100% of the Government PDG allocation; more recent qualitative work among a smaller sample suggests that schools continue to
supplement the PDG in this way. The survey and qualitative work both highlighted that, although the PDG may represent a relatively small proportion of the overall school budget (an average of 4% in the first year of the evaluation), school leaders considered it an invaluable source of funding for specific types of activity to reduce the attainment gap and was prioritised in Programme for Government.21
3.5 The survey and qualitative work highlight that the PDG’s effectiveness and impact relies on the existence of other complementary funding streams, which are often pooled to fund interventions that fulfil the requirements of multiple grants. The case studies showed that PDG is often used in conjunction with other school grants, such as the Education Improvement Grant (EIG)22: “the PDG identifies e-FSM students in terms of literacy and numeracy interventions, but if we then fund those interventions through EIG then we can use these literacy and numeracy interventions for the whole school rather than just those pupils... [we then get] more bang for our buck.” Another case study school indicated that they would use a proportion of their PDG and their EIG to form a new teacher’s salary. The use of a mix of funding streams in this way makes it difficult to isolate the impact of individual programmes, such as the PDG.
3.6 The role of regional consortia in supporting local networks of schools has become more significant during the lifetime of the grant. For example, one consortium
worked closely with ten ‘Hub’ schools to promote a region-wide focus on closing the educational attainment gap. The designated Hub Schools benefitted from a range of activities, including an action research programme for senior school leaders,
workshops for staff at all levels, a coaching programme for eFSM children that helps to develop meta-cognitive skills, and greater support for schools via Schools
Challenge Advisors. The Hub schools were tasked with providing school-to-school support to share practice with, and support, other schools in the region. More than 20 other schools in the region were provided with supply cover so that teachers could receive training on evidence-based approaches to closing the gap, and
particularly those contained within the Sutton Trust Toolkit: the consortium provided funding for supply cover, which allowed these teachers to carry out action research to identify which of the Toolkit’s recommendations could be implemented to greatest effect in their own schools.
3.7 Challenge Advisers have also taken a greater role in challenging and supporting schools in their efforts to close the attainment gap. Their role is to scrutinise
schools’ analysis and use of performance data; monitor school leaders’ strategies to improve outcomes for eFSM pupils; help to identify and share good practice across
schools. One consortium staff member, who looks specifically at PDG within their region, noted that there are numerous models and initiatives available for closing the gap, “the challenge is finding what works amidst a sea of information” and “to create systems which facilitate sharing best practice and information across the region”. The Challenge Advisers focus in particular on support and intervention in schools where closing the gap has been given a high priority.
3.8 The support regional consortia and Challenge Advisors provide schools to close the gap varies by region; the strategies in place are formulated based on data and best practice. The case study below demonstrates how ERW implements these
strategies; similar strategies are in place across all consortia.
Case Study Theme: Input from regional consortia and Challenge Advisors
ERW is an alliance of six local authorities governed by a legally constituted joint committee: Carmarthenshire, Ceredigion, Neath Port-Talbot, Pembrokeshire,
Powys, Swansea. The six local authorities work together to agree a regional strategy and business plan to deliver school improvement services.
The Challenge Advisors in ERW are directly employed by local authorities, but their work is directed centrally by ERW as a region. ERW is responsible for all training, systems and accountability of the Challenge Advisors. Approximately 60 Challenge Advisors work across the region: some work in primary, some with secondary, and some across both. Challenge Advisors are the direct link between ERW and
schools. They may support up to 15 schools in some local authorities, and will be responsible for the core visits.
Core visits
the field found that ‘impact’ needs to be understood as the Challenge Advisor looking at the school’s data – often focussing on individual pupils – to determine the effectiveness.
The second core visit (CV2), which takes place in Spring or Summer, is more about provision itself (such as books, observing lessons, and talking about school
leadership), and is always carried out by the same Challenge Advisor.
It was emphasised that the core visits do not focus solely on children who are below a certain threshold, but also those who are above, as not all FSM children are below this threshold.
Challenge and support
The Challenge Advisor role focusses on challenge and support. Depending on the school, ‘challenge’ or ‘support’ will be the key objective. One of the consortium staff in ERW highlighted that it is likely that red or amber schools will receive very
bespoke advice and support, whilst yellow schools will be challenged to improve and green schools will be challenged to maintain their green status. The Challenge Advisor signposts schools to best practice, or signposts one school to another as most schools have pockets of good practice to learn from, regardless of whether they are of red or green status.
Sharing best practice
Mechanisms for sharing best practice includes the ‘menu of support grid’, which is completed by the Challenge Advisor during each visit and signed off by the school. As such, the school will know where they can go to access items which will help them carry out the recommendations that the Challenge Advisor has made. These can be resources (for example, buying in intervention packages such as
‘Jollyphonics’); it can be going to observe other schools or teachers within the same school; or it can relate to leadership and closing the gap more generally.
Training and resources
Training is often carried out centrally at ERW.
“Let’s say differentiation is an issue. The Challenge Advisor is responsible for identifying the need, but the case will then go to our teaching and learning team or leads, who will then ensure that that school is provided with either direct training on differentiation, or they might bring in someone from the inclusion team within that school’s local authority who might look at differentiation
The ERW website lists local resources and courses. Teaching support officers from all six authorities get together and create a menu, which is made available to
schools. Schools may order a bespoke ‘special’ support package, as certain schools may not fit into a particular menu box. One consortium staff member noted that they “try to put on appropriate courses” which are free- although supply cover is not funded and schools are encouraged not to use PDG funds to cover supply support. Impact and effectiveness
ERW has an electronic monitoring system that provides an overview of how schools across the six local authorities are spending their money, and the impact this is having on standards.
Overall as a region, FSM pupils are said to do well in their indicators at L2 inclusive compared to non-FSM pupils. However, both FSM and non-FSM groups were performing strongly. As such, they were not ‘closing the gap’ as a region because the performance of non-FSM pupils was also rising. It is noted that it is impossible to attribute the high performance of FSM pupils to one specific thing but it is felt that as a consortium they have succeeded in raising awareness of FSM and more
vulnerable groups of learners, and that PDG was working to raise attainment of FSM pupils.
Tracking is said to have been central to their success, as well as working out the ‘value added’. For example, “if there’s excellent teaching and differentiation, aligned with really close tracking and interventions... that’s where we really push forward.” The importance of working collaboratively was also emphasised- this may be in clusters of schools, or through building relationships between primary and secondary schools. It was noted that it is key to partner schools at complementary stages of development:
“Schools are on journeys…a lot of time and effort has been expended to get to that point… so you can’t just pick initiatives off the shelf and expect overnight results”
“When you link a red school with a green school that won’t work because they’re too far apart…amber to red, yellow to amber, green to yellow are always the best transfers”
Impact of the PDG and areas for improvement are highlighted in the schools’ development plans, submitted each September.
pupils, which did not provide any information about their progress, well-being, or their individual experiences. As such, the current system in place allows for a more sensitive appreciation of the impact of PDG by looking at impact beyond academic indicators.
“A lot of the pupils under the PDG aren’t going to obtain a lot of the key (academic) indicators. So unless you measure their wellbeing, their health, happiness, attendance, you’ve got no indication of what’s going on and what impact the funding is having.”
Views on the PDG as a policy
The PDG was said to be a “lifeline” for local authorities who run their budget directly to improve FSM results.
“It’s an extremely well designed policy and the guidance is clear. What’s an appropriate spend is clear. I think the grid and flowchart at the back of the document is perfect- it’s simple and clear what you can and can’t spend things on. The monitoring system on that spend is crucial, and that’s why the
Challenge Advisor’s role is important”
The PDG was said to be well-targeted, largely due to the increased accountability of Head teachers, the monitoring of Challenge Advisors, the role of School Governors, and Estyn: “with all of those watchdogs, accountability has become far more robust”. As a result, schools’ monitoring and evaluation data is considered significantly
improved compared with five years ago.
3.9 The regional consortia staff interviewed noted that they have found the
administrative requirements of PDG, in terms of their data gathering and reporting responsibilities, manageable. One stated that this was due to the “good system” they had in place for tracking data.
emphasised that by removing the PDG funding, the relationships and partnerships that have developed as a result of it may also be impacted.
3.11 To further enhance the effectiveness of the PDG one consortium staff member argued that funding should be released directly to the regions, and then distributed to schools based on need, expertise, intelligence and good practice. They felt this was particularly relevant where the amount of funding to schools was smaller (such as £800 in total), as it was difficult for the Head teacher to implement effective strategies using this level of funding.
3.12 Moving forward, there is recognition that the consortia need to understand the different needs within their regions: “so it’s not just calling it deprivation, it’s slicing it up a little bit”. For example, FSM pupils in affluent areas will have different
experiences compared with FSM children in deprived areas, or different schools. 3.13 There is also an increased focus on the importance of the family liaison role:
“Unless you tackle the whole family when it comes to poverty and deprivation, and not just the whole child, I don’t think you’re going to create a helpful culture when that child goes back home…some of those parents are deeply in
poverty…the majority of those parents want the best for their children, so by supporting the family, through health initiatives, through social services, transport, uniform…anything you can do to support the family- get them into school, because they may have had a bad experience themselves….when that child returns home the culture is better”. (Consortium staff member)
3.14 In line with this, there is appetite to continue building on the partnerships developed as a result of PDG, to increase investments in well-being strategies, and to engage parents and families more by health, education and social services working
4.
Management of the Pupil Deprivation Grant
4.1 This chapter looks at how schools manage their spending of the Grant, including the support and advice they receive, and the evidence used by schools to inform their spending.
Management of the Pupil Deprivation Grant
Input from local authorities, regional consortia and clusters
4.2 Case study schools had developed close working relationships with their local authorities, consortia, and communities, who supported the management of PDG and the implementation of PDG-funded initiatives.
4.3 Case study schools cited their local authority (LA) as a valuable source of advice on the administration of, and evidence base for, the PDG: LAs provided examples of good practice, signposted them to relevant documents, visited regularly, provided recommendations on spend and how to maximise impact, and could be approached for input on how to handle particular situations. One case study school utilised the ‘Vulnerability Profile Index’ provided by their local authority to identify at-risk pupils who required tailored support.
4.4 Across the case studies, there was some evidence of schools working effectively across clusters. These initiatives were sometimes led by LAs and consortia, and sometimes instigated by school leaders themselves. Cluster initiatives included consortia establishing professional learning communities (PLCs) with themes such as closing the attainment gap; school leaders pooling PDG to fund members of support staff to work across the region; and in one case a whole-cluster literacy initiative. However, case study schools with poorer records in closing the attainment gap had less constructive relationships with other local schools.
4.5 Case study schools, especially those with a focus on tackling disadvantage across the whole-school or cluster of schools, also linked with local businesses and
4.6 School Governors also played an important role in supporting the management of PDG, predominantly through providing feedback on the School Development Plan. One case study school explained that the school governors did not shape the strategy but rather acted as “critical friends” to the school by asking difficult
questions about how the strategy was devised and delivered, and the outcomes it achieved.
Case Study Theme: Partnership and sharing effective practice:
As part of the case study visits undertaken, examples of a number of
approaches to partnership working enabling the sharing of effective practice emerged:
Schools collectively funded an Engagement Worker, whose time is split across schools in the consortia. The Engagement Worker worked with a range of families in need, from those who needed literacy support and help filling in forms, to crisis support. The family outcomes were monitored alongside pupils’ attainment.
A cluster of Primary Schools developed an initiative called ‘Project Hero’ to support their pupils as they transitioned to local secondary schools. The PDG funded the lead for this initiative, which facilitated group discussions (for example, discussing the pupils’ fears about moving to secondary school) with Year Six pupils. The initiative was said to have noticeably improved the
behaviour of pupils in their final term of primary school. One-to-one in-classroom support was also offered to those that needed it during the first term at their secondary school.
A cluster of a secondary school and six feeder primary schools developed a consistent literacy and numeracy strategy that was taught and embedded across the curriculum. To improve baseline skills of pupils, PDG funds across the cluster were pooled to provide a Cluster Literacy Learning Coach who supported the implementation of the strategy, provided training, modelled teaching practices, offered individual support, and created learning frameworks and resources. This raised the baseline level of achievement of primary school pupils entering secondary school, and allowed primary school teachers to benefit from secondary teachers’ more specialist subject training. Teaching Assistants and School Governors also received training on the strategy, and parents were briefed on what it entailed. The effectiveness of the cluster strategy was
Input from financial and senior management teams
4.7 Across the case study schools, it was typical for senior management teams – led by the head teacher – to decide the priorities and allocation of PDG spend for the school. This was not necessarily the same team that monitored the impact of PDG spending, with case study schools funding PDG Managers, Inclusion and
Achievement teams, Intervention Managers and Team Leaders to oversee PDG in practice. These teams were consulted to provide evidence that fed into the School Development Plan and the senior management team’s decision-making process. 4.8 In some case study schools, Finance Officers or Business Managers took
responsibility for monitoring the costs of school grants – for example, through inputting the costs on ‘My School Improvement Dashboard’ (MySID, designed by the Educational Achievement Service23 in Wales), and then invoicing the various activities as the year progresses. As a result of this monitoring, one case study school realised they had significantly under-spent their funding during the academic year so allowed teachers to bid for funds to spend on their own project ideas.
4.9 A number of case study schools noted that their PDG-funding was “ring-fenced to close the attainment gap between eFSM and non-FSM” pupils. One school placed flags in their finances so that PDG-related spend is readily available for audits. 4.10 The financial and senior management teams work closely together to allocate and
monitor PDG funding. The Financial Officer of one secondary case study school sat on the senior management board, which meets fortnightly, so was aware of the school philosophy and the impact the PDG funding has on school practice: “it is integral to the work we are doing: it is allowing us to try and get through to these pupils and give them the skills they need”.
The School Development Plan
4.11 For each academic year, schools draft a school development plan (SDP) that outlines how they intend to allocate their school budget in order to meet their objectives. The development plan for PDG funding was previously a separate
document, but the breakdown of spend for PDG-funded initiatives is now embedded as part of the SDP. This shift received positive feedback from case study schools: “narrowing the gap between e-FSM pupils and the whole cohort should be an
essential part of any school’s development plan so having the PDG Development Plan as part of this is great”. (Assistant Head teacher, Secondary School)
4.12 Notably, the SDP refers to the academic year (September through to July), whilst PDG funding is based on a financial year (April through to March). As such, one case study school stated that they “plan for four terms and hope funding is available for the full school year”, a sentiment shared across the visits. Case study schools consistently mentioned the difficulties of planning the funding, and particularly planning staffing, before they are aware of their PDG allocation for the year.
Contextual factors impacting schools’ management of PDG
4.13 Recent work published by the Department for Education into the impact of the Pupil Premium in England highlighted that schools are at different points in an
‘improvement journey’ in terms of how they tackle educational disadvantage. They found that the schools that were most effective in closing the gap had started
implementing strategies at an earlier point, and had more mature strategies in place to tackle the gap.24 This pattern is endorsed through the PDG case studies.
4.14 The most successful schools placed a strong emphasis on the PDG. The school leaders’ vision was clearly articulated and shared and acted upon by all members of staff in the school and wider partnerships. For example, one case study school had developed a whole-school and cluster strategy to improve literacy and numeracy standards under RAISE, which they continued to implement through the PDG. The strategies equipped pupils with independent learning skills, and a series of steps to decompose literacy and numeracy tasks. The deputy head teacher in this example highlighted the school’s commitment to ensuring the strategy was delivered
consistently and effectively: all staff members were aware of the strategy’s aims, and could implement it across all school subjects and activities. The senior management team was accountable to the learners, school staff, parents,
governors and local authority, who were all informed of what the strategy aimed to do and how. As such, a school culture that valued continued learning and
improvement was expected and encouraged by all involved. Estyn has recognised the school as a hub for sharing good practice, and the proportion of e-FSM pupils achieving the ‘Level 2+’ indicator (5 A-Cs at GCSE, including English and
Mathematics) has increased from 14% in 2012 to 54% in 2015.
4.15 Case study schools with a poorer track record were evidently at a much earlier point in their improvement journey, and in these cases the significance or priority afforded to the PDG was limited by school circumstances which may limit the impact in such schools. For example, one case study school was facing significant uncertainty about its future, with falling pupil numbers, staffing cuts, forecasted budget deficits, and poor academic performance in recent years. Tackling the attainment gap was secondary to some of the more pressing concerns threatening the school’s future. As a result, the school had been given a ‘Notice to Improve’, which highlighted pupil attendance and performance, particularly among e-FSM pupils, as a key area for improvement. The ‘Notice to Improve’, as opposed to the PDG funding, had taken priority and acted as the catalyst for change and increased the focus on improving outcomes of e-FSM pupils. Strategies in this school focused on ‘getting the basics right’, including a focus on attendance and behaviour, and more effective
identification and targeting of pupils requiring additional support. Although in this example PDG funding may have been used to deliver the changes, the presence of PDG was not the ultimate ‘driver’, rather the very challenging circumstances of the school was the driver for change.
4.16 The size of the school is also a key consideration in relation to the PDG and its intended outcomes. One case study school had a total of 34 pupils, of which eight pupils were e-FSM. The head teacher noted that standards overall were generally high and that there was rarely a discernible gap in attainment between eFSM and non-FSM pupils, potentially because due to the smaller class sizes, all pupils including those that were e-FSM, received tailored attention. Similarly, NFER’s statistical analysis of factors associated with schools’ effectiveness in closing the attainment gap also found smaller class sizes to be correlated with greater levels of success25.
Targeting the Pupil Deprivation Grant
4.17 The Welsh Government Guidance26 states that the Pupil Deprivation Grant (PDG) must be used to fund measures to improve attainment by pupils eligible for free school meals (eFSM pupils) and looked after children (LAC), and is not intended to tackle underachievement across the whole school population (though whole-school approaches that have a disproportionate benefit for eFSM pupils may be adopted).
25 https://www.gov.uk/government/uploads/system/uploads/attachment_data/file/473974/DFE-RR411_Supporting_the_attainment_of_disadvantaged_pupils.pdf
Intervention programmes for individual pupils can only use PDG funds for eFSM pupils.
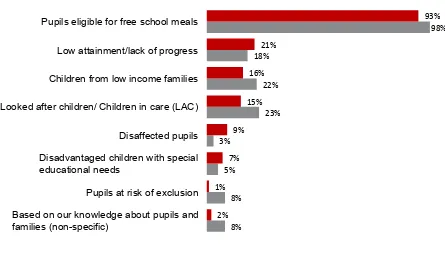
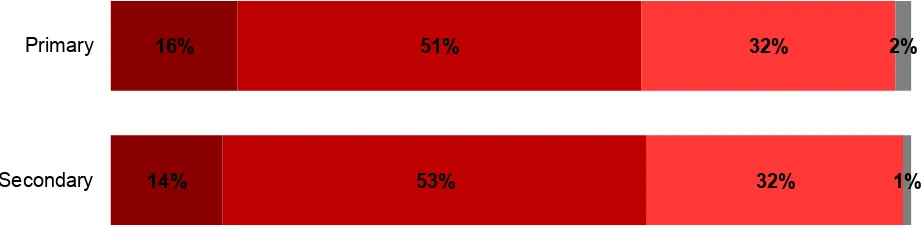
[image:34.595.96.541.436.693.2]4.18 Schools were aware that the Welsh Government intends the PDG should target disadvantaged pupils. When asked in the survey in 2014 (prior to the arrangement of the PDG funding being delivered to eFSM pupils and LAC through two separate channels) which group they thought the PDG is intended to benefit, 93% of primary and 98% of secondary school respondents cited eFSM pupils, and 15% of primary and 23% of secondary respondents said LAC. Just over half of schools (55% primary, 60% secondary) identified that both eFSM and LAC pupils are eligible for the Grant. Schools that reported having LAC pupils in their population were more likely than those with no LAC pupils to report that the grant targets this group27. As has been highlighted previously the funding mechanisms for PDG support for eFSM and LAC pupils changed in April 2015 into two discrete streams. This report focuses on eFSM and further work on the LAC stream will follow in future.
Figure 4.1 Perceptions of the intended beneficiaries of the Pupil Deprivation Grant
Base: 201 schools surveyed, Feb – Apr 2014. Figure shows responses mentioned by at least 5% of respondents
Question: First of all, based on your understanding of the Pupil Deprivation Grant guidelines, which groups of pupils is the PDG intended to benefit?
27 For example, 4% of primary schools with no LAC pupils were aware of the LAC criterion, compared with 27% of primary schools with LAC pupils on roll.
8% 8% 5% 3% 23% 22% 18% 98% 2% 1% 7% 9% 15% 16% 21% 93%
Based on our knowledge about pupils and families (non-specific)
Pupils at risk of exclusion Disadvantaged children with special educational needs
Disaffected pupils Looked after children/ Children in care (LAC) Children from low income families Low attainment/lack of progress Pupils eligible for free school meals
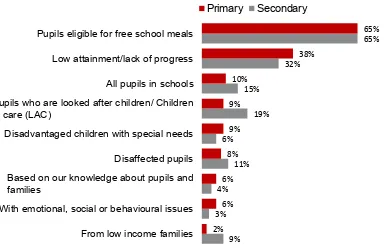
4.19 While schools were aware that the target beneficiaries of the PDG are eFSM pupils, they used broader criteria when targeting interventions in their own schools: only 65% of interventions run in both primary and secondary schools were targeted specifically at eFSM pupils, and there were a significant number of other pupils benefiting from Grant-funded activity. There are two key reasons for this:
1. Schools considered the Grant aimed to tackle ‘disadvantage’ rather than ‘financial deprivation’, and used a wider range of indicators and personal
knowledge of pupils and families to identify those in need of support, rather than FSM status alone. One case study school noted that “eFSM is a way of quickly defining students – they are economically deprived, but there is a much greater range of deprivation than that...whether it’s their parents not being there or whether it’s being disadvantaged through opportunity.” This sentiment was shared by another case study school: “some of the more affluent pupils can be disadvantaged due to lack of support at home, and LAC may or may not be disadvantaged based on their background for being looked after... Overall, disadvantage is anything that means they’re not able to get the same chances in the same way”. These schools emphasised the importance of understanding the family’s background and current circumstances when identifying whether the pupil was in need of support.
Figure 4.2 Groups targeted by PDG-funded initiatives
Base: 785 interventions across 201 schools surveyed (457 primary, 328 secondary interventions), Feb – Apr 2014. All responses with 5% or more (total)
Question: Which groups of pupils, parents, or other groups are targeted as part of the intervention?
4.20 The case study visits echoed the survey findings, in that schools understood the aim of the PDG was to tackle the attainment gap by targeting disadvantaged pupils. Head teachers and teaching staff interviewed were broadly supportive of the
funding’s core aim of specifically helping deprived pupils, but continue to use a broader definition of deprivation than FSM status alone.
4.21 Head teachers and teaching staff felt that pupils could be classified as
‘disadvantaged’ for a number of reasons, including pupils that were not able to get the same chances as their peers, pupils who found any aspect of learning difficult, pupils just above the poverty line, and pupils impacted by short-term circumstances such as family breakdown.
4.22 Case study schools relied heavily on their staff’s knowledge of individual pupils and families to target the PDG, and felt that indicators such as eFSM were a “crude marker of children’s development because it doesn’t catch all the children who need extra help”. Though eFSM does not encompass the broader definition of deprivation that head teachers and teaching staff used to target disadvantaged learners, many recognised that as “a yard stick” it was the best they had available.
9% 3% 4% 11% 6% 19% 15% 32% 65% 2% 6% 6% 8% 9% 9% 10% 38% 65%
From low income families With emotional, social or behavioural issues Based on our knowledge about pupils and families
Disaffected pupils Disadvantaged children with special needs Pupils who are looked after children/ Children in care (LAC)
All pupils in schools Low attainment/lack of progress Pupils eligible for free school meals
Planning Pupil Deprivation Grant expenditure
Evidence used for planning PDG spend
4.23 The PDG encourages schools to make use of evidence-based approaches when planning how to spend the PDG. The guidance28 requires that schools make
intelligent use of data, use data tracking systems to identify learners’ needs, target interventions and monitor impact. It also highlights a number of external sources of evidence that schools can use to plan their spending. Specifically, the guidance from the Welsh Government highlights the Sutton Trust Toolkit, Estyn thematic reports and Save the Children Wales’s Communities, Families and Schools Together report.
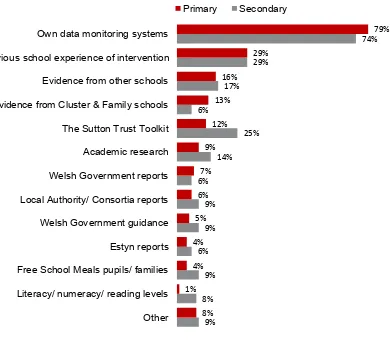
4.24 At the time of the survey in 2014 when asked unprompted what sources of evidence they use when deciding how to spend the grant, schools typically reported using their own data monitoring systems (79% primary and 74% secondary), and a significant proportion mentioned their past experience (29% primary, 29%
secondary). A minority of schools spontaneously mentioned external sources of evidence: for example, 12% of primary and 25% of secondary schools reported using the Sutton Trust Toolkit, and 4% of primary and 6% of secondary schools cited Estyn reports. Schools with a higher proportion of e-FSM pupils were more likely to use both the Sutton Trust Toolkit and Estyn reports (27% with a large proportion of e-FSM used the Sutton Trust Toolkit, and 13% used Estyn reports). The guidance does suggest that schools use their own data alongside external sources, but 66% of primary schools and 46% of secondary schools reported only using their own, or informal, sources of evidence, and did not spontaneously mention using external or formal evidence29.
28http://gov.wales/docs/dcells/publications/130426-school-effectiveness-grant-2013-2015-en.pdf