Contents
Introduction ... 1
Key statistics ... 2
Qualifications regulated ... 3
Certificates issued by awarding organisations ... 12
Background notes ... 23
Your feedback ... 30
Appendix ... 31
This release provides information on the range and volume of regulated qualifications at level 4 and above (equivalent to post A level) and certificates issued during April – June 2013. It also reports on comparisons and trends over the past five years.
The key findings for this release are:
In this quarter, 24,900 certificates were issued for higher level qualifications, a decrease of 8 per cent compared to the same quarter in 2012.
The number of available higher level qualifications continues to increase from 2,206 in the same quarter in 2012 to 2,552 this quarter (16 per cent increase).
There is a continuing growth in the number of
qualifications with no achievements; only 29 per cent of all available qualifications have been issued this quarter.
This quarter, 129 awarding organisations are offering
regulated higher level qualifications, a 9 per cent increase when compared to Q2 2012.
Business, administration, finance and law continues to
be the biggest sector subject area (41 per cent of all certificates).
Higher Level Qualifications Quarterly:
April – June 2013
Key points
Published:
Introduction
Ofqual regulate qualifications, exams and assessments in England, and vocational qualifications in Northern Ireland. Under the Apprenticeships, Skills, Children and Learning Act 2009 (London: HMSO), one of our objectives is to improve public confidence in regulated qualifications and assessments by raising awareness and understanding of the qualifications we regulate.
In this release, we present data on available regulated qualifications and the number of awards of these qualifications. When a qualification is approved for accreditation, it is classified as one of 18 qualifications types. Here we present figures on seven1 of these qualification types. The data cover qualifications of all types at level 4 and above, known as higher level qualifications, (equivalent to post A level) in England, Wales and Northern Ireland. It does not include qualifications such as university degrees, which are regulated by the Quality Assurance Agency for higher Education (QAA). The figures represent both the quarter April – June 2013 and the 12 month period to June 2013.
A glossary of terms is available towards the end of this release, for assistance in interpreting the content, followed by the data tables in the appendix.
1
English for speakers of other languages, higher level, key skills, National Vocational Qualifications
Key statistics
In the quarter April – June 2013, 24,900 certificates were issued for higher level qualifications, compared to 27,050 certificates issued in April – June 2012, a decline of 8 per cent.
There was a continued increase in the number of available qualifications, from 2,206 qualifications in April – June 2012 to 2,552 this quarter (a 16 per cent increase). Numbers have risen since Q4 2009 and this may be due to the increase in the
number of qualifications available in the Qualifications and Credit Framework (QCF).
Of the 2,552 qualifications available this quarter, 732 did not have certificates in this quarter (29 per cent) and 1,387 did not have any certificates issued in the last 12 months (54 per cent). This pattern is similar to previous quarters with about 50 per cent of qualifications without certificates in the preceding 12 months to the quarter end. The majority of these inactive qualifications are in the QCF, and we may see certificates issued in more of these qualifications over the next one to two years.
Over the past five years there has been a continual growth in the number of awarding organisations offering and awarding higher level qualifications, with a 9 per cent increase in the number of awarding organisations offering these qualifications since quarter 2 of 2012 (129 awarding organisations compared with 118) and a 6 per cent increase in the number awarding (88 compared with 83).
The two sector subject areas with the most certificates issued were business,
administration, finance and law (10,450 certificates, 42 per cent of all certificates) and education and training (7,550 certificates, 30 per cent of all certificates).
There was an increase of 10 per cent in the education and training sector (6,850 certificates issued in April – June 2012 compared to 7,550 certificates this quarter). This can largely be explained by the greater number of students taking the
qualification in preparing to teach in the lifelong learning sector.
Qualifications regulated
In this release we consider all higher level regulated qualifications that are available in England, Wales and Northern Ireland. When a qualification is approved for
accreditation, it is classified as one of 18 qualification types. Here we present figures on seven of these types: English for speakers of other languages (ESOL), higher level, key skills, National Vocational Qualifications (NVQ), occupational qualifications, Qualifications and Credit Framework (QCF), and vocationally related qualifications.
Qualifications available
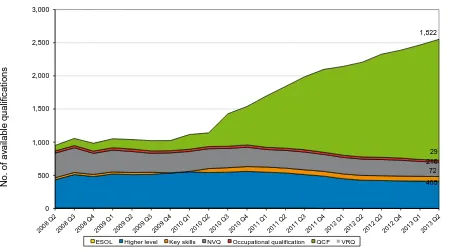
The number of available regulated higher level qualifications continues to rise. In April – June 2013, there were 2,552 qualifications, an increase of 16 per cent on the same quarter of 2012 (see figure 1).
The continual ‘quarter-on-quarter’ increase has seen more than double the number of higher level qualifications on offer over the past three years, from 1,142 in April – June 2010.
Figure 1 shows that the continued growth in numbers of these qualifications is mainly in QCF qualifications. The QCF began in 2008, after tests and trials; from 2010, qualifications began to be restructured in order to be accredited into the QCF. The QCF offers up to three different sizes of qualification (award, certificate and diploma)
[image:4.595.76.525.384.635.2]Key: QCF: Qualifications and Credit Framework; NVQ: National Vocational Qualification; ESOL: English for Speakers of Other Languages.
Figure 1: Number of available regulated higher qualifications per quarter by qualification type, April ‒ June 2008 (2008 Q2) to April – June 2013 (2013 Q2)
0 500 1,000 1,500 2,000 2,500 3,000
N
o.
of
av
ailable
qualif
ic
at
ions
ESOL Higher level Key skills NVQ Occupational qualification QCF VRQ
1,822
29 216 72
quarters) of numbers of NVQs and qualifications categorised as higher level,
suggesting that these qualifications have been restructured and their original forms have no longer continued.
For more detailed information on the number of available qualifications, see table 1 in the appendix.
During this quarter, 109 new QCF qualifications and 1 new higher level type
qualification were added to the list of available regulated higher level qualifications. The highest number of new qualifications was in the business, administration and law sector subject area, with 60 qualifications (28 of these were from the awarding
Awarding organisations
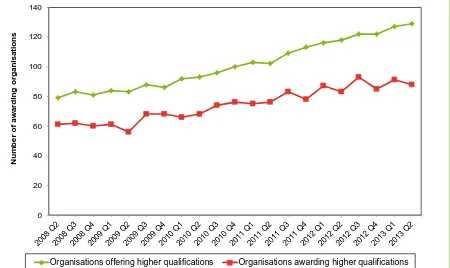
There are 129 recognised awarding organisations that offer regulated higher level qualifications. In April – June 2013, 88 of those awarding organisations awarded higher level qualifications.
Figure 2 shows that there is a trend, evident since quarter 2 of 2011, for a greater number of awarding organisations to award higher level qualifications in quarters 1 and 3 of each year.
[image:6.595.76.526.370.638.2]Compared with the same quarter of 2012, there was a 9 per cent increase in the number of awarding organisations offering regulated higher level qualifications (118 in April – June 2012 compared with 129 in this quarter). There was also a 6 per cent increase in the number awarding higher level qualifications (83 in April – June 2012 compared with 88 in this quarter).
Figure 2: Total number of awarding organisations with at least one available higher qualification per quarter, and awarding organisations that have awarded at least one certificate, April - June 2008 (2008 Q2) to April - June 2013 (2013 Q2)
0 20 40 60 80 100 120 140
N
u
m
b
e
r
o
f
a
w
a
rd
in
g
o
rg
a
n
is
a
ti
o
n
s
Qualifications available and awarding
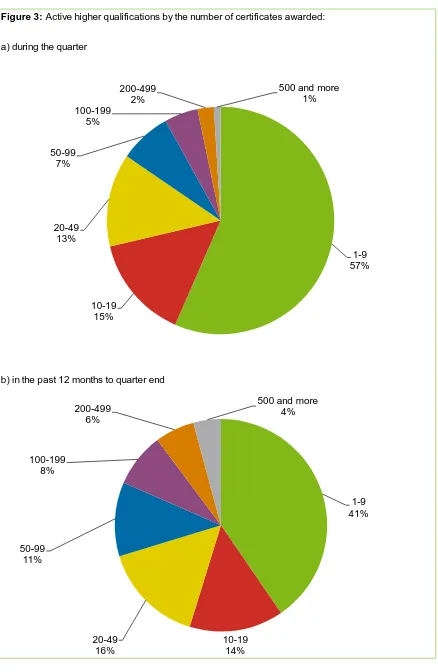
In this quarter, only 29 per cent of available qualifications had certificates (732 of 2,552). In the last 12 months to June 2013, of all the qualifications that were available, 1,165 qualifications had certificates (46 per cent).
a) during the quarter
[image:8.595.74.512.74.746.2]b) in the past 12 months to quarter end
Figure 3: Active higher qualifications by the number of certificates awarded:
1-9 57%
10-19 15% 20-49
13% 50-99 7%
100-199 5%
200-499 2%
500 and more 1%
1-9 41%
10-19 14% 20-49
16% 50-99
11% 100-199
8%
200-499 6%
It should be noted that, of the qualifications available this quarter, 1,820 had no achievements this quarter and 1,387 had no achievements in the past 12 months.
The continued increase in the number of higher level qualifications is evident from figure 4. We can see that from 2010 the gap between the number of available qualifications and the number of higher level qualifications with awards has increased.
The qualifications making up the difference in numbers between the available higher level qualifications and higher level qualifications with awards are the inactive
[image:9.595.73.524.240.497.2]qualifications (qualifications with no certificates in the past 12 months).
Figure 4: Total number of available higher qualifications per quarter, and total number of higher qualifications with awards, April ‒ June 2008 (2008 Q2) to April ‒ June 2013 (2013 Q2)
0 250 500 750 1,000 1,250 1,500 1,750 2,000 2,250 2,500 2,750
N
u
m
b
e
r
o
f
q
u
a
li
fi
c
a
ti
o
n
s
Inactive qualifications
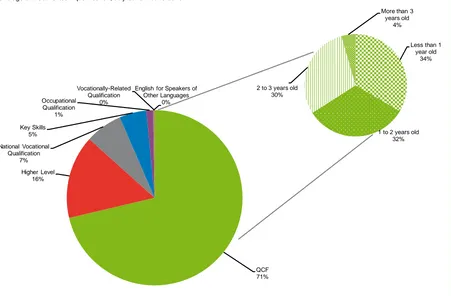
Inactive qualifications are those that were available for award during this quarter but where no award was made in the 12 months to June 2013. Figure 5 shows the number of inactive qualifications by type and by age (how long they have been available). In April – June 2013, 2,552 qualifications were available, of which 1,387 were inactive (54 per cent).
Two-thirds of the inactive QCF qualifications are less than two years old. It may take one to two years before we see qualifications being awarded after they become available so we might expect some of these inactive qualifications to be awarded in the coming quarters.
Simple regression model analysis has been used to evaluate if each sector subject area has more or fewer inactive qualifications than expected, given its number of available qualifications. The number of inactive qualifications has a very good relationship to the number of available qualifications for each sector subject area – that is, the greater the number of qualifications in a sector, the larger the number of inactive qualifications.
[image:10.595.75.526.216.512.2]Key: QCF: Qualifications and Credit Framework; NVQ: National Vocational Qualification; ESOL: English for Speakers of Other Languages.
Figure 5: Proportion of available qualifications (April - June 2013) that have been inactive (July 2012 – June 2013) by type of qualification and age of inactive QCF qualification, July 2012 – June 2013
QCF 71% Higher Level
16% National Vocational
Qualification 7% Key Skills
5%
Occupational Qualification
1%
English for Speakers of Other Languages
0% Vocationally-Related
Qualification 0%
Less than 1 year old
34%
1 to 2 years old 32% 2 to 3 years old
30%
More than 3 years old
The model assumes that all sector subject areas should have the same proportion of inactive qualifications, which means that sector subject areas with more available qualifications should have more inactive qualifications. However, although some of the inactive qualifications are being replaced by new qualifications they have not been removed from the database and are still classified as available. For that reason, the results of this analysis should be interpreted with caution.
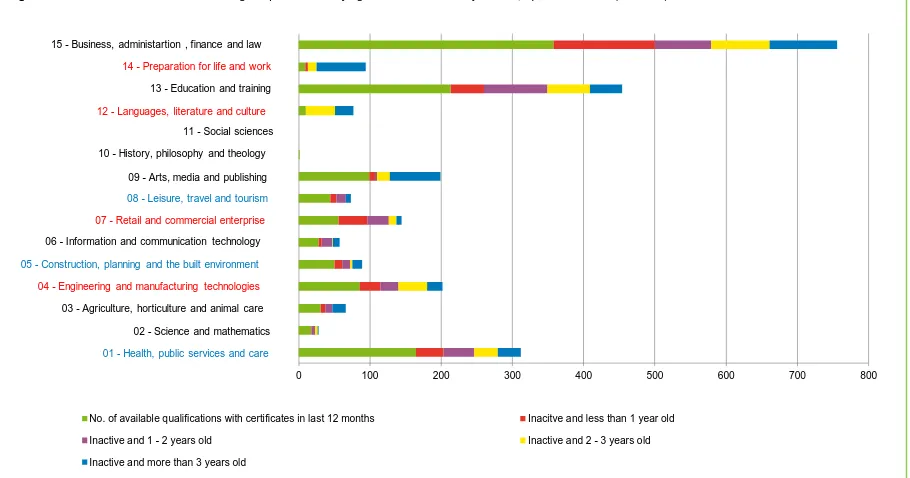
Figure 6 shows the number of available qualifications with achievements for each sector subject area, broken down by the length of time they have been available.
Sector subject areas are highlighted in blue (on left side of the chart) to show where there are fewer inactive qualifications than expected given the number of available qualifications; sector subject areas highlighted in red show the opposite pattern.
Four sector subject areas had more inactive qualifications given the number of available qualifications (highlighted in red). All inactive qualifications in the
languages, literature and culture sector are more than a year old and no certificates have been issued in more than two years. Of the 67 qualifications in the languages, literature and culture sector, 63 are from Oxford, Cambridge and RSA Examinations (OCR) (94 per cent of qualifications); all qualifications from OCR in this sector are inactive. Similarly, around 95 per cent of all inactive qualifications in the preparation for life and work sector have been available for more than two years (81 of the 85 inactive qualifications). All inactive qualifications in this sector subject area are level 4 qualifications. In the retail and commercial enterprise sector subject area, 92 per cent
Figure 6: Number of available and inactive higher qualifications by age for each sector subject area, April - June 2013 (2013 Q2)
Sector subject areas highlighted in blue indicate that there are fewer inactive qualifications given the number of available qualifications; sector subject areas highlighted in red show the opposite.
0 100 200 300 400 500 600 700 800
No. of available qualifications with certificates in last 12 months Inacitve and less than 1 year old
Inactive and 1 - 2 years old Inactive and 2 - 3 years old
Inactive and more than 3 years old 14 - Preparation for life and work
13 - Education and training
12 - Languages, literature and culture 11 - Social sciences
10 - History, philosophy and theology
09 - Arts, media and publishing
08 - Leisure, travel and tourism 07 - Retail and commercial enterprise 06 - Information and communication technology
05 - Construction, planning and the built environment 04 - Engineering and manufacturing technologies
03 - Agriculture, horticulture and animal care
02 - Science and mathematics
01 - Health, public services and care
of inactive QCF qualifications have been available for at least three years (81 of 88 inactive qualifications).
Certificates issued by awarding organisations
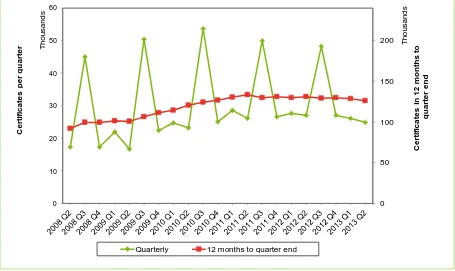
There were 24,900 certificates (see table 2 in the appendix) issued in higher level qualifications during April ‒ June 2013, a decrease of 8 per cent on the same quarter of 2012 (see figure 7). This is the lowest number of certificates issued in a quarter since April ‒ June 2011.
The majority of the certificates are for QCF qualifications (22,950 certificates, 92 per cent). The decline in the overall number of certificates for this quarter can be mainly attributed to the fall in certifications for NVQ qualifcations compared to April ‒ June 2012. For more information see tables 2 and 6 in the appendix.
Figure 7 shows that the 12 months to quarter end series has an overall increase in certificate numbers over the last five years, although the increase has been less significant over the past two years (the quarter with the highest 12-month sum of certificates was quarter 2 of 2011) and in fact, there is a slight decrease over the past few quarters.
[image:13.595.72.527.303.574.2]The quarterly figures show significant peaks in quarter 3 each year, although this pattern has started to diminish over the last two years.
Figure 7: Total number of certificates per quarter and in the 12 months to the end of each quarter, April ‒ June 2008 (2008 Q2) to April ‒ June 2013 (2013 Q2)
0 50 100 150 200 0 10 20 30 40 50 60 C e rt if ic a te s i n 1 2 m o n th s t o q u a rt e r e n d T h o u sa n d s C e rt if ic a te s p e r q u a rt e
r Th
o u sa n d s
Certificates by awarding organisation
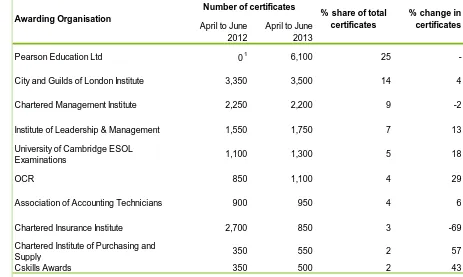
The ten awarding organisations with the highest number of certificates represent 75 per cent of all certificates issued in April ‒ June 2013 (Figure 8).
Pearson Education Ltd (which now offers qualifications from both Edexcel and EDI) continues to issue the highest number of certificates: 6,100 awards in April ‒ June 2013. In April to June 2012, Edexcel issued 4,900 certificates, and EDI issued 400, so there has been an overall increase for these organisations since the same quarter of last year.
The number of certificates issued by OCR had been declining. However, we see an increase of 29 per cent this quarter compared to April ‒ June 2012 (1,100 certificates compared to 850 certificates in 2012), mainly due to an increased number of QCF qualification certificates.
April to June 2012
April to June 2013
Pearson Education Ltd 01 6,100 25
-City and Guilds of London Institute 3,350 3,500 14 4
Chartered Management Institute 2,250 2,200 9 -2
Institute of Leadership & Management 1,550 1,750 7 13
University of Cambridge ESOL
Examinations 1,100 1,300 5 18
OCR 850 1,100 4 29
Association of Accounting Technicians 900 950 4 6
Chartered Insurance Institute 2,700 850 3 -69
Chartered Institute of Purchasing and
Supply 350 550 2 57
Cskills Awards 350 500 2 43
1 Due to the merger of EDI and Pearson Education Ltd the number of certificates awarded are shown as zero for April – June 2012
Awarding Organisation
Number of certificates
[image:14.595.60.523.194.471.2]% change in certificates Figure 8: The ten awarding organisations with the most certificates in higher qualifications, April ‒ June 2013 (April ‒
June 2012 figures shown for comparison)
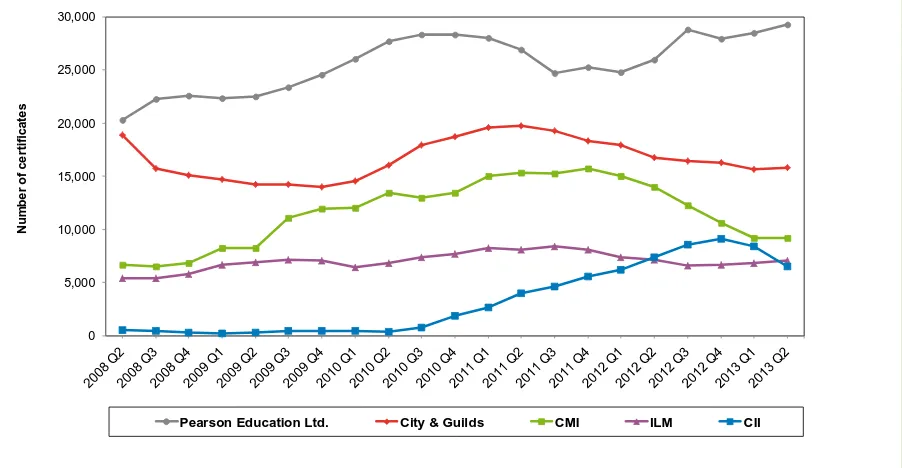
Figure 9 shows that the number of certificates for Chartered Insurance Institute (CII) qualifications has started to decline in the 12 months to quarter end. The same pattern also occurs for the ifs School of Finance (figures not shown) which can be explained by the decline in the number of certificates issued for ifs Level 4 Diploma for Financial Advisers qualification. These could both be a result of the Retail Distribution Review, carried out by the Financial Services Authority, which required financial advisers to have, at least, a qualification at level 4 by the end of 2012, where previously it was at level 3 – this pressure having worked its way through the market.
The numbers of certificates issued by the City and Guilds of London Institute and the Institute of Leadership and Management (ILM) had been falling if the above trends are considered; however, there has been an increase in numbers of certificates issued this quarter compared to same quarter in 2012, which bucks these trends. The biggest increase in awards for the City and Guilds of London Institute was seen for its Level 4 Award in Preparing to Teach in the Lifelong Learning Sector (QCF) (from 350 certificates issued in April to June 2012 to 1,950 certificates this quarter). The increase in numbers of ILM certificates issued can be attributed to its business management qualifications (a 13 per cent increase this quarter compared to April – June 2012, from 1,550 certificates issued to 1,750 certificates).
[image:15.595.75.526.122.356.2]Key: CII: Chartered Insurance Institute; CMI: Chartered Management Institute; ILM: Institute of Leadership and Management.
Figure 9: The five awarding organisations with the most certificates in higher qualifications for the 12 months to the end of each quarter, showing the trend from April - June 2008 (2008 Q2) to April - June 2013 (2013 Q2)
Prior to the merger of Pearson Education Ltd. and EDI (this quarter), the number of certificates for Pearson Education Ltd. only includes certificates awarded by Pearson Education Ltd. (Edexcel)
0 5,000 10,000 15,000 20,000 25,000 30,000
N
u
m
b
e
r
o
f
c
e
rti
fi
c
a
te
s
The 50 awarding organisations with the most certificates issued are listed in table 4 in the appendix.
Certificates by qualification
The five qualifications with the highest number of certificates issued make up 21 per cent of all certificates during the April – June 2013 period.
Qualifications in preparing to teach in the lifelong learning sector have seen large increases in the number of certificates issued this quarter (figure 10). This is because they are now the minimum requirements for those who wish to gain the full
qualification to reach qualified teacher status in the lifelong learning sector.2 Ten of the 50 qualifications with the highest number of certificates issued, shown in table 3 in the appendix, are in preparing to teach in the lifelong learning sector.
The CII Level 4 Diploma in Financial Planning (QCF) (shown in table 3 in the
appendix) had high numbers of certificates issued in the past, but the number fell this quarter from 2,200 certificates issued in April ‒ June 2012 to 350 this quarter, a decrease of 84 per cent. Again, this could be affected by the Retail Distribution Review, carried out by the Financial Services Authority (see above).
2
Preparing to Teach in the Lifelong Learning Sector, University of Cambridge: April to June
2012
April to June 2013
City & Guilds Level 4 Award in Preparing to Teach in the Lifelong
Learning Sector (QCF) 350 1,950 457
Cambridge ESOL Level 5 Certificate in Teaching English to
Speakers of Other Languages (CELTA) (QCF) 900 1,200 33
AAT Level 4 Diploma in Accounting (QCF) 850 950 12
Pearson BTEC Level 4 Certificate in Teaching in the Lifelong
Learning Sector (QCF) 650 650 0
Pearson BTEC Level 5 HND Diploma in Business (QCF) 200 550 175
Qualification
Number of certificates
% change Figure 10: The five higher qualifications with the most certificates, April ‒ June 2013 (April ‒ June 2012
Number of qualifications by percentage of all certificates
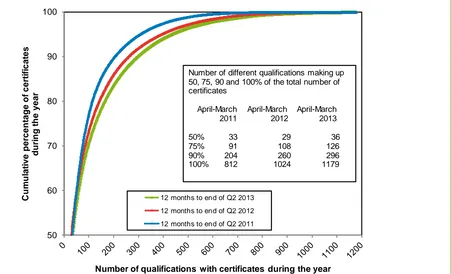
Figure 11 shows an overall growth in the number of qualifications being awarded compared to previous years. 75 per cent of certifications in April – March 2011 were made up from 91 qualifications whereas in April – March 2013 this had increased to 126. This reflects the decline in the average number of certificates issued per
qualification (figure 12) and the general increase in the number of available higher level qualifications.
When we look at the average (median3) number of certificates per qualification for available qualifications with certificates (figure 12 below), we see that the number of certificates per qualification is highest in quarter 3 every year and, generally, the rest of the quarters have the same number of certificates. Since Q3 2011, the median number of certificates has declined when looking at the general trend for each quarter. One reason is that although the number of new qualifications coming onto the QCF framework has increased the overall number of certificates issued has not.
3
The median number lies in the middle of the range when all the numbers of certificates are ordered
[image:17.595.76.527.248.522.2]from low to high. It gives the value representing 50 per cent of all certifications.
Figure 11: Number of qualifications making up the total percentage of certificates for the 12 months to end of 2011 Q2 to 2013 Q2.
50 60 70 80 90 100 C u m u la ti v e p e rc e n ta g e o f c e rt if ic a te s d u ri n g t h e y e a r
Number of qualifications with certificates during the year
12 months to end of Q2 2013
12 months to end of Q2 2012
12 months to end of Q2 2011
Number of different qualifications making up 50, 75, 90 and 100% of the total number of certificates
April-March April-March April-March
2011 2012 2013
Figure 12: Median number of certificates per qualification for available qualifications with certificates, for 2008 Q2 to 2013 Q2.
10 15
9 9
8 21
9.5 10 10
18
10
9 9
14
8
8 8
11
7 5
7
0 5 10 15 20 25
M
e
d
ia
n
n
u
m
b
e
r
o
f
c
e
rt
if
ic
a
te
s
p
e
r
q
u
a
li
fi
c
a
ti
o
Certificates by sector subject area of qualification
Regulated higher level qualifications are allocated to one of 15 sector subject area codes (see our Statistical Publications Glossary4 for further details).
Figure 13 below shows, for the education and training sector, an increase of 10 per cent of certificates issues compared to the same quarter of last year. This can largely be explained by the greater number of students taking qualifications in preparing to teach in the lifelong learning sector, as discussed in the previous section.
The business, administration, finance and law sector subject area continues to show the highest number of certificates issued. Although this sector has seen growth in the number of certificates issued in higher level vocational qualifications since 2008, it has been declining since last year. This could be partly explained by the changes in the financial services sector.
The decrease in numbers in the art, media and publishing sector subject area is partly due to the decrease in the number of certificates issued in the University of the
Arts London (UAL) Level 4 Diploma in Art and Design – Foundation Studies (QCF)
qualification (1,500 certificates in April – June 2012 compares to zero this quarter).
The increase in certificates issued in the construction, planning and the built environment area is in line with the increase in certificates issued for the QCF
qualifications at level 5 (from 5,750 to 7,400 certificates), level 6 (from 1,200 to 1,350 certificates), and level 8 (from 50 to 100 certificates).
In a number of sector subject areas there was a reduction in the number of
certificates issued between April – June 2012 and April – June 2013. There was a 100 per cent decline in the history, philosophy and theology sector, from one certificate issued in April to June 2012 to none this quarter.
4
1 Health, public services and care 9 Arts, media and publishing
2 Science and mathematics 10 History, philosophy and theology
3 Agriculture, horticulture and animal care 11 Social sciences
[image:20.595.73.513.118.765.2]4 Engineering and manufacturing technologies 12 Languages, literature and culture 5 Construction, planning and the built environment 13 Education and training
Figure 13: Number of higher qualification certificates by sector subject area for April - June 2013 (2013 Q1) and the percentage growth and decline between April - June 2012 and April - June 2013 (red line showing the average change for all higher qualifications (8 per cent decrease))
2500
50 200
800 950
200 350 300
1500
0 0 50
7550 0 10450 0 2000 4000 6000 8000 10000 12000
1 2 3 4 5 6 7 8 9 10 11 12 13 14 15
N u m b e r o f ce rt if ica te s
Sector subject area
6% 2%
-20%
56% 36% 40%
-15% -1% -47% -100% 0% -80% 10% 111% -16% -120% -100% -80% -60% -40% -20% 0% 20% 40% 60% 80% 100% 120%
1 2 3 4 5 6 7 8 9 10 11 12 13 14 15
P e rce n ta g e g ro w th /d e cl in e
Figure 14 shows the five-year trend for the five sector subject areas with the most certificates issued in April ‒ June 2013 (see table 5 in the appendix for further details).
The number of certificates issued in the health, public services and care sector subject area had been decreasing, but this quarter there was an increase by 6 per cent to 2,500 certificates compared to 2,350 certificates in the same quarter in 2012. This increase can be attributed to the number of certificates issued for QCF
[image:21.595.74.544.160.435.2]qualifications ‒ from 850 certificates issued in April to June 2012 to 2,100 certificates this quarter. There is no particular QCF qualification that contributed to this growth.
Figure 14: Total number of higher qualification certificates in the 12 months to the end of each quarter, April - June 2008 (2008 Q2) to April – June
2013 (2013 Q2)
0 10,000 20,000 30,000 40,000 50,000 60,000 70,000
N
u
m
b
e
r
o
f
c
e
rt
if
ic
a
te
s
15 - Business, Administration and Law 13 - Education and Training
01 - Health, Public Services and Care 09 - Arts, Media and Publishing
Certificates by level of qualification
All regulated qualifications are assigned a level, ranging from entry, then 1 to 8 (see our Statistical Publications Glossary5 for full details). Higher level qualifications are those at levels 4 to 8.
Figure 15 shows the large variation in the number of certificates issued by level and the variation in changes by level between April – June 2012 and this quarter. Of the five higher levels, only levels 5, 6 and 8 showed an increase in the number of certificates issued since April – June 2012. Level 5 showed an increase of 12 per cent, to 7,750 certificates, level 6 showed an increase of 10 per cent, while level 8 showed an increase of 192 per cent (but at this level only 100 certificates were issued this quarter – which accounts for the disproportionately large variation). It should be noted that qualifications at level 8 included Chartered Management
Institute (CMI) Level 8 in Strategic Direction and Leadership (QCF) which is awarded in three different sizes (award, certificate and diploma).
The main reason for the decline in the overall number of level 7 certificates issued can be explained by the decline in numbers taking Strategic Management and Leadership qualifications. Together, these qualifications saw a decline of over 500 certificates issued.
The decline in numbers of level 4 certificates issued is in line with a decrease of under 5,000 certificates in three particular qualifications: CII Level 4 Diploma in Financial Planning (QCF), UAL Level 4 Diploma in Arts and Design – Foundation Studies (QCF) and City & Guilds Level 4 Award in Preparing to Teach in the Lifelong Learning Sector.
Considering this trend over the last five years (see table 7 in the appendix), it can be seen that certificate numbers issued for level 4 and level 5 qualifications reached their maximum value in the 12 months to April – June 2011 and 12 months to January – March 2011, respectively. Since then the numbers of certificates issued have been fairly stable. The number of certificates issued for level 7 qualifications has been increasing up to 12 months to quarter end Q3 2012 but this is now declining. The number of certificates issued for level 6 and level 8 qualifications continues to increase, although the numbers are small for level 8 qualifications.
Figure 15: Number of higher qualification certificates by level for April - June 2012 (2013 Q2) and the
percentage growth and decline in certificates between April - June 2012 and April - June 2013 by level (red line showing average change for all higher qualifications (8 per cent decrease))
0 2,000 4,000 6,000 8,000 10,000 12,000 14,000 16,000
Level 4 Level 5 Level 6 Level 7 Level 8
N
u
m
b
e
r
o
f
c
e
rt
if
ic
a
te
s
-15%
12% 10%
-37%
192%
-50% 0% 50% 100% 150% 200%
Level 4 Level 5 Level 6 Level 7 Level 8
P
e
rc
e
n
ta
g
e
g
ro
w
th
/d
e
c
li
n
Background notes
In this release we present data on available regulated qualifications (except GCSEs and A levels) and the number of certificates issued for these qualifications. The data cover England, Wales and Northern Ireland and the figures represent both the quarter April – June 2013 and the 12-month period to June 2013.
Data source
Information on qualifications is taken from our Register of Regulated Qualifications. The Register is used by awarding organisations to submit qualifications for
accreditation and to maintain details of their qualifications. We use the Register for regulatory activity. Data on qualifications, covering title, type, awarding organisation, sector subject area and level are regarded as administrative data.
Each quarter, all recognised awarding organisations submit data to us about the number of qualifications they have awarded in England, Wales and Northern Ireland, regardless of the age of the student and the type of school or college. Awards are counted in the quarter when the qualification was awarded. This release shows the number of awards broken down by awarding organisation, sector subject area, type of qualification and level of qualification.
Limitations of data
Data are collected at the earliest point available, which is the first day of the next reporting period. This reduces the time between the activity and reporting on the activity.
We cannot guarantee the number of certificates sent to us is correct although we expect awarding organisations to send us the correct data. We do send summary data to awarding organisations for checking and confirmation. The figures reported in this release are reflective of the certificates issued by awarding organisations at the time of data collection
We carry out quality assurance procedures to ensure the accuracy of the data and challenge/question where necessary. We may also defer publication if the statistics are not considered fit for purpose.
Comparisons in this release are only made with data from the same period of the previous year and the 12-month periods. This is because of seasonal changes in the number of certificates over the year.
different qualification types, for example NVQs and the QCF. This release presents figures on seven of these qualification types: English for speakers of other
languages, higher level, key skills, National Vocational Qualifications (NVQ),
occupational qualifications, Qualifications and Credit Framework (QCF), vocationally related qualifications.
Geographical coverage
In this release we present data on certificates for all regulated qualifications at level 4 and above in England, Wales and Northern Ireland during the April – June 2013 quarter. Statistics for Scotland are on the Scottish Qualifications Authority website.6
Revisions
Once published, data on the number of certificates for any qualification are not usually subject to revision, although subsequent releases may be revised to insert late data or if an error is identified. Qualifications may also be re-categorised to a different type, level, sector subject area or awarding organisation. In some cases, data may be amended to reflect the new categorisation.
Pearson Education Ltd was previously known as Edexcel. The awarding organisations Edexcel and EDI merged to form Pearson Education Ltd, so
qualifications by EDI will no longer appear in the data published but figures presented reflect both Edexcel and EDI qualifications, from this quarter onwards.
In this release, figures from WJEC have been revised since the January ‒ March 2013 release. These revisions affect quarters Q2 2012 onwards. Figures from Confederation of International Beauty Therapy and Cosmetology have also been revised since April – June 2010.
Completeness of the data
Awarding organisations send us data each quarter. We contact any awarding
organisation that does not return a complete set of data within the collection period to make sure that the data are as complete as possible. For this quarter, we received data from all the awarding organisations.
Confidentiality
To ensure the statistics in this publication protect confidentiality, all figures are rounded to the nearest 50 and values less than 25 will appear as ‘0’. A value of zero will appear as ‘-’.
6
The Scottish Qualifications Authority is the national accreditation and awarding organisation in
Rounding
Figures in the commentary and tables for the number of certificates are rounded to the nearest 50. This reflects the inaccuracies inherent in any large-scale data collection and makes reading them easier. As a result of rounded figures, the percentages shown in pie charts may not necessarily add up to 100 per cent.
Users of these statistics
These statistics are of particular interest to recognised awarding organisations, and the Department for Business, Innovation and Skills (BIS) in understanding the landscape of vocational qualifications in order to inform policy decisions. Awarding organisations use these statistics for commercial reasons. Other users include government policy officials, academics, researchers, members of the public, other government departments in Wales and other interested parties and individual.
Related Statistics and Publications
This release is one of a suite of two publications that present quarterly statistics on certificates for regulated qualifications. The other release is called Vocational and Other Qualifications Quarterly7, which covers certificates in NVQs, vocationally related qualifications, QCF qualifications and occupational qualifications at all levels. There will be some overlap between the figures in this release and those in the
Vocational and Other Qualifications Quarterly because qualifications covered in this release are a subset of the qualifications covered in the other release.
A number of other statistical releases and publications provide contextual information to this statistical release, including:
Wolf Review of Vocational Education and BIS’s review of adult literacy and
numeracy provision, New Challenges, New Chances (December 2011):
www.gov.uk/government/uploads which covers detailed proposals of the reform
of further education for adults aged 19 and over.
The Quarterly Statistics Report published by the Scottish Qualifications Authority: www.sqa.org.uk/sqa/files_ccc/Quarterly covers registration and certifications for qualifications taken in Scotland.
The Specification of Apprenticeship Standards for England (SASE) sets out the minimum requirements to be included in a recognised Apprenticeship
framework: www.gov.uk/government/uploads which sets out the minimum
requirements to be included in a recognised English framework.
The Statistical First Release (SFR) published by the Department for Education:
SFR:GCSE and equivalent result in England 2011/12:
www.gov.uk/government/uploads covers pupil GCSE and equivalent regulated qualifications achievement in Schools at the end of KS4; and the SFR: A Level and equivalent result in England, 2011/12: www.gov.uk/government/uploads
covers achievements in 16–18 year old pupils at schools and colleges in all level 3 qualifications.
The Quarterly Statistical First Release published by the Department for Business, Innovation and Skills reports on apprenticeship volumes:
www.thedataservice.org.uk/NR/rdonlyres which covers statistics on adult (19+) government funded participation, achievement and success rate for Further Education and Apprenticeships participation and achievements for all ages (16+) in England. It also shows figures on certificates issued in vocational qualifications in the UK, as collected by Ofqual and through the National Vocational Qualifications Database.
Useful information
The raw data behind these statistics are available on our website.8
A glossary of terms is available in the next section for assistance in interpreting this release.
Our publication schedule of the next releases can be found on our website.9 Our
Statistical Publications Glossary provides further details on sector subject area classifications and qualification types and levels, and is available on our website.10
A detailed guidance document and further information on data collection is also available on our website. 11
The Register gives information on regulated qualifications and recognised awarding organisations in England, Wales and Northern Ireland.12
8
www.ofqual.gov.uk/standards/statistics/vocational-data
9
www.ofqual.gov.uk/standards/statistics/
10
www.ofqual.gov.uk/files/2010-11-26-statistics-glossary.pdf
11
www.ofqual.gov.uk/standards/statistics/vocational-data
12
Glossary of terms
A level – also known as General Certificates of Education are available as advanced level qualifications (A levels) and advanced subsidiary (AS). They are the
qualifications that the majority of young people use to gain entry to university.
Accreditation – a process that reviews and confirms certification to specific criteria and standards.
Accredited qualification – one that has met the relevant criteria as set by the regulators of qualifications in England, Wales and Northern Ireland. Once approved for accreditation a qualification will be awarded with a Qualification Accreditation Number (QAN), and specific dates set for the period for which the qualification will be accredited. The qualification is then said to be regulated.
Active qualification – a qualification where a certificate has been awarded.
Available qualification – a qualification eligible for an award or a qualification that has made an award even if it is no longer eligible (no longer available for students to enrol on). For the purpose of this release, a qualification is available until the
certification end date or if an award has been certified during the reporting period.
Awarding organisation – an organisation recognised to develop, deliver and award descriptions of qualifications.
Certificate/Certification – a formal acknowledgement of a student’s achievement. This will be any award that is not graded as U, absent, or X (fail).
Certification end date – the last date on which a student may be issued with a certificate of achievement for the qualification.
GCSE – General Certificates of Secondary Education are the main school leaving qualification in England. They are available in a range of subjects and can be studied alongside other qualifications. They are generally sat by 15–18 year olds in schools and colleges but are open to anyone who wants to gain a qualification.
Level – Qualifications are assigned a level from Entry, Level 1 through to Level 8. Descriptions are available in the Statistical Publications Glossary on our website.
National Vocational Qualification – work-related, competence-based qualifications that cover a broad range of industry sectors and occupations, and are delivered in a workplace setting.
directly work-related but may support career development. They are often structured against graded examinations. The category also includes qualifications at level 1/level 2, also known as IGCSEs.
Qualifications and Credit Framework – provides students, learning providers and employers with an inclusive and flexible regulated qualifications framework
containing units and qualifications that recognise the widest possible range of quality-assured student certificates. There are three sizes: award (1-12 credits), certificate (13-36 credits) or diploma (37 or more credits).
Quarter – refers to calendar quarters. So quarter 1 (Q1) refers to January – March, quarter 2 (Q2) to April – June, quarter 3 (Q3) to July – September, and quarter 4 (Q4) to October – December.
Recognition – the formal process, operated by Ofqual, whereby applicants who wish to offer regulated qualifications can demonstrate that they meet the Recognition Criteria. It is a robust gateway into the regulated market place. Only applicants who meet the criteria in full will be recognised.
Register – the Register of Regulated Qualifications contains details of Recognised awarding organisations and regulated qualifications: www.register.ofqual.gov.uk
Regulated – an accredited qualification is one that has met the relevant criteria as set by the regulators of qualifications in England, Wales and Northern Ireland. On accreditation a qualification will be issued with a qualification accreditation number, and specific dates set for the period for which the qualification will be accredited. The qualification is then said to be regulated.
Your feedback
If you use this statistical release, we would be interested in hearing what you use the statistics for and how well they meet your requirements. We also value your feedback on any aspect of these statistics, including content, timing and format.
Appendix
Table 1 Number of available higher level qualifications by type of qualification and per quarter
Table 2 Total number of certificates for higher level qualifications per quarter
Table 3 The 50 higher level qualifications with the highest number of certificates this quarter compared to the same quarter of last year
Table 4 The 50 awarding organisations with the highest number of certificates in higher level qualifications this quarter compared to the same
quarter of last year
Table 5 Total number of certificates in higher level qualifications by sector subject area
Table 6 Total number of certificates in higher level qualifications by qualification type
Period
English for speakers
of other languages Higher level Key skills NVQ
Occupational
qualification QCF
Vocationally related qualification
Total number of qualifications
2007-8 11 505 32 399 33 108 1,088
2008-9 12 545 32 365 37 160 1,151
2009-10 11 577 68 315 35 496 1,502
2010-11 10 554 78 291 35 1,117 2,085
2011-12 5 491 72 256 33 1,562 2,419
2012-13 4 419 72 239 33 1,721 1 2,489
Oct-Dec 2007 11 421 32 363 33 33 893
Jan-Mar 2008 11 446 32 364 33 46 932
Apr-Jun 2008 11 423 32 370 33 83 952
Jul-Sep 2008 11 502 32 372 33 108 1,058
Oct-Dec 2008 11 472 32 319 33 117 984
Jan-Mar 2009 12 510 32 328 36 135 1,053
Apr-Jun 2009 12 500 32 317 37 143 1,041
Jul-Sep 2009 11 505 32 286 36 154 1,024
Oct-Dec 2009 11 526 2 301 33 152 1,025
Jan-Mar 2010 10 545 6 301 33 222 1,117
Apr-Jun 2010 10 534 60 299 33 206 1,142
Jul-Sep 2010 10 540 67 290 33 489 1,429
Oct-Dec 2010 10 552 72 291 35 580 1,540
Jan-Mar 2011 9 540 78 264 33 773 1,697
Apr-Jun 2011 9 529 72 268 33 930 1,841
Jul-Sep 2011 9 504 72 267 35 1,100 1,987
Oct-Dec 2011 5 484 72 255 33 1,249 2,098
Jan-Mar 2012 5 446 72 249 33 1,338 2,143
Apr-Jun 2012 5 423 72 246 33 1,427 2,206
Jul-Sep 2012 5 419 72 244 33 1,554 2,327
Oct-Dec 2012 4 414 72 239 33 1,625 2,387
Jan-Mar 2013 4 411 72 224 29 1,725 1 2,466
England, Wales & Northern Ireland
Source: Regulated Qualifications Activity Database
Blank cells indicate that there were no available qualifications Notes:
1. Data are supplied by awarding organisations
[image:33.842.81.731.117.433.2]Table 2: Total certificates for higher level qualifications, 2007-8 to
April – June 2013
Period Total number of certificates
2007-8 99,200
2008-9 106,200
2009-10 123,900
2010-11 129,650
2011-12 129,350
2012-13 53,100
Oct-Dec 2007 17,100
Jan-Mar 2008 19,900
Apr-Jun 2008 17,300
Jul-Sep 2008 44,900
Oct-Dec 2008 17,200
Jan-Mar 2009 21,900
Apr-Jun 2009 16,750
Jul-Sep 2009 50,350
Oct-Dec 2009 22,350
Jan-Mar 2010 24,700
Apr-Jun 2010 23,200
Jul-Sep 2010 53,650
Oct-Dec 2010 25,050
Jan-Mar 2011 28,650
Apr-Jun 2011 26,100
Jul-Sep 2011 49,850
Oct-Dec 2011 26,500
Jan-Mar 2012 27,600
Apr-Jun 2012 27,050
Jul-Sep 2012 48,200
Oct-Dec 2012 27,050
Jan-Mar 2013 26,050
Source: Regulated Qualifications Activity Database
England, Wales & Northern Ireland
Notes:
1. Data are supplied by awarding organisations
2. Annual data are for academic years, that is October to December
Table 3: The 50 higher level qualifications with the highest number
of certificates, April – June 2013 (April – June 2012 shown for
comparison)
Qualification April-June 2012 April-June 2013 350 1950 900 1200 850 950 650 650 200 550 800 500 50 500 650 450 2200 350 200 300 400 300 150 300 200 300 200 250 350 250 100 250 50 250 150 250 550 200 350 200 100 200 300 200 50 200 0 200 150 200 0 200 200 200 600 150 100 150 50 150 150 150 150 150 100 150 50 150 200 150 0 150 100 150 50 150 100 150 150 150 0 100 100 100 100 100 100 100 100 100 100 100 50 100 100 100 50 100 0 100England, Wales & Northern Ireland
Total number of certificates
City & Guilds Level 4 Award in Preparing to Teach in the Lifelong Learning Sector (QCF)
Cambridge ESOL Level 5 Certificate in Teaching English to Speakers of Other Languages (CELTA) (QCF) AAT Level 4 Diploma in Accounting (QCF)
Pearson BTEC Level 4 Certificate in Teaching in the Lifelong Learning Sector (QCF) Pearson BTEC Level 5 HND Diploma in Business (QCF)
CMI Level 5 Certificate in Management and Leadership (QCF)
Pearson Edexcel Level 4 Award In Preparing to Teach in the Lifelong Learning Sector (QCF) Pearson BTEC Level 7 Extended Diploma in Strategic Management and Leadership (QCF) CII Level 4 Diploma in Financial Planning (QCF)
CMI Level 5 Award in Management and Leadership (QCF) CFA UK Level 4 Certificate in Investment Management (QCF) ILM Level 5 Award In Management (QCF)
Pearson BTEC Level 5 Diploma in Management and Leadership (QCF) CIPS Level 4 Foundation Diploma in Purchasing and Supply
CMI Level 5 Diploma in Management and Leadership (QCF)
Cskills Awards Level 6 NVQ Diploma in Construction Site Management (QCF)
City & Guilds Level 5 Diploma in Leadership for Health and Social Care and Children and Young People's Services (England) (QCF)
OCR Level 4 Award in Preparing to Teach in the Lifelong Learning Sector (QCF) IFS Level 4 Diploma for Financial Advisers (QCF)
ISTD Level 4 Certificate in Vocational Graded Examination in Dance: Advanced 1 (QCF) Ascentis Level 4 Award In Preparing to Teach in the Lifelong Learning Sector (QCF) CII Level 6 Advanced Diploma in Financial Planning (QCF)
Pearson BTEC Level 4 HNC Diploma in Construction and the Built Environment (QCF) CMI Level 5 Certificate in Police Management (QCF)
City & Guilds Level 4 Award in the Internal Quality Assurance of Assessment Processes and Practice (QCF) HABC Level 4 Award In Preparing to Teach in the Lifelong Learning Sector (QCF)
CISI Level 4 Diploma in Investment Advice (QCF)
Pearson BTEC Level 4 Award in Preparing to Teach in the Lifelong Learning Sector (QCF) CIPS Level 5 Advanced Diploma in Purchasing and Supply
Pearson Edexcel Level 5 Diploma in Leadership for Health and Social Care and Children and Young People's Services (England) (QCF)
CIM Level 6 Professional Diploma in Marketing
ILM Level 5 Certificate in Coaching and Mentoring in Management (QCF)
Pearson Edexcel Level 4 Award in the Internal Quality Assurance of Assessment Processes and Practice (QCF)
Pearson BTEC Level 4 Foundation Diploma in Art and Design (QCF) CII Level 4 Diploma in Regulated Financial Planning (QCF)
NCFE Level 4 Award In Preparing to Teach in the Lifelong Learning Sector (QCF) Pearson Edexcel Level 4 NVQ in Supply Chain Management
Cskills Awards Level 6 NVQ Diploma in Controlling Lifting Operations - Planning Lifts (Construction)(QCF) CIM Level 4 Professional Certificate in Marketing
City & Guilds Level 5 Diploma in Teaching in the Lifelong Learning Sector (QCF) IAM Level 4 Diploma In School Business Management (QCF)
OCR Level 4 NVQ Diploma in Advice and Guidance (QCF) ISTD Level 4 Diploma in Dance Education (QCF) ILM Level 5 NVQ Diploma in Management (QCF)
Notes:
1. Data are supplied by awarding organisations
2. Annual data are for academic years, that is October to December
Source: Regulated Qualifications Activity Database
CMI Level 7 Certificate in Strategic Management and Leadership (QCF) Pearson Edexcel Level 5 NVQ Diploma in Management (QCF)
NOCN Level 4 Award in Preparing to Teach in the Lifelong Learning Sector (QCF) CMI Level 6 Award in Management and Leadership (QCF)
UWLQ Level 4 Diploma in Music Performance (QCF)
Table 4: The 50 awarding organisations with the highest number of
certificates in higher level qualifications, April – June 2013 (April –
June 2012 shown for comparison)
England, Wales & Northern Ireland
Awarding organisation April-June
2012 April-June 2013 0 6,100 3,350 3,500 2,250 2,200 1,550 1,750 1,100 1,300 850 1,100 900 950 2,700 850 350 550 350 500 600 450 150 300 400 300 100 300 0 300 250 300 800 250 600 250 100 250 500 250 100 250 100 200 150 200 50 150 150 150 150 150 50 150 100 150 150 100 150 100 100 100 100 100 0 100 0 100 150 100 150 100 100 100 0 50 200 50 0 50 150 50 0 50 50 50 50 50 100 50 100 50 100 50 50 50 0 50 0 50
Total number of certificates
Pearson Education Ltd
City and Guilds of London Institute Chartered Management Institute Institute of Leadership & Management University of Cambridge ESOL Examinations OCR
Association of Accounting Technicians Chartered Insurance Institute
Chartered Institute of Purchasing and Supply Cskills Awards
Imperial Society of Teachers of Dancing Institute of Administrative Management CFA Society of UK
Highfield Awarding Body for Compliance ATHE Ltd
Chartered Institute of Marketing Trinity College London IFS School of Finance Ascentis
Chartered Institute for Securities & Investment National Open College Network
NCFE
Chartered Institute of Environmental Health University of West London
VTCT
Equestrian Qualifications Limited
Excellence, Achievement & Learning Limited Active IQ
Council for Awards in Care, Health and Education ABC Awards
British Institute of Facilities Management
Counselling and Psychotherapy Central Awarding Body Institute of Sales and Marketing Management
International Dance Teachers Association WAMITAB
Institute of Commercial Management Royal Academy of Dance
Chartered Institute of Housing
Association of Chartered Certified Accountants Awarding Body for Vocational Achievement Ltd The Confederation of Tourism and Hospitality Scottish Qualifications Authority trading as SQA Royal Society for Public Health
Chartered Institute of Logistics and Transport in the UK Chartered Institute of Personnel and Development
Rounding: All figures are rounded to the nearest 50, values less than 25 will appear as '0' , value of '0' will appear Notes:
1. Data are supplied by awarding organisations
2. Annual data are for academic years, that is October to December Mineral Products Qualifications Council
IMI Awards Ltd
London Centre of Marketing
Awarding Body for the Built Environment NCC Education Services
– June 2013
Period Health, public services and care Science and mathematics Agriculture, horticulture and animal care Engineering and manufacturing technologies Construction, planning and thebuilt environment Retail and commercial enterprise Leisure, travel and tourism
Arts, media and publishing History, philosophy and theology Social sciences Languages, literature and culture Education and training Preparation for life and work
Business, administration, finance and law
Total number of certificates
2007-8 20,600 350 1,250 2,850 3,850 1,300 450 7,300 - - 900 16,950 150 40,800 99,200
2008-9 20,550 800 1,150 3,300 4,750 1,500 450 9,750 - 0 500 17,500 200 43,650 106,200
2009-10 22,350 650 950 3,600 5,150 2,100 900 10,300 0 - 500 24,050 100 51,750 123,900
2010-11 19,900 300 700 3,350 3,450 1,500 1,100 10,900 0 0 400 28,150 50 58,400 129,650
2011-12 12,350 200 750 4,700 4,000 2,200 1,300 8,850 0 0 650 30,850 100 62,000 129,350
2012-13 5,100 50 250 1,000 1,400 800 450 2,200 0 - 350 13,500 50 27,700 53,100
Oct-Dec 2007 4,550 50 200 350 650 300 0 200 - - 400 3,650 0 6,350 17,100
Jan-Mar 2008 4,700 100 300 150 500 300 50 400 - - 50 4,300 0 8,950 19,900
Apr-Jun 2008 5,200 50 300 200 550 400 50 450 - - 400 3,850 50 5,450 17,300
Jul-Sep 2008 6,150 150 400 2,150 2,200 300 350 6,300 - - 50 5,150 50 20,000 44,900
Oct-Dec 2008 5,100 100 250 450 550 350 50 450 - - 300 3,000 0 6,300 17,200
Jan-Mar 2009 4,400 250 250 350 550 200 50 1,200 - - 50 2,650 0 11,500 21,900
Apr-Jun 2009 4,750 0 200 250 950 350 50 1,150 - - 50 2,850 50 6,000 16,750
Jul-Sep 2009 6,250 400 450 2,300 2,650 600 300 6,950 - - 100 9,000 150 19,800 50,350
Oct-Dec 2009 5,400 50 200 500 950 550 100 350 - - 350 4,750 0 8,800 22,350
Jan-Mar 2010 5,200 200 250 300 850 600 200 800 0 - 50 4,900 50 11,100 24,700
Apr-Jun 2010 5,250 50 150 200 1,000 300 150 1,100 - - 50 5,850 0 9,000 23,200
Jul-Sep 2010 6,500 350 350 2,650 2,400 600 450 8,100 - - 50 8,550 50 22,850 53,650
Oct-Dec 2010 5,150 50 150 400 600 500 200 950 0 0 300 5,700 0 10,650 25,050
Jan-Mar 2011 4,650 50 100 250 550 350 250 1,300 - - 50 6,050 0 14,800 28,650
Apr-Jun 2011 4,450 50 200 350 550 250 100 1,050 - - 50 6,600 0 12,450 26,100
Jul-Sep 2011 5,700 200 200 2,300 1,800 450 500 7,600 - - 50 9,800 0 20,450 49,850
Oct-Dec 2011 3,050 50 150 500 700 400 200 1,250 0 - 150 5,900 0 13,800 26,500
Jan-Mar 2012 3,050 50 150 500 500 500 250 950 - 0 100 7,250 0 14,100 27,600
Apr-Jun 2012 2,350 50 250 500 700 450 300 2,800 0 - 150 6,850 0 12,500 27,050
Jul-Sep 2012 3,900 100 250 3,200 2,100 850 500 3,800 - - 250 10,850 50 21,600 48,200
Oct-Dec 2012 2,500 0 200 600 700 450 200 1,300 - - 200 6,050 0 14,550 27,050
Jan-Mar 2013 2,600 50 50 400 650 350 250 900 0 - 100 7,400 0 13,150 26,050
England, Wales & Northern Ireland
2,500 2,050 1,500 1,450 1,400 300 350 50 400 1,650 200 750 450 100 1,300 400 200 50 850 400 150 50 850 350 200 150 150 Information and communication technology
Source: Regulated Qualifications Activity Database
Notes:
1. Data are supplied by awarding organisations
2. Annual data are for academic years, that is October to September
Rounding: All figures are rounded to the nearest 50, values less than 25 will appear as '0' , value of '0' will appear as '-'. Figures have been rounded independently so may not sum to the total.
[image:37.842.74.769.118.351.2]Table 6: Total number of certificates in higher level qualifications by
qualification type, 2007-8 to April – June 2013
Period Higher level Key skills NVQ
Occupational qualification
Total number of certificates
2007-8 52,200 150 31,100 4,150 99,200
2008-9 44,650 200 31,650 4,300 106,200
2009-10 46,600 100 34,450 4,250 123,900
2010-11 30,300 50 25,800 3,250 129,650
2011-12 16,850 0 8,600 900 129,350
2012-13 4,050 - 1,750 100 53,100
Oct-Dec 2007 10,150 0 5,450 850 17,100
Jan-Mar 2008 9,000 0 7,500 950 19,900
Apr-Jun 2008 6,800 50 7,100 1,000 17,300
Jul-Sep 2008 26,300 50 11,050 1,350 44,900
Oct-Dec 2008 7,100 0 6,450 1,000 17,200
Jan-Mar 2009 8,900 0 7,600 1,000 21,900
Apr-Jun 2009 4,600 50 6,100 1,000 16,750
Jul-Sep 2009 24,050 150 11,550 1,250 50,350
Oct-Dec 2009 7,900 0 7,250 1,050 22,350
Jan-Mar 2010 8,250 50 8,650 1,000 24,700
Apr-Jun 2010 6,850 0 7,150 950 23,200
Jul-Sep 2010 23,600 50 11,400 1,250 53,650
Oct-Dec 2010 6,800 0 6,800 950 25,050
Jan-Mar 2011 7,500 0 7,500 800 28,650
Apr-Jun 2011 3,900 0 6,100 750 26,100
Jul-Sep 2011 12,100 0 5,400 750 49,850
Oct-Dec 2011 4,000 0 3,250 400 26,500
Jan-Mar 2012 3,600 - 2,300 250 27,600
Apr-Jun 2012 2,500 - 1,650 100 27,050
Jul-Sep 2012 6,700 0 1,400 100 48,200
Oct-Dec 2012 2,000 - 1,000 50 27,050
Jan-Mar 2013 2,050 - 750 50 26,050
England, Wales & Northern Ireland
English for speakers of
other languages QCF
3,600 8,050 1,450 23,900 700 37,800 0 70,250 - 103,000 50 47,150 300 350 1,100 1,400 1,300 1,050 900 5,250 200 2,450 250 4,100 400 4,600 600 12,750 300 5,850 350 6,400 0 8,250 50 17,350 0 10,500 0 12,800 - 40,000 - 15,300 - 31,600 - 18,800 Notes:
1. Data are supplied by awarding organisations
2. Annual data are for academic years, that is October to September
Rounding: All figures are rounded to the nearest 50, values less than 25 will appear as '0' , value of '0' will appear as '-'. Figures have been rounded independently so may not sum to the total.
Source: Regulated Qualifications Activity Database
0 23,200
- 21,400
- 22,800
level, 2007-8 to April – June 2013 and vocational qualifications,
from 2007-8 to April – June 2013
Level 4 Level 5 Level 7 Level 8
Total number of certificates
2007-8 60,500 27,300 4,000 - 99,200
2008-9 62,000 31,500 5,000 50 106,200
2009-10 72,450 35,950 7,000 150 123,900
2010-11 78,350 35,650 6,250 200 129,650
2011-12 74,950 34,950 9,600 300 129,350
2012-13 30,700 13,850 3,200 150 53,100
Oct-Dec 2007 12,000 3,550 700 - 17,100
Jan-Mar 2008 13,550 3,650 550 - 19,900
Apr-Jun 2008 12,550 3,000 1,150 - 17,300
Jul-Sep 2008 22,350 17,100 1,600 - 44,900
Oct-Dec 2008 11,250 3,750 1,100 - 17,200
Jan-Mar 2009 13,500 5,300 1,100 - 21,900
Apr-Jun 2009 11,800 3,500 850 0 16,750
Jul-Sep 2009 25,450 19,050 1,950 0 50,350
Oct-Dec 2009 13,450 6,250 1,250 50 22,350
Jan-Mar 2010 16,400 5,700 1,550 50 24,700
Apr-Jun 2010 14,450 6,500 1,500 0 23,200
Jul-Sep 2010 28,150 17,500 2,750 50 53,650
Oct-Dec 2010 15,700 6,200 1,450 100 25,050
Jan-Mar 2011 18,150 7,450 1,550 50 28,650
Apr-Jun 2011 16,750 6,350 1,150 0 26,100
Jul-Sep 2011 27,750 15,700 2,100 100 49,850
Oct-Dec 2011 15,100 6,950 2,850 50 26,500
Jan-Mar 2012 15,200 7,100 2,250 100 27,600
Apr-Jun 2012 16,500 6,950 2,050 50 27,050
Jul-Sep 2012 28,150 13,950 2,500 50 48,200
Oct-Dec 2012 16,400 6,500 1,700 50 27,050
Jan-Mar 2013 14,300 7,350 1,450 100 26,050
Notes:
9,150 9,550 5,200 England, Wales & Northern Ireland
Level 6 7,400 7,650 8,300 850 2,150 600 3,850 1,150 2,000 550 3,900 1,350 1,000 800 5,200 1,650 1,450 1,850 4,200 1,550 2,950
2. Annual data are for academic years, that is October to September
Rounding: All figures are rounded to the nearest 50, values less than 25 will appear as '0' , value of '0' will appear as '-'.
Figures have been rounded independently so may not sum to the total. 1. Data are supplied by awarding organisations
2,800 1,500 3,550 2,400
[image:39.595.72.464.149.615.2]We wish to make our publications widely accessible. Please contact us if you have any specific accessibility requirements.
First published by the Office of Qualifications and Examinations Regulation in 2013
© Crown copyright 2013
You may re-use this publication (not including logos) free of charge in any format or medium, under the terms of the Open Government Licence. To view this licence, visit
The National Archives; or write to the Information Policy Team, The National Archives, Kew, Richmond, Surrey, TW9 4DU; or email:
psi@nationalarchives.gsi.gov.uk
This publication is also available on our website at www.ofqual.gov.uk
Any enquiries regarding this publication should be sent to us at:
Office of Qualifications and Examinations Regulation
Spring Place 2nd Floor
Coventry Business Park Glendinning House
Herald Avenue 6 Murray Street
Coventry CV5 6UB Belfast BT1 6DN
Telephone 0300 303 3344 Textphone 0300 303 3345