© 2012 Martínez et al., licensee InTech. This is an open access chapter distributed under the terms of the Creative Commons Attribution License (http://creativecommons.org/licenses/by/3.0), which permits unrestricted use, distribution, and reproduction in any medium, provided the original work is properly cited.
Improving Climate Risk Management
at Local Level – Techniques, Case Studies,
Good Practices and Guidelines for World
Meteorological Organization Members
R. Martínez, D. Hemming, L. Malone, N. Bermudez,
G. Cockfield, A. Diongue, J. Hansen, A. Hildebrand, K. Ingram,
G. Jakeman, M. Kadi, G. R. McGregor, S. Mushtaq, P. Rao, R. Pulwarty,
O. Ndiaye, G. Srinivasan, Eh. Seck, N. White and R. Zougmoré
Additional information is available at the end of the chapter
http://dx.doi.org/10.5772/51554
1. Introduction
Climate can be viewed in a number of ways. As a constraint or setting, climate provides the broad boundary conditions within which a range of ecosystems services function. Climate may be considered a determinant in that it may be part of a causal chain of direct or indirect events leading to a particular impact or outcome. Climate can also be viewed as a resource; this notion implies that climate has a value, could be managed and manipulated and by extension could be allocated. More often than not, climate is viewed as a hazard. Whichever of these views of climate is adopted, it is clear that climate has a close relationship with nature and society and therefore climate variability and change may pose a range of risks for environments, societies and economies.
As our understanding of the climate system and our ability to predict it into the future have improved, and as society has become more aware of the possible costs and benefits of managing (including adapting to) climate risks (see Box 1. ‘Climate risk definition’), individuals, communities and organisations are seeking suitable information, tools and techniques to enable appropriate management decisions to be made. These need to be accessible, dependable, usable, credible, authoritative, responsive, flexible and sustainable.
coordinated and sustainable application of resources to reduce, monitor and control the probability and or impact of detrimental effects, is known broadly as Climate Risk Management (CRM).
There are a number of challenges for CRM. Climate risks pose what has been termed a
wicked problem1. Wicked problems do not have set solutions; instead, greater
understanding of the wicked problem and partial solutions to the problem evolve iteratively within the social contexts of the scientists/analysts, intermediary agents, and end users. As well, there is no commonly accepted methodology for assessing and prioritising climate risks, identifying key thresholds in these risks, or for considering what are important criteria for managing these risks.
Current challenges for climate risk decision makers include identification of and assessing timely, reliable and appropriate climate risk information and then using that information to make well informed decisions. These are not simple processes given the complexity of the social and institutional mechanisms, the multiple potential sources of climate information (not all of which is consistent or authorative or easy to understand), and the multi-faceted nature of information, that are often involved in such decisions. Appropriate approaches and principles should be adopted to foster collaborations among climate risk information users and providers, and enable the implementation of effective management actions.
The World Meteorological Organization (WMO) and partnering agencies have recognized the needs of users of all kinds for relevant, actionable climate information for CRM and are taking steps to address those needs. Thousands of scientists and decision makers from climate and other disciplines met at World Climate Conference-3 (WCC-3, 31 August to 4
Box 1. Climate risk definition
There are many definitions of ‘risk’ depending on the application and context. Based on the Intergovernmental Panel on Climate Change definition of disaster risk (IPCC, 2012), climate risk can be defined qualitatively as the likelihood of unfavourable impacts occurring as a result of severe climate events interacting with vulnerable environmental, social, economic, political or cultural conditions.
September, 2009, Geneva, Switzerland) to discuss the issues, and concluded that a Global Framework for Climate Services (GFCS) was needed to organize and provide users with the climate information, products and services appropriate to their requirements. Following
WCC-3, a major report (WMO-No 1065) on the GFCS outlined, inter alia, current capabilities
around the world, the needs and opportunities for climate services and recommendations. The GFCS is designed to mainstream climate science into decision making at all levels and help ensure that every country and every climate-sensitive sector of society is well equipped to access and apply relevant climate information, enabling an adjustment of planning and decisions to optimize the given situation. The application of climate services must therefore involve close interaction between all stakeholders including the providers and the users,
and requires concerted multi-disciplinary efforts2. The ultimate goal of GFCS is to: “Enable
better management of the risks of climate variability and change at all levels, through development and incorporation of science-based climate information and prediction into planning, policy and practice.”
In 2011, the WMO agreed to implement the GFCS, and is working with partnering agencies to develop or strengthen the many contributions to the GFCS, in terms of observations, monitoring, research, services and capacity development, all with a user focus and engagement. As part of this effort, experts from around the world are collaborating to scope requirements for CRM, develop methods for interacting effectively with user communities, and improve applications of climate information for user benefit.
Motivated by the need to ensure the effectiveness of the GFCS, and the associated requirement to improve the practical application of CRM at local levels, in order to reduce climate impacts, build resilience to climate variability and change and contribute to poverty reduction and development, the WMO Task Team on Climate Risk Management (TT-CRM) organized a CRM Symposium in Guayaquil, Ecuador in October 2011. Experts in a wide range of climate and risk disciplines from all the continents and key agencies working with WMO on the GFCS implementation attended. The overarching aim of the Symposium was to help both providers and users of climate information in the development and application of information on climate variability and change, in an operational ‘no regrets’ sense, for minimizing climate-related risks and maximizing any opportunities that may. As a result of this international meeting, innovative approaches for CRM were discussed, practical examples of best practice were highlighted, and guidance for appropriate processes, tools and techniques to adopt were proposed.
2. The process of CRM
Many CRM frameworks, that include different key steps and elements (actors, tools, techniques etc.), have been developed to provide guidance and a degree of consistency for
applying risk management to a range of climate-related issues3,4,5,6. These frameworks tend
to be conceptual and general so that they can be easily applied to a wide range of concerns by both technical and non-technical users, and may vary in their foci and level of detail ranging from international to local, or general to sector specific.
Despite the variety of frameworks and tools for assessing and managing climate risks,
utilisation of the output to enable decision making is advancing rather slowly7. Continued
guidance by risk management experts to begin the CRM process with user and provider engagement and collaboration has often not been considered, and assessments are still typically conducted by scientists and then the information is handed to users in a one-way exchange - the so called top-down approach - that often does not promote effective decision making. It is important to continue to promote collaboration between assessors and stakeholders (providers and users of climate information) at all stages of the CRM process, to enable all parties to understand the steps involved in the knowledge to action pathway, and therefore to facilitate effective and sustainable CRM responses.
The WMO Symposium on CRM discussed various CRM frameworks and steps, which has enabled the TT-CRM to identify the following key steps that are considered essential to consider in a CRM process. These should not be regarded in a linear manner, but rather combined in an iterative or cyclical order:
User and provider engagement and collaboration
Climate risk assessment
Communication and dissemination of climate risk knowledge, information and tools
Adaptation and capacity development
Monitoring, evaluation and improvement
Some of the key points for each of these steps are highlighted below, and practical examples, to demonstrate good practice on how they have been applied to real-life CRM projects, are provided.
Box 2. Climate Risk Management (CRM)
The World Meteorological Organization Task Team on Climate Risk Management (TT-CRM), based on the expert guidance from
the Symposium on CRM, proposes a definition of CRM as a
2.1. User and provider engagement & collaboration
Breuer and colleagues8 compared the traditional research model, in which researchers
develop new technologies or tools that extension agents (professionals trained in skills such as communication and group facilitation, and usually also in technical areas of the sector they serve) deliver to end users, to a pipeline that delivers water. They proposed an alternate loop model, in which the loop encircles end-users, extension agents, and researchers with diverse opportunities for interactions among this co-learning community. The symposium supported this approach, and further recommended that science-based learning communities or communities of practice use as many methods as possible for engagement and collaboration.
In this section the engagement of agricultural stakeholders, particularly through experiences with the Southeast Climate Consortium of the United States of America (USA) (SECC), is emphasized. However, the same principles could be applied successfully for CRM decision makers in other sectors, for example water resource managers, coastal community planners, or wildlife managers.
The work of extension agents has been particularly successfully applied in the agricultural sector. Opportunities to engage end-users, e.g. farmers, in the process of developing a decision support system have included surveys, interviews, sondeos, workshops, focus groups, working groups, presentations and displays at association meetings, and on-line
feedback8,9,10. An example of good practice in this sector has been the SECC, who developed
AgroClimate (see http://agroclimate.org/), an on-line decision support system for extension
agents and end users, using all of the engagement opportunities described above8,11,12 .
The most important points for engaging farmers and outreach workers as research collaborators identified through the experiences of SECC are straightforward: 1) knowing which questions to ask; and 2) listening to the answers. The various methods that were used for engagement with end users follow the basic iterative steps outlined in Box 3. ‘Steps for engaging farmers and outreach workers’, but each is unique in terms of the depth and breadth of information that they can evoke.
Box 3. Steps for engaging farmers and outreach workers
1. Ask what they want.
2. Listen.
3. Give them what you think they asked for.
4. Ask them whether you’ve given them what they need.
5. Listen.
6. Observe whether they use the information or tools that you have
given them.
7. Modify what you have provided.
By providing a range of engagement methods, individuals can self select how they will engage in the community, depending on their level of interest, availability of time, and willingness to commit to an activity. This ability of community members to select the engagement activities in which they will participate applies to nearly all members of the community, including end-users, extension agents, and researchers. The exception to the self selection clause is a core team of three or more individuals who are fully committed to the community. The SECC strives to have a team that includes at least one social scientist (anthropologist or rural sociologist), climate scientist, and agricultural scientist. The ability of this committed team to work together will be the most critical factor in the success of the engagement.
Two of the engagement methods noted above – sondeos and working groups (both powerful and less commonly used in other reported participatory research approaches) – are further described:
2.1.1. Sondeos
A sondeo (Spanish for sounding) is a semi-structured discussion in which a two- to three-person multi-disciplinary team engages one or two people from the target audience in
conversation8. Most of the sondeos conducted for the SECC have been part of a graduate
course in field research methods. The students and their instructors meet to discuss the problem of interest and to agree on a general set of questions to ask. These questions are a guide to conversation, rather than a formal questionnaire. The course members divide into small multi-disciplinary teams to conduct their conversations, typically at the residence or place of work for the people of target audience. For the agricultural community, extension agents have been vital in helping identify people from diverse target audiences, where the targets have included small and large farms, vegetable growers at farmers markets, farmers with and without irrigation, and others.
An important benefit to a conversational approach is that it often elicits key issues that the researcher could not have anticipated, issues that would likely have been missed with an interview or survey that has a list of pre-established questions. In keeping with its conversational nature, the researchers do not take notes during the conversation. Rather, when the conversation is completed, each researcher writes their own synthesis of the discussion. In one day, a single team can usually complete three or four discussions, which typically last about one hour, followed by note writing.
2.1.2. Climate working groups
A working group includes members from science and the broader community who meet regularly, typically 3 or 4 times per year, to engage in dialogue on the new findings from
science, information and technology needs of the broader community9. The steps for
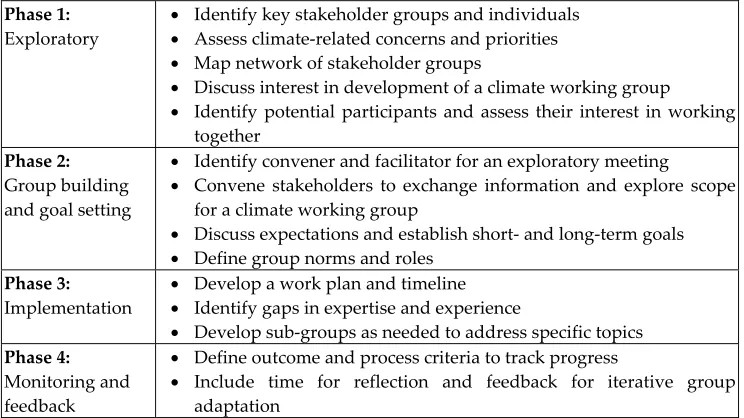
building and nurturing a climate working group are outlined in Table 1. The SECC has successfully established working groups for agricultural and water supply utility communities. Both have about 25 to 30 members and both are highly productive, yet each has distinct features that reflect the differences among the communities.
A key element to the success of a climate working group is commitment, both on the part of the individual members of the groups and the institutions that they represent, if any. For example, most members of the water supply utility climate working group represent a particular water provider, city, or agency. If a member of any particular institution is not able to attend a meeting, the participating institutions identify an alternate who can attend. This policy provides both continuity and assures that the institutions have also committed to the working group.
Phase 1:
Exploratory
Identify key stakeholder groups and individuals
Assess climate-related concerns and priorities
Map network of stakeholder groups
Discuss interest in development of a climate working group
Identify potential participants and assess their interest in working
together
Phase 2:
Group building and goal setting
Identify convener and facilitator for an exploratory meeting
Convene stakeholders to exchange information and explore scope
for a climate working group
Discuss expectations and establish short- and long-term goals
Define group norms and roles
Phase 3:
Implementation
Develop a work plan and timeline
Identify gaps in expertise and experience
Develop sub-groups as needed to address specific topics
Phase 4:
Monitoring and feedback
Define outcome and process criteria to track progress
Include time for reflection and feedback for iterative group
[image:7.482.56.428.276.485.2]adaptation
Table 1.Phases and activities for the building and nurturing a climate working group. Source: Bartels et al. (2011)9.
well as improving the research and education programs of the science community. Most importantly, climate working groups engage members from diverse stakeholder groups that might not otherwise interact and promote the legitimacy of the science community as a source of information and technology that is relevant to solving the wicked climate problems that society faces.
2.2. Climate risk assessment
As with the definition of climate risk, or CRM, there are many definitions of risk assessment. A common theme across most is the requirement for a process and/or technique that provides information with which to assess the key risk or risks. For example, the Society for Risk Analysis proposes that: “Risk assessment is the process of establishing information regarding acceptable levels of a risk and/or levels of risk for an individual, group, society, or the environment” (see: http://www.sra.org/resources_glossary_p-r.php).
Risk assessments involve analysis techniques, methodologies and tools that have the key quality of assessing uncertainty (a common quality of risk), either quantitatively or qualitatively, and representing this as some measure of likelihood and/or probability. Climate risk assessment is used to help decision makers optimize resources for responding to climate-related disasters and reducing risks and impacts associated with current and future-projected climate variablity and change. It is one of the first stages of CRM, and involves identification and synthesis of hazard and vulnerability information/data that is relevant to the specific climate-related risks identified through the ‘User and provider engagement and collaboration’ step. One very important consideration in all climate risk assessments is the balance between the quantification of climate hazards (intensity, frequency and/or duration) and the approach to estimate the main elements of vulnerability on the ground i.e. level of exposure, poverty, exclusion, education, organizational capacity, infrastructure among others. Both hazard and vulnerability estimations may be validated using historical information of climate events and changes in socio-economic vulnerabilities and associated impacts. However, such assessment may encounter problems, for example, in some cases quality of data may be poor, data may not be available, skill of forecasts at different scales can be low. As well, even if the climate information is complete and correct, the user may not access it, or may not understand or know how to apply it.
Indicators of climate-related risks (impacts, hazards and vulnerabilities) are often used to focus a risk assessment on the specific areas of interest for the decision maker. Indicators are values that can be monitored (and/or modelled) to assess changes in the state of a system, and are important tools for simplifying complex processes, with potentially multiple drivers and feedbacks, into useful and accessible information. Defining which indicators are appropriate for decision makers, as well as climate monitoring or projection purposes can be
a complex process, and many different approaches have been adopted13,14,15,16. One of the
more common approaches used for indicator-based studies uses the driving force-pressure-state-impact-response (DPSIR), pressure-state-response (PSR) or driving
Climate risk assessments typically include statistical analyses of historical climate indicator records and assessment of information on climate-sensitive impacts, together with understanding of the climate mechanisms and the cascade of processes leading to these impacts. Geographical information and mapping may also be used to assess the zones where impacts are recurrent and are associated with human losses and/or infrastructure damages. Temporal changes of impacts and their related climate hazard characteristics are also often a key part of climate risk assessment, and may be directly linked with social, economical or environmental variables which may change exposure and resilience. In an ideal world, there would be millions of meteorological stations contributing to development of an accurate idea of the historical evolution of climate variables. The reality is, however, that there are not enough meteorological stations, the available stations are not evenly distributed in time and space, available data are not always digitized or shared, and there can be problems in some cases in the quality, completeness or homogeneity of the available data. Notwithstanding such issues, individual climate records measured at specific places integrate the history of the complex interactions between land, air, sea, ecosystems, and community in those locales. The final result is expressed in those climate records and consequently the history of this whole interaction process is reflected in time series of the measured values, or of their departures from a chosen reference period.
Analysis derived from climate indices/indexes, such as that provided by the CCl/CLIVAR/JCOMM Expert Team (ET) on Climate Change Detection and Indices (ETCCDI) (see http://www.clivar.org/organization/etccdi/etccdi.php) is a powerful tool that can be applied at local level. In places where high quality climate records (preferably long period, minimal gaps, and homogeneous) are available, the information that can be delivered through such climate analysis is absolutely useful, in conjunction with social and economic and other information for that locale, in DRR, adaptation and CRM processes. Such information is more accurate and in most cases more appropriate than that generated by downscaled models, but in zones where there are no available stations, information generated by downscaling is the next best alternative.
Climate risk assessment may also include a future element, utilising climate change projections and/or ‘what-if’ scenarios to explore the potential impacts of future scenarios of change. Practical obstacles to using information about future conditions are diverse, ranging from limitations in modeling climate system complexities (e.g. projections having coarse spatial and temporal resolution, limited predictability of some relevant variables, at scales that matter for decision making and forecast skill characterization), to procedural, institutional, and cognitive barriers in receiving or understanding climatic information, and
the capacity and willingness of decision-makers to modify actions20,21. In addition,
functional, structural, and social factors inhibit joint problem identification and collaborative knowledge production between providers and users. These include divergent objectives, needs, scope, and priorities; different institutional settings and standards, as well as
Figure 1. Climate-related risk map for agriculture in the highlands of Ecuador. Color scale: Red: high risk; Light green: low risk; Grey: no data. Source: MAE (2012) www.ambiente.gob.ec
exposure and susceptibility both increase vulnerability, increases in coping capacity reduce it. This approach mixes physical exposure (i.e. the presence (location) of people, livelihoods, environmental services and resources, infrastructure, or economic, social, or cultural assets in places that could be adversely affected by physical events and which, thereby, are subject to potential future harm, loss, or damage) with the social determinants of vulnerability.
According to the most recent IPCC-SREX Report (2012)22, the IPCC describes vulnerability
as the propensity or predisposition to be adversely affected. Every location on the planet has its own vulnerability profile and a specific evolution pattern. Historically this vulnerability pattern can be approximated with some social or economical indicators, statistics of disaster or land use multi-temporal comparison. The central focus of climate risk assessment is to understand the relevant climate hazards and their evolution over time, together with the vulnerabilities and how these have evolved, and a likely to change in the future, in a particular area. It is not possible to implement CRM or adaptation actions only with climate scenarios. This information must be complemented with the estimation of current vulnerability and potential future evolution.
No single, consistent approach for conducting risk assessments has emerged, instead a
range of different techniques have been used24. The choice of a particular technique is
influenced by several factors, including: the goal of the assessment, the exposure units to be studied (an exposure unit is defined as the sector, location or activity being assessed), availability of data, choice of models suitable for the projection of future outcomes, and the time frame involved. A major challenge for future climate change assessments is the uncertainty associated with future projections and the propagation of this uncertainty
throughout an impact assessment3. One approach has been to give a range of uncertainty
bounded by low and high scenarios of climate change. However the outcomes of such analyses may be too broad for planning effective adaptation.
An example of a successful climate risk assessment for the agricultural areas in the highlands region of Ecuador was developed in 2011 by the International Research Center on El Niño (CIIFEN), Ecuador. This was requested by the Ministry of Environment as part of the National Plan for Adaptation. For the assessment, agricultural areas were identified based on up-to-date satellite information, and specific field verification. Information and indicators for agriculture aptitude, erosion, hydrological deficit, level of access to water for irrigation, type of soil, were considered, and social and economical indicators were selected. All information was analyzed spatially at parish level and combined to produce a vulnerability map covering the Ecuadorian highland region. This was further combined with historical climate hazard maps of “dry consecutive days” and “high temperature indexes”, as reported in the Second National Communication of
Ecuador to the UNFCCC, 200925. The resultant map of the climate risks for the agricultural
2.3. Communication and dissemination of climate risk knowledge, information
and tools
The term ‘risk communication’ as used here,refers to intentional efforts on the part of one or
more sources (e.g. international agencies, local government, communities) to provide information about hazards and hazard adjustments through a variety of channels among themselves or to different audiences (e.g. the general public, specific at-risk communities), for the purpose of influencing the recipients to apply the information and take appropriate action. It also includes efforts of local communities to characterize and communicate their
risk-based experiences. Lindell and Perry (2004)26 summarized the available research as
indicating message effects include pre-decisional processes (reception, attention, and comprehension). Several studies have identified the characteristics of pre-decisional
practices that lead to effective communication over the long-term27,28,29.
Communicating and disseminating risk information can be very challenging. One of the first steps for effective communication is to ensure two-way communication channels, where information providers and users can interact equally and explain misunderstandings. Before
starting a CRM process, it is paramount to build and apply “climate information chains”30,
as discussed above. This involves a complex network of institutions involved in the end-to-end process of CRM, i.e. National Meteorological and Hydrological Services (NMHSs), disaster management agencies, national and local authorities, the media, private sector, community representatives, and public and private agencies of strategic sectors such as agriculture, health, water resources. Such a complex network requires diverse means of
communication, which has included web-based GIS tools with, inter alia, real time
information updates, e-mail distribution lists, text alerts and high-frequency radio transmission which is useful for remote locations. A climate information chain should have legitimacy, credibility and be interactive. It is a kind of “living mechanism” that must be kept operational. To get people and institutions engaged in this chain, dialogues, meetings and agreements are also necessary. One example of an operational mechanism for communicating and disseminating risk information would be regional or national climate outlook forums (RCOFs and NCOFs). In these forums, climate information providers and users meet (either face-to-face or virtually), usually on the release of a seasonal climate forecast. The opportunity to share information, discuss issues and build knowledge has proven invaluable in many parts of the world (for further information and references, see http://www.wmo.int/pages/prog/wcp/wcasp/wcasp_home_en.html).
was built and the main climate hazards that threaten this community31. There is indeed
considerable evidence to show that if communities at risk are actively involved in information collection and analyses then they are far more likely to rely on that information
than if it is just provided to them from ‘outside’30. Information is also regarded as credible to
local actors if it is collected and reported by individuals recognized by the central bureaucracy and locals as responsible observers with minimal political motive, such as
teachers or extension workers32. One effective way to consolidate climate information chains
is through their usefulness. If such informaiton chains become operational and communities respond effectively during planning, early prepardness and response, users become engaged and empowered by the system because they feel they are part of it.
Examples of risk information generation and diffusion efforts within disaster research and response communities include interpersonal contact with particular researchers, planning and conceptual foresight (as in Red Cross/Red Crescent brochures), outside consultation on the planning process (as per the Federal Emergency Management Agency of the USA (FEMA)), and user-oriented transformation of information and individual and organizational leadership. The characteristics of risk communication messages involve information quality (specificity, consistency, and source certainty) and information reinforcement (number of warnings) that have significant impacts on adoption of
adjustments33,34. Messaging should also aim to foster ‘no-regrets’ actions, in which the
recipient of the information takes climate-related decisions or action to maximize positive and minimize negative outcomes of climate variability and change.
2.4. Adaptation and capacity development
The IPCC definition of adaptation to climate change is the “adjustment in natural or human systems in response to actual or expected climatic stimuli or their effects, which moderates
harm or exploits beneficial opportunities”35. From a conceptual point of view adaptation
and capacity development are part of the overall CRM approach. In practical implementations of adaptation projects these two compartments often become indistinguishable, for example, Monsoon Forum meetings, which focus on preparedness planning for monsoon season climate variability across Asia (see http://www.rimes.int /societal/monsoon-forum), often also involve training sessions to build capacity across the community. However, there is a strong tendency to try to separate and manage adaptation and capacity development independently of each other, as well as from the other steps involved in CRM. This can cause a negative effect on implementation and makes the institutional information framework which is necessary to get effective responses in human systems more complex.
other risk management) plans of national disaster management or other government agencies. For example, the UK government Department for Environment, Food and Rural Affairs’ (DEFRA) Climate Change Risk Assessment was one of the requirements from the UK government’s Climate Change Act (for further details see http://www.defra.gov.uk /environment/ climate/government/risk-assessment/).
One of the key issues for adaptation is its local nature. CRM or adaptation processes require ownership by communities, not only their authorities, for successful implementation. Such ownership is strongly connected with the perception that individuals have about the risks, the current impacts over them and how they are able to affect their integrity and progress. To encourage this perception, climate risks must be clearly identified and presented to communities, and this information must be validated with local data, information and local community feedback with experiences of how the population has coped with recent climate impacts. Setting up practices and mechanisms for coping with climate variability in the here-and-now is an important step in preparedness for future climate changes. NMHSs are important partners for providing such local climate and meteorological information to inform adaptation. Given a local perception of climate risk, it is easier to generate adaptation strategies and solutions with the community and negotiated with the authorities, and implement action plans designed by the community. Particularities in local plans are key points from the cultural and social point of view. By adopting a local focus to CRM, adaptation is necessarily a bottom up social construction implemented by local communities.
Past experience in capacity development for CRM suggests that providing a single recipe to conduct capacity development efforts has limitations. Some principles for a more comprehensive and effective approach, based on good practice, are therefore proposed as guidance:
Consider sustainability of capacity development through continual rotation of technical
staff in national and local agencies;
Design training strategies under a “train the trainers approach”;
Prepare educational material combining scientific and indigeneous knowledge;
Ensure a robust institutional and stakeholders network to support the capacity
development process (with multi-level stakeholder coordination and communication);
Consider blended training courses, with both face to face activities supported by
e-learning systems;
Implement accountability mechanisms for both capacity development implementers
and beneficiaries;
Ensure an effective and long-term monitoring and evaluation mechanism involving
national and local institutions;
Keep accessible databases of people trained and the impact of the capacity development
in their current activities;
Develop a long-term strategy for education (alongside shorter courses), such as the
Co-share capacity development efforts with beneficiaries;
Encourage allocation of financial support from national, local or private stakeholders to
support CRM capacity development;
Develop the capacity of information providers to deliver improved information,
services and products, through, for example, improving the observing networks and climate risk modeling capability.
2.5. Monitoring, evaluation and improvement
Monitoring, evaluation and improvement are important elements in CRM. Monitoring could cover organizational, financial, operational, political, regulatory and other issues. It is required to collect relevant information and data to help quantify the risks, and to assess the success (or not) of adaptation or other interventions. Evaluation is the means by which the accomplishments are compared with the expected goals and what improvements are required to complete the iterative cycle proposed for CRM, within which there is an implicit assumption that progress should be continually sought.
Before implementing any monitoring, evaluation and improvements for CRM, some key indicators should be set up. It is unlikely that one single indicator can be identified to monitor all the risks (hazards and vulnerabilies) necessary to monitor the CRM process. However, to be practical, a few key indicators should be identified with the following attributes - quantitative (e.g: number of victims and cost of impacts), quality controlled based on standards (e.g: ISDR guidelines for design of EWS), and time limited.
The monitoring, evaluation and improvement step enables key oversight bodies (such as a NHMS, a regional health organization or other stakeholder) to track progress against initial conditions, and assess areas where corrective action is required. It can also be an important tool for the pursuit of resources to address gaps and deficiencies in the process, and to facilitate the dialogue between the relevant stakeholders in the risk management process at various levels, which is an essential part of a feedback loop between relevant stakeholders. Through this step the focus is kept on results – on reaching the desired goals – as well as on continual learning. It must be flexible, allowing for and even anticipating new challenges or opportunities, or new methods and understanding in the theory and application of CRM.
3. Role of early warning systems and adaptation planning within the
context of disaster risk reduction and CRM
"Neither society nor the environment are static. Consequently, neither is the risk" (Alan Lavell)
It is clear that CRM may encompass a wide range of temporal and spatial scales, depending on the nature of the risks and their socio-economic context. Both climate and disaster risk are considered as some integration of hazards, vulnerabilities and exposures (see Section 1), and EWSs may be integral to the adaptation measures used to manage these risks. An
important concept for Disaster Risk Reduction (DRR) taken from ISDR Glossary, 200936
property destruction or damage in a given period of time’. The action of DRR usually refers to the socio-economic objective of reducing that risk. In comparison, CRM is focused more towards the longer-term application of climate information and tools in a multidisciplinary scientific context to address both the positive and negative impacts of climate variability and change on society, infrastructure and life. The concepts of DRR and CRM are therefore complementary, both including a focus on risk management, and there are mutual advantages involved in designing integrated DRR and CRM projects.
If the integration requirements of DRR and CRM are considered according to impact scales (local, regional or global), it is clear that even if some climate phenomena relate to global causes they are materialized through locally-specific contexts, causing damage or losses depending on existing capacities in those local areas. Hence, the need to focus on improving the management capabilities of both DRR and CRM is especially important at local scales. Early Warning Systems (EWS) are often central to DRR and CRM, particularly over relatively short time scales (minutes to weeks), whereas other systems and tools that focus on longer-term adaptation planning tend to be more appropriate for CRM at longer time scales (months to decades). All such measures have the common aim of reducing vulnerability, increasing resilience and improving response capacities of people, economies and ecosystems at risk.
The UN International Strategy for Disaster Reduction (UNISDR) defines early warning as “the provision of timely and effective information, through identified institutions, that allows individuals exposed to a hazard to take action to avoid or reduce their risk and prepare for effective response”. Governments often maintain EWS to warn their citizens and themselves about impending hazards, resulting for example, from health, geologic, or, climate and weather-related drivers. Traditional assumptions are that effective functioning of EWS requires only prior knowledge of risks faced by communities and other users of the early warning information. Under a CRM framework EWSs are expanded to other adaptation planning measures, including technical monitoring and warning services for highlighting the risks and their potential impacts, effective strategies for dissemination of
understandable warnings to those at risk, and finally, knowledge and preparedness to act37.
Two additional elements have been introduced, 1) awareness that risks are changing (and which new risks may arise) and, 2) the need for constructing and communicating new
knowledge about future conditions that can be understood, trusted and used38,22. One goal is
to be prepared to use windows of opportunity for engaging and providing leadership, and for legitimizing risk management and successful communities of practice that have arisen during but also between events.
vulnerability and governance39,40,22. Countries or regions that have developed such systems
may also use them to develop and inform strategic adaptation response options to climate changes, thus developing broader institutional flexibility and preparedness, and reducing societal vulnerability.
For most locations early warning is still a linear process based on a “sender-receiver” model of risk communication. In this section, the term “early warning information system” is used to describe the more integrated process of risk assessment, communication and decision support, of which an “early warning” is a central output. An early warning information system involves much more than development and dissemination of a forecast, it is the systematic collection and analysis of relevant information about and coming from areas of impending risk that: (a) Informs the development of strategic responses to anticipate crises and crisis evolution; (b) Provides capabilities for generating problem-specific risk assessments and scenarios, and (c) Effectively communicates options to critical actors for the purposes of decision-making, preparedness and mitigation. Central to the implementation of this more comprehensive vision of “early warning information systems” is a detailed
examination of the root causes of the lack of early action41.
Numerous international and national EWS’ exist 42,43,44. In addition, many early warnings
directly and indirectly activate other warning systems in affected sectors and communities,
a process that has been referred to as a cascade of early warnings45. For the most part, EWS’
have been interpreted narrowly as technological instruments for detecting and forecasting impending hazard events and for issuing alerts. This interpretation, however, does not clarify whether information about impending events is actually communicated and used to
reduce risks44,22,46.
An example of good practice with an EWS is provided by the Climate Forecast Application in Bangladesh (CFAB) project. Heavy rainfall episodes in the Ganges-Bhramaputra basin
(combined drainage area ~1,662,000 km2) cause human suffering almost every year. Webster
& Hoyos (2004)46 showed the possibility of using physically based statistical schemes to
predict rainfall with lead times of more than 10-days in the monsoon region. Based on this and subsequent research the CFAB project, supported by Office of Foreign Disaster Assistance of the United States Agency for International Development (USAID/OFDA), was launched during the monsoon of 2003 and 2004. Long-lead forecasts for rainfall in the river basin were given using the UK-based European Centre for Medium Range Weather
Forecasts (ECMWF), Tropical Rainfall Measuring Mission (TRMM) and other datasets47. The
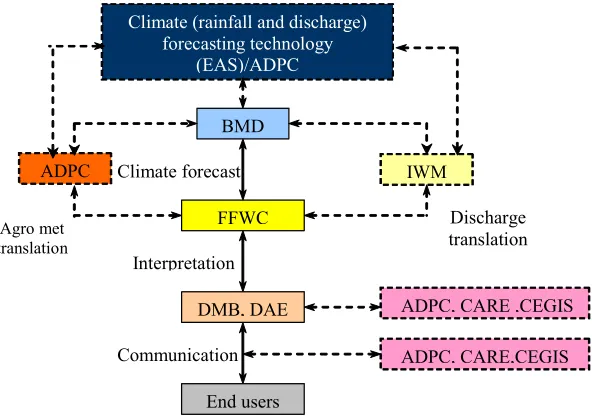
Program was a collaboration (see Fig. 2) of the following agencies: Atmospheric and Oceanic Sciences at the University of Colorado, Boulder, Georgia Institute of Technology, ECMWF, Bangladesh Meteorological Department (BMD), Bangladesh Flood Forecast and Warning Centre (FFWC), and Asian Disaster Preparedness Center (ADPC) in Thailand. Coordinated efforts by ADPC, BMD and the Institute for Water Modeling (IWM) resulted in the development of 1-10 day discharge forecasts at major stations of two rivers (Hardinge Bridge, on the Ganges and Bahadurabad, on the Bhramaputra). The FFWC was responsible to produce local-level forecasts in other locations along these rivers. The Center for
to communities during the monsoon season, working in close coordination with the Disaster Management Bureau (DMB) and the Department of Agricultural Extension (DAE). With the additional lead times and tailored warnings, community level flood risks were better managed. Communities were able to mobilize in advance (e.g. move livestock to higher ground, secure their fishing nets) in order to protect their livelihood assets. The project ran a second phase from 2006 to 2009 with support from USAID Bangladesh through CARE-Bangladesh. The objective was to transfer technology from the USA to Bangladesh and to build the capacity of national and local institutions for a sustainable end-to-end generation and application of flood forecast products in high-risk locations.
Figure 2.Institutional linkages for 1 to 10-day forecast of rainfall in Climate Forecast Application in Bangladesh (CFAB) project. Solid lines denote forecast/product flow and broken lines indicate coordination between the institutions: Asian Disaster Preparedness Centre (ADPC); University of Colorado; Georgia Tech – Earth Atmospheric Sciences (EAS); Bangladesh Meteorological Department (BMD); Flood Forecasting and Warning Centre (FFWC) of Bangladesh Water Development Board (BWDB), Disaster Management Bureau (DMB); Department of Agricultural Extension (DAE); Center for Environmental and Geographic Information Services (CEGIS); and CARE Bangladesh.
The disaster research and emergency management communities have shown that warnings of impending hazards need to be complemented by information on the risks actually posed by the hazards and likely strategies and pathways to mitigate the damage in the particular context in which they arise. Effective “early warning” thus implies information is
introduced into an environment in which much about risk and vulnerability is assumed49.
Vulnerability analysis provides a contextual basis for early warning by identifying structural, water, energy, and food insecurity attributable to disruption of primary means of
access including informal community safety nets50. As is long-recognized by the disaster,
food and water security communities, and more recently the climate adaptation research
BMD
Climate (rainfall and discharge) forecasting technology
(EAS)/ADPC
Agro met translation
FFWC Discharge
translation IWM
DMB, DAE Interpretation
Communication
End users
ADPC, CARE ,CEGIS
ADPC, CARE,CEGIS Climate forecast
communities, successful early warning information systems integrate "input" and "output" indicators. Input indicators include measures of production potential, including rainfall, soil conditions, heat and crop and livestock growth. Output indicators include nutritional indices, behavioral indicators, and signals of economic activity, that deal with the food,
water and other supply situations or changes in demand that result from scarcity51. The
timing and form of climatic information (including forecasts and projections), and access to trusted guidance to help interpret and implement the information and projections in decision-making processes may be more important to individual users than improved reliability and forecast skill.
Experience provided by the U.S. National Integrated Drought Information System (NIDIS) and the United States Agency for International Development (USAID) Famine Early Warning System (FEWSnet) drought early warning information systems developed in the USA has led to the following recommendations for developing EWS:
Develop a Governance structure.
Frame the goals and objectives of international and country and intervention strategy
from a securities perspective (water, food etc), e.g FEWSnet, NIDIS.
Strengthen the scientific and monitoring foundations to support early warning.
Specify of reliable information provided by forecasts, especially for key climate features
i.e. ENSO.
Improve understanding of the modulation and combined impacts of interannual and
decadal-scale variations on agricultural and meteorological drought duration and severity.
Place multiple indicators within a statistically consistent triggering
framework-cross-correlation among units for rapid transitions (e.g. climate and vegetation mapping) before critical thresholds are met from onset to severity.
Develop risk and vulnerability profiles of drought-prone regions and locales including
impact of climate change adaptation interventions on food and water availability, access, and use.
Develop indicators and methodologies to assess the risk to environmental services,
value and costs of environmental degradation, and impacts of water and crop subsidies.
Inventory and map local resource capabilities (infrastructure, personnel, and
government/donor/ngo-supported services) available to complement food and water program operations.
Conduct gaming scenarios with planners and decision makers for selected past and
projected events to:
Improve understanding on whether and how best to use probabilistic information
with scenarios of potential surprise and cumulative risks at each scale.
Map decision-making processes and identify policies and practices that impeded or
enable the flow of information among information system components.
social vulnerability indicators with physical variables across timescales, (2) embracing risk communication as an interactive social process and, (3) supporting governance of a
collaborative framework for early warning across spatial scales46. Forecasts need not be
perfect to make early warning useful. For longer-term EWS, it is also important to note that although a trend in the drought-based indicators may serve as a warning, the actual point of transition or threshold (e.g. dune mobilization) to increased severity remains difficult to predict.
Traditional warnings, with justification, remains an important source of climate information in many rural communities. At the community level, farmers in Zimbabwe and Malawi have identified local language radio programs as credible and accessible mechanisms to deliver forecasts if they occur with follow up meetings with extension agents or other
intermediaries52. Internet based tools, such as Google maps, and graphical tools are already
being used for participatory, large-scale information development. However, these tools are inherently limited in communicating the relevant local context and the consequences (positive and negative of information use). For most locations, the governance context in which EWSs are embedded is also key. The links between the community-based approach
and the national and global EWSs are weak at present53. Improving the complementarity
and legitimacy of both approaches is a new challenge to address especially in developing the institutional foundations for global climate early warning information systems envisioned by the Global Framework on Climate Services (see section 1. Introduction).
There is a critical need to approach and support early warning through DRR and Climate
Change Adaptation (CCA)54,22, and the overarching processes involved in CRM. This
requires a framework that uses climate change scenarios not above but within risk and vulnerability profiles, thereby capturing the nature of capabilities and decision-making networks. These form the basis for effective EWS design and implementation. The cases above, and other efforts, have demonstrated that social protection and early warning information interventions can provide DRR while helping to meet the goals of adaptation to changes in extreme events. Furthermore, sustainable development prospects are very
dependent on the effectiveness of the many networks of EWS’57. In these networks, subtle
rules of interaction emerge that shape the context in which resource-related decisions are
taken, and the rules are negotiated and made55,56.
4. Case studies demonstrating effective CRM practices
CRM is designed to be a practical process to be implemented on the ground. People, policies, environmental issues, governance, information, cultural aspects among other elements should be organised to communicate in an appropriate manner to deal with extreme weather- and climate-related risks. There is no single CRM solution for a particular situation in any part of the world. However, over time, there are increasing success stories demonstrating good practices for a wide range of CRM situations. The following case studies are examples of such good practice in CRM for different locations and development sectors.
4.1. CASE STUDY 1: Using probabilistic seasonal forecasting to improve
farmers’ decision in Kaffrine, Senegal (Ousmane Ndiaye, Robert Zougmoré, Jim
Hansen, Aida Diongue, El Hadji Seck)
Although agriculture and pastoralism occupy 80 per cent of the population in the Sahel, climate information is not yet widely integrated into farm management decision systems. However, many efforts have been made in the region to produce climate information such
as the yearly climate outlook forum preceeding the incoming rainy season57. Yet, this hasn’t
benefitted the user community, particularly the most vulnerable to climate variability and change. This paper documents one ongoing demonstration project in Kaffrine, Senegal, within the peanut growing basin, where rural communities, policy-makers and relevant institutions are testing the use of probabilistic seasonal forecasts for managing climate risk. The process, from training the farming community to evaluating the use of the forecast information, is outlined.
4.1.1. Background
Rainfall in the Sahelian region of West Africa experiences strong variability over time-scales ranging from intra-seasonal (including long dry spells and false onset) to inter-annual and decadal. At the longest time scale, climate change is shifting the desert boundary and altering the landscape. This strong variability has an impact on many sectors, including health, agriculture and water management. The major impacts of climate variability in this region make CRM an imperative for the livelihoods of Sahelian communities. Each time scale of variability requires a specific climate risk plan.
skillful seasonal forecasts at district level, presentation of probabilistic seasonal forecasts using easy-to-understand terminology, training farmers with the new information for them and translate this into decisions. This study concludes with lesson learned during the initial year of the project.
4.1.2. Building trust
The approach used in the project was to help the various stakeholders identify strategies for successful CRM using seasonal forecasting. The project sought to build the trust of farmers, while working with all relevant local organizations. In West African’s culture, trust is the most important requirement in order to be effective in a viable partnership. A common saying states, “the manner to give is better than what is given”. In order to build trust with farmers and foster a sustained relationship, a workshop that included 30 farmers from 6 villages around Kaffrine was planned. Since ANACIM does not have the legal mandate to implement any agricultural strategy, partnership with the local agriculture department representative (SDDR) was ensured. The SDDR has the mandate to monitor activities related to the farming system, and also has arbitration authority in case of conflicts over issues such as farm allocation, fertilizer subsidizing, buying harvest products. SDDR was a natural contact point with farmers, since they had already developed a long time partnership and has their trust. It was very important that the project team not appear as a stranger in the system, but work through a known entity. Association was developed with other local technical services including agricultural advisers from the national agency for agricultural and rural advice (ANCAR), which has a presence nationwide at district level and a mandate to advise farmers in term of agricultural strategies. Volunteers from World Vision, a Christian charity that assists children and invests a lot in agriculture in the district of Kaffrine, also participated. Participants included individual farmers, and members of farmer organizations such as JAPPANDO. Women represented about 30 per cent of those participating.
4.1.3. Training
Consistent with the strong oral tradition, time was reserved during the workshop to allow farmers to interact with the experts team. On the first day of the workshop, the floor was given to farmers to describe their experiences with forecasting the weather and climate. The technical experts started with differentiating the concepts of weather (imminent) and climate (longer term), as these concepts are interchangeable in the local language.
4.1.4. Connecting with farmers’ indigenous knowledge
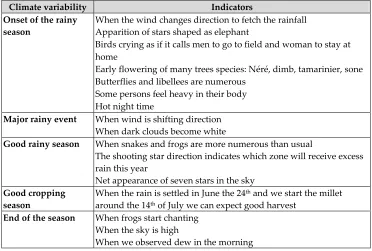
their elders were wrong and only the scientists were right. The strategy was to listen to them and understand the aspects of their traditional knowledge that might be climate related. The farmers were welcomed as guardians of knowledge passed from generation to generation, and invited as experts to share their indigenous climate knowledge. According to their tradition, being elder means possessing wisdom. The farmers were asked to specify whether each indicator was for immediate weather, or for climate conditions for the upcoming season. Some of the indicators were clearly just coincidental events with no apparent link to the climate, but many were very much related to climate and specifically with the high humidity and high temperature associated with the monsoon system (Table 2). After carefully listening, the scientists acknowledged the farmer’s memories and explanations.
Climate variability Indicators
Onset of the rainy season
When the wind changes direction to fetch the rainfall Apparition of stars shaped as elephant
Birds crying as if it calls men to go to field and woman to stay at home
Early flowering of many trees species: Néré, dimb, tamarinier, sone Butterflies and libellees are numerous
Some persons feel heavy in their body Hot night time
Major rainy event When wind is shifting direction
When dark clouds become white
Good rainy season When snakes and frogs are more numerous than usual
The shooting star direction indicates which zone will receive excess rain this year
Net appearance of seven stars in the sky
Good cropping season
When the rain is settled in June the 24th and we start the millet
around the 14th of July we can expect good harvest
End of the season When frogs start chanting
When the sky is high
[image:23.482.55.427.208.459.2]When we observed dew in the morning
Table 2.Quotes from farmers on their perceived climate variability indicators
4.1.5. Explaining the basis of seasonal forecasting
“Then why? Isn’t it the same sun that heats both land and ocean? Why then does the ocean get cooler in summer?” It was explained that ocean has better memory of the past compared to the continent. Ocean remembers the heat of the past days and weeks. That’s why, on a very hot day people go to the beach to benefit from ocean memory of the past weeks. Similarly, when it is cold, the ocean still remembers recent warm days. The ocean’s heat memory is the basis for seasonal forecasting. As rain comes from clouds, clouds come from water vapor, and most water vapor from the ocean, they could see how ocean temperature could control rain. The farmers were also informed that satellites are used to monitor ocean temperature throughout the world, and computers quantify the likelihood of rain in Senegal. This very simplistic explanation helped them to make sense of scientific seasonal forecasts, and was sufficient to convince them to trust the forecast during this first contact.
4.1.6. Getting past the technical language barrier
[image:24.482.129.353.428.580.2]The next challenge was to explain the probabilistic nature of the forecast, which is less intuitive than a deterministic rainfall amount. To start with, the farmers were asked to recollect from their memory the last 5 rainy seasons and rank them from the wettest to the driest. With a pluviograph (Fig. 3), it was explained how rainfall is recorded in millimeters, and what 1mm of rain means. One mm of rain was poured into the soil, then the farmers were asked to compare it with the quantity of rain that they consider sufficient to plant their crops. They indicated that they plant when the soil wetting front is greater than the span of an average man’s hand. To help them interpret what a seasonal total means, a discussion was held on how the temporal distribution of rain relates to the seasonal total. It was clear for the farmers that a seasonal forecast gives an idea of the total, but no information about its distribution in time. One farmer explained the difference between a good rainy season and a good cropping season, which was a clear indication that they understood the seasonal forecast output. The farmers were informed also what could potentially be forecast and what could not.
4.1.7. Probability of exceedance graphs
It was decided to express the forecast as a probability of exceedence of rain instead of the probability of occurrence of the three tercile categories that meteorological services in West Africa officially issue in their seasonal forecasts. Farmers understand the notions of uncertainty and probability, but understanding and acting on formal probability formats is challenging. To help them understand the new probability of exceedance format, an exercise of classifying the last 5 years of rainfall that they recollected from memory was conducted (Fig. 4). A chart of 30 years of Kaffrine rainfall data was provided. The farmers could see that it is very likely that they would get at least as much rainfall as the driest year, and very unlikely that they would get more than the wettest year. The middle years represent
“normal” conditions. How to identify the 25th, 50th and 75th percentiles of rainfall from the
[image:25.482.127.358.323.475.2]graph was discussed. The idea that a dry forecast would shift the distribution toward the left and wet forecast to the right was introduced. Hypothetical wet and dry forecasts were discussed until the farmers appeared to understand what they meant. As the probability of exceedence is a cornerstone of the training, the farmers were divided into four groups. Two groups were given probability of exceedence forecasts for hypothetical dry years and the other two groups were given hypothetical wet years. The farmers were asked to discuss what they would do differently if this were the actual forecast for the upcoming season. Each group reported back on their forecast and strategies. The whole group was encouraged to comment on these strategies.
Figure 4.Farmers sorting seasonal rainfall.
4.1.8. Communicating the forecast
the participating farmers listen to the radio, but the listening quality of the radio is very poor when they are on the farm. Some NGOs and farmers association leaders recommended e-mail as a possibility. The administrative authority who was present mentioned the government’s network of heads of village. In case of an extreme event, this can be used to reach each village within an hour. The local authority showed his support and promised to help with access to this facility. To avoid conflicts between farmers’ organizations, other farmers recommended sending the information through the SDDR, who knows how to contact them.
4.1.9. From theory to practice
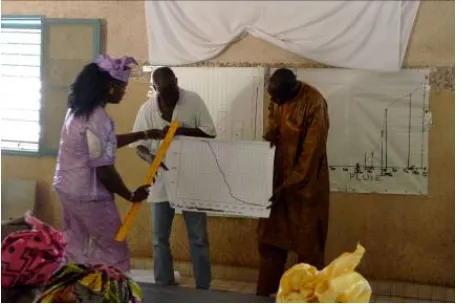
[image:26.482.140.340.373.509.2]A week after the training work, ANACIM sent a group of experts to call a meeting to communicate the actual July-September 2011 seasonal forecast with the farmers. Twenty-two attended. Some key points from the training were revisited: good rainy season versus good cropping season, probability of exceedence interpretation, plausible management response strategies, definition of 1mm. Rain gauges were distributed to some representatives of farmers’ organizations who expressed need for this tool, and the meaning of a millimeter of rain was again demonstrated. The forecast was presented with an explanation on how to interpret it (Fig. 5). The forecast in this case was “normal to above-normal.” As the year before, 2010, had been exceptionally wet – the highest on record – it was indicated that rainfall this year (2011) would probably be less than 2010. Some explanations about what the seasonal forecast did not say were also offered. Recommendations on any particular management strategies were not made, but rather it was left open to each farmer to decide. Considering that this was a first contact with them, it was preferred to build trust first before offering recommendations.
Figure 5.Training on interpreting the probability of exceedance.
4.1.10. Keeping in touch
the word, how the rain was, etc. It was not a forecast but rather a monitoring exercise. It was good to touch base. During the first field trip in selected villages (October 12-13 2011), some farmers made major decisions, such as borrowing money from the bank to invest more in their farm, or hiring workers. Another field visit was made around the end of the cropping season (October 18-22, 2011) to conduct surveys on expected yield.
4.1.11. Evaluation of the seasonal forecast
In January, three months after the rainy season, when farmers have sold their crops and finished their farming work, an evaluation workshop was organized in Kaffrine to assess the use and usefulness of the seasonal forecast strategy. Local extension services were present, as well as farmers’ organizations. Fifteen of the farmers who attended the training workshop in June were invited back, along with 13 other farmers who hadn’t received information about seasonal forecasting. During the January workshop, participants assessed both 2011 seasonal rainfall and the performance of various crops grown in the district. The participants took the opportunity to discuss in three groups, and interpret the information presented. One group included 12 farmers that had received the forecast and adjusted some decisions in response to the forecast (group I). The next groups included 3 participants who did receive the forecast but didn’t make any adjustment to their farming practices (group II), and the last group consisted of 13 farmers who had never received any climate forecast information (group III). They were asked to document actions taken, problems encountered, and recommendations. Group I understood from the workshop that a short cycle crop was suitable because the season was to be less than 2010, but rainfall would be enough. The main problems they listed were: the high spatial variability of the rainfall, the late occurrence of the first rainfall which made it difficult to judge when to start planting, a long dry spell, and early termination of the season. They wanted to know or get: the starting date, finer forecast information in space, a weather bulletin each two weeks, and more training to better understand the forecast. Group II did not use the seasonal forecast because they had already bought their seeds at that time which made it difficult to change any of their farming strategy. Group III, who had never received any climate information, indicated that they had thought 2011 would be like 2010. They missed the opportunity of a long season in 2010, and were prepared to catch up the next year by choosing a long cycle variety, buying fertilizers and hiring wage laborers. The group members concluded that their problem was that they didn’t know anything about the course of the rainy season and needed to be part of the group that received seasonal forecast training.
4.1.12. Lesson learned and way forward
would be the best way. Overall, the farmers appreciated the experience of last year and welcomed more training.
Seasonal climate forecasts could have considerable potential to improve agricultural management and livelihoods for smallholder farmers. But constraints related to legitimacy, salience, access, understanding, capacity to respond and data scarcity have so far limited the widespread use and benefit from seasonal predictions in the Sahel region. The existing constraints reflect inadequate information services, policies or institutional processes in the region. However there is great potential to overcome these constraints. An approach is suggested that packages: i) seasonal and onset forecasts, ii) opportunity for farmers to implement strategies, and iii) insurance tools in case of extreme variable or dry years. Even when the seasonal rainfall or onset matches the forecast, poor farmers wouldn’t profit if they don’t have access to funds or crop varieties to implement any forecast-based strategy. And it turns out that in Kaffrine, there is often false start of the rainy season, making it imperative to provide farmers with alternatives, for example through index insurance.
As work with farmers in Kaffrine on the forecast continues, research is being conducted and a working group on improving prediction of intra-seasonal variability has been set up. Crop producers and seed bank will be invited into the process, to allow farmers to access suitable varieties for forecast-based strategies. There is some work on index insurance in the region, and it is planned to reach out to involve such groups in this effort. Through this approach it is hoped to gain success, avoid frustration and build long-term partnerships.
4.2. CASE STUDY 2: Climate risk management of plantation crops in the humid
tropic region of Kerala, India (G.S.L.H.V. Prasada Rao)
The global economy has adversely been affected to a considerable extent due to weather related disasters which are not uncommon in the recent past. It is true in the case of the Indian economy too. The year 2010 was the warmest year ever recorded, followed by 2009 in India.
Climate model simulations indicate that a marked increase in rainfall and temperature over India could be seen during the current century. The maximum expected increase in rainfall is likely to be 10-30 percent over central India, with temperatures projected to increase
between 2 and 3oC by the end of the 21st century.
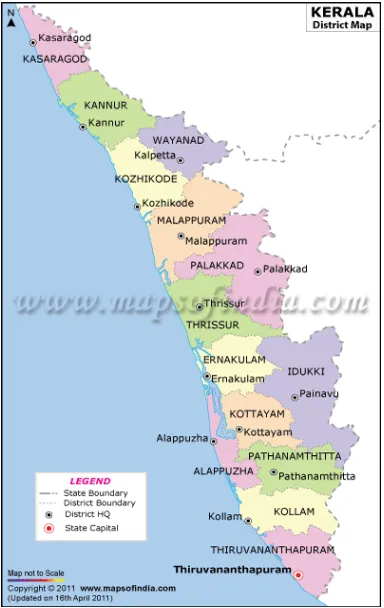
8°15`N and 12°50`N and longitudes 74°50`E and 77°30`E). The location map of Kerala is given in Fig. 6.
Figure 6.Location map of Kerala. Source: www.mapsofindia.com
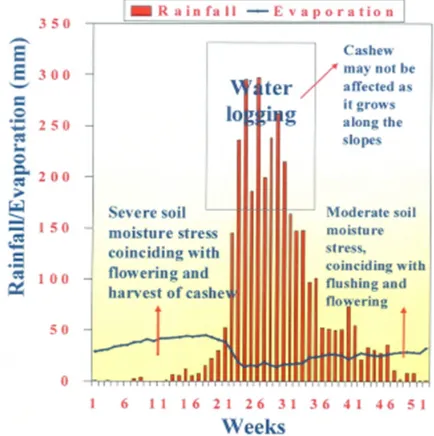
4.2.1. Rainfall and thermal regimes of Kerala
The annual rainfall across Kerala is highly variable, averaging about 3000mm, but varying between less than 1000mm to greater than 5500mm.
Seasonally, rainfall is bimodal, due to the influence of both the summer and winter monsoons, with maximum monthly rainfall (>600mm) during the summer monsoon in June and July, and winter monsoon rainfall (200-300 mm) during October. Heavy rainfall during the summer monsoon, followed by a prolonged dry spell is a characteristic feature of the humid tropics, which is particularly prominent in the case of the northern districts, including Kasaragod, where the influence of winter monsoon is negligible (Fig. 7).
below mean