Self-Organizing Adaptation for Facial Emotion Mapping
Siu-Yeung Cho
Division of Computing Systems, School of Computer Engineering Nanyang Technological University, Nanyang
Avenue, Singapore 639798 E-mail: [email protected]
Yok-Yen Nguwi
Division of Computing Systems, School of Computer Engineering Nanyang Technological University, Nanyang
Avenue, Singapore 639798 E-mail: [email protected]
Abstract - This paper presents an emotion mapping system that attempts to emulate human brain reference model. The system first locates the human face in an image, and then identifies the localized face emotion. The understanding of cognitive system is presented in the paper. It highlights how individual module is mapped to the proposed system. Then, single- and multi-layer self-organizing emotion maps are described. The system is evaluated through various test sets. The experimental results show encouraging hit rates for identifying emotions of unknown subjects.
Keywords: self organizing map, face emotion recognition, Gabor feature extraction.
1 Introduction
Recognizing face emotions plays a crucial role in human computer interaction. Emotion recognition remains to be a challenging task. Cognitive neuroscience is a field that catches great attention from researchers. It is a study that tries to perceive the philosophy of our brain’s every mental states and functions. Our visual perception, our action, our speech of language, and our memory are all directed by thousands of nerve and brain cells that interconnect together to achieve every single task. It is marvelous how our flawless brain can do wonder.
The first known facial expression analysis was presented by Darwin in 1872 [1]. He presented the universality of human face expressions and the continuity in man and animals. He pointed out that there are specific inborn emotions, which originated in serviceable associated habits. After about a century, Ekman and Friesen [2] identified six primary expressions and systematically recorded thousands of facial expressions. Suwa et. al. [3] conducted an investigation on automatic facial expression analysis from image sequence. Facial movements are tracked by specifying twenty spots in the face and hence determine the corresponding expressions.
Neural network is a popular choice for emotion classification. Most of them fall under supervised learning.
The essence of this work is to resolve the emotion mapping problem in an unsupervised manner. The other classification methods underscored by Pantic and Rothkrantz [4] are Expert System Rules, Discriminant functions by Cohn [5], Spatio-temporal motion energy templates by Essa [6], Thresholding motion parameters by Black [7], and Brain-Inspired framework by Wong and Cho [8].
This work attempts to emulate human brain reference model. The major contribution goes to the classification part whereby single layer and multi layer emotion maps are established to adapt different facial emotions. Gabor wavelets are used to extract features for the adaptation of the Self-Organizing Maps. There is evidence that the cortical cells of receptive layer can be modeled by Gabor wavelets. Facial images are taken from the Cohn-Kanade Database from University of Pittsburg. Single-layer and multi-layer Self-Organizing Maps are trained to classify 6 categories of emotion – joy, surprise, sad, anger, fear, and disgust. Self-Organizing Maps are used because of their biological similarity with human brain. Human brain contains several brain maps that pertain to different functions.
The paper is organized as follows. An overview of the system is proposed in Section 2. Section 3 presents the experimental results. Finally, concluding remarks are given in Section 4.
2 Self-Organizing Maps for Emotion
Recognition
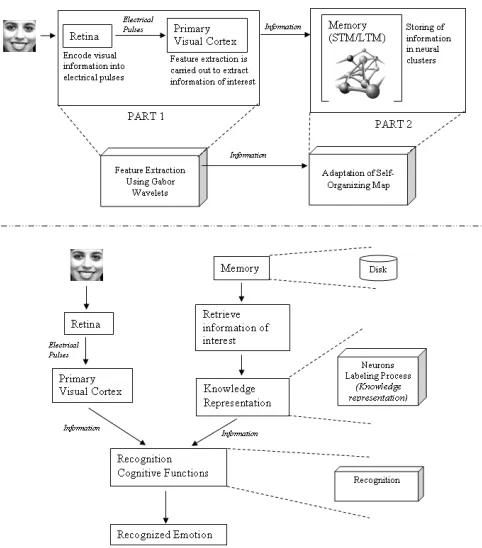
We designed and implemented a computer based cognitive system to recognize emotions portrayed by human face. This work attempts to emulate or model the cognitive processes of the human brain that are employed during emotion recognition. The network recognizes six categories of emotion namely joy, surprise, anger, disgust, sadness and fear. The system investigated gray-scaled images.
comprises of 2 parts, feature extraction part and SOM adaptation part. Part 1 models the cognitive processes of feature extraction. It extracts essential information using Gabor wavelets and passes the information to the next level. Part 2 models the storing of information through the use of biologically similar map achieved through competitive learning.
[image:2.612.57.298.288.562.2]Four procedures are involved in the whole process. Image features are first extracted using Gabor Wavelets. Secondly, the feature vector undergoes Self-Organizing adaptation. The third process involve knowledge representation, different emotion category is labeled according to the input marked neurons. The last step is the recognition of image through K-Nearest Neighbour (KNN), Smart-KNN, Weighted KNN, and Smart weighted KNN. They will be introduced in the following sub-sections:
Figure 1: Mapping of system design and cognitive processes
2.1 Feature
Extraction
Meaningful information is hidden underneath the image. Proper selection of features optimizes the performance of classification. Feature extraction forms the basic building block of recognition problem.
Gabor wavelet is a popular choice because of its capability to approximate mammals’ visual cortex. The primary cortex of human brain interprets visual signals. It
consists of neurons, which respond differently to different stimuli attributes. The receptive field of cortical cell consists of a central ON region surrounded by 2 OFF regions, each region elongated along a preferred orientation [9]. According to Jones and Palmer, these receptive fields can be reproduced fairly well using Daugman’s Gabor function [10]. There is considerable evidence that the parameterized family of 2-D Gabor filters, proposed by Daugman in 1980, suitably models the profile of receptive cells in the primary visual cortex. Gabor filters models the properties of spatial localization, orientation selectivity, and spatial frequency selectivity and phase relationship of the receptive cells [11].
The Gabor wavelet function can be represented by:
(1)
where
(2)
We consider that the receptive field (RF) of each cortical cell consists of a central ON region (a region excited by light) surrounded by two lateral OFF regions (excited by darkness) [12]. Spatial frequency (W) determines the width of the ON and OFF regions. σ2 and
σ are spatial variances which establish the dimension of the RF in the preferred and non-preferred orientations.
x y2
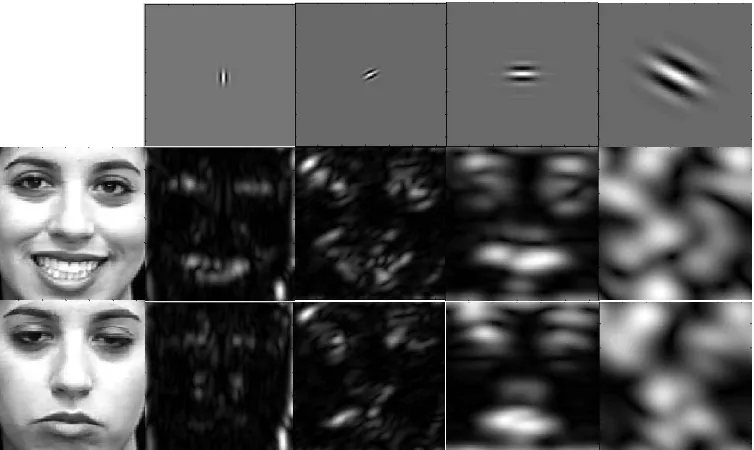
An image is convoluted with all these filters so as to extract the facial features. We have chosen 6 orientations and 4 spatial frequencies; generating a total of 24 Gabor filtered images. The lower bound frequency is chosen as 0.05 while the upper bound frequency is chosen to be 0.4. Orientations are in multiples of π/6 from 0 to π. Figure 2 shows the responses of two different facial images for four of the selected Gabor filters. All the convoluted images model the data received by the primary visual cortex (area V1). The mean Gabor image is then generated and form the major feature vector for the next stage to process.
2.2 Self-Organizing Map Adaptation
Human brain can be thought of as a consolidation of many brain maps. These brains consist of interconnected neurons. There are topological in nature, and certain area of the map will respond to certain stimuli. Thus, an emotion map may exist in the human brain. This map consists of many neurons that may or may not react to different stimuli of emotions – happiness, surprise, sadness, and etc. Both single-layer and multi-layer Self-Organizing Maps are discussed in the followings:
1
( , )
( , ) exp( 2
)
g x y
=
g x y
j
π
Wx
+
−
=
22 221
2
1
exp
2
1
)
,
(
y x y
x
y
x
y
x
g
σ
σ
σ
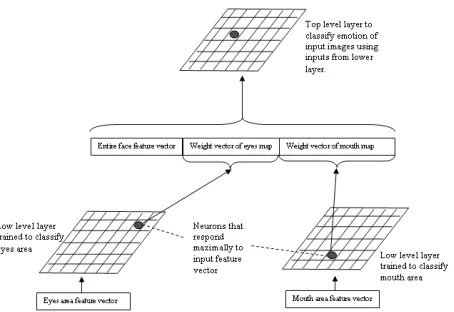
We employed 3 maps that are interconnected to classify emotions, one map on top and two at the lower level as shown in Figure 3. The first map in the lower level contains eye feature. The other map of the lower level consists of mouth feature.
The top map consolidates the eye, mouth and entire face features. The input vector presented to the top level
map has to be encoded.
2.3 Single-Layer Self-Organizing Map
2.4 Multi-Layer Self-Organizing Map
We used an emotion map that consists of 400 neurons, which are stimulated by feature vectors. Each neuron has a weight vector associated with it. Learning parameters are varied and weights get updated in the competitive learning process. The adaptation steps involved are listed as follows:
1. Initialize starting neighborhood size. For example, n=10. Neighboring neurons within 10 neuron distances from the winning neuron will be updated.
2. Generate learning parameter vector according to neighborhood size. Learning parameter varies with the distance from winning neuron as well as neighborhood size. For example, when n decreases to 2, the learning parameter vector is [0.4 0.3 0.2].
3. Run Training Module with specified neighborhood size for required number of cycles.
4. Decrease neighborhood size by 1.
5. Repeat steps 1 to 4 until neighborhood size equals 0.
{
P e e eQ m m mR}
top
f
f
f
w
w
w
w
w
w
x
=
1,
2,...,
,
1,
2,...,
,
1,
2,...,
represents an input vector to top level map.
{
f
1,
f
2,...,
f
P}
represents the mean Gabor image featurevector of the entire face of length P (i.e. the size of an image).
{
w
e1,
w
e2,...,
w
eQ}
and{
w
m1,
w
m2,...,
w
mR}
represents the weights of winning neurons,w
r
eyes andmouth
w
v
, of eyes area map and mouth area map respectively. Q and R denoted the length of the weight vectors of the eyes and mouth area maps respectively. The length of the weight vectors is defined by the size of the image regions. Winning neurons of the low level maps are determined by finding the weight having the shortest Euclidean distance from the input. Euclidean distance between two vectors A and B of length L is given by:)
(
) (
)
2(
22 2 2 1
1
...
L LAB
A
B
A
B
A
B
[image:3.612.114.491.62.287.2]D
=
−
+
−
+
+
−
Figure 2: Examples of Gabor Wavelets and corresponding convoluted images
Winning neuron is such that
D
ij=
min
{
D
1j,
D
2j,...,
D
Nj}
ance between neuron i and i nning neuron of both ey ermined this way, thereby obtai
ght vectors,
w
r
eyes andw
v
mouth, where is the
dist nput feat or j.
Wi es and mouth area are
det ning wi ng neuron’s
wei of lengt and R
respectively.
The updated weight vector of the winning neurons of both maps is then concatenated with the feature vector of the entire. The entire face feature vector, weight vector of eyes and mouth maps together form the top layer input feature vector, . This top layer feature vector is presented to the top level self-organizing map for classification.
2.5 Knowledge Representation / Emotion
Labeling
After the map has been adapted to classify a number of subjects’ emotion, we need to ‘color’ the map so as to visualize which neuron is adapted to respond to which category of emotion. Physiologically, knowledge representation is a meta cognitive function that knowledge representation is an important step because recognition requires the represented knowledge to carry out recognition of emotions. Here we use color to represent the emotion that a neuron would respond to. The emotion category for which a neuron would respond to is found out in the following manner:
1. Euclidean distances between weight vectors and training input images are obtained.
2. Mark the winning neuron corresponding to each input image with the emotion belonging to it using the appropriate color. These neurons shall be called Input-Marked Neurons for differentiation purposes.
3. For the rest of the unmarked neurons, determine which Input-Marked Neuron is the unmarked neuron closer to using Euclidean distance of their weights.
4. Label the unmarked neuron with the same color of the most similar Input-Marked Neuron.
2.6 Recognition
Recognition is a higher cognitive process belonging to Layer 6 of the Brain Reference Model. In this work, we introduce four methods to recognize emotions – K Nearest Neighbor (KNN), Smart-KNN (SKNN), Weighted-KNN (WKNN) and Smart-weighted-KNN (SWKNN). KNN is a
method used by many to evaluate the quality of clusters. SKNN and WKNN are extensions of KNN. SWKNN is a hybrid of SKNN and WKNN.
The following steps describe the recognition in multi-layer SOMs.
ij
D
ure vectnni h Q
[image:4.612.318.545.160.316.2]top
x
Figure 3: Structure of multilayer self organizing map
1. Feature vectors (3 vectors) of testing image are extracted using Gabor wavelets.
2. Determine weight vectors of neurons,
w
r
eyes andmouth
w
v
, that responded maximally to ive ure vectors, andrespect
mouth
input feat
f
v
eyesf
v
, from eyes and mouth maps.3. Form up the top level feature vector using the entire face input, weight vector of eyes area map and weight vector of mouth area map.
{
P e e eQ m m mR}
top f f f w w w w w w
x = 1, 2,..., , 1, 2,..., , 1, 2,...,
where
w
r
eyes={
w
e1,
w
e2,...,
w
eQ}
andmouth
w
v
={
w
m1,
w
m2,...,
w
mR}
.4. Present top level feature vector, , to top level self-organizing map.
3 Results and Discussion
In this section, we will assess the ability of the adapted Self-Organizing Map to understand emotions of human face. The network generalizes 2 to 8 subjects. By observing the map, we can investigate the ability of individual maps. The training and testing images are taken from the Cohn-Kanade AU-coded Facial Expression Database [8]. This database consists of images of
approximately 100 subjects. Facial images are of size 640x490 pixels, 8-bit precision grayscale in png format.
3.1 Single-Layer Self-Organizing Map
In this section, we will assess the ability of the adapted single-layer Self-Organizing Map to understand emotions of facial images. The network generalizes two to eight. By observation of the map, we can investigate the ability of single-layer Self-Organizing Maps to classify similar emotions of various subjects into one cluster.
The capability of the system is being investigated with the test images of unknown subject. The emotion recognition rate of unknown subject for joy is shown in Table 1. The tabulated results are obtained using 1-NN recognition method (K=1 for KNN). Figure 4 plots the overall recognition rates of single-layer Self-Organizing Maps versus the number of training subjects. We can observe from the chart that whichever methods of recognition we used (KNN, SKNN…), the higher the number of subjects, the better the recognition rates. However, for 8 training subjects, the recognition rate drops. This may be due to the fact that the number of neurons may not be enough to generalize 8 subjects. The highest recognition rate was 74.02%, using 6 training subjects and Biased-SWKNN as recognition method.
Overall Recognition Rates of Single Layer SOM
55.00 60.00 65.00 70.00 75.00
2 3 4 5 6 7 8 9
Number of subjects
Ra
te
(%
)
1-NN KNN SKNN
[image:5.612.313.559.115.299.2]WKNN SWKNN Biased-SWKNN
Figure 4: Overall recognition rates of single-layer SOM
3.2 Multi Layer Self-Organizing Map
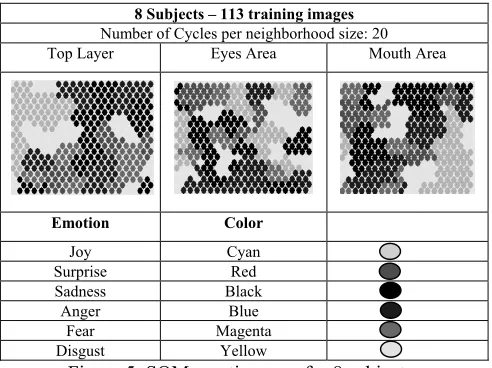
In this section, we will assess the ability of the adapted multi-layer Self-Organizing Map to understand emotions of facial images. We also investigate whether a multi-layer Self-Organizing Map performs better than the single-layer Self-Organizing Map in terms of emotion recognition. Table 2 shows the result of recognizing joy face. Highest recognition rates for 8 subjects were obtained using WKNN recognition strategy and not Biased-SWKNN, which is the strategy preferred for single-layer Self-Organizing Maps. However, Biased-SWKNN still
performs better than SWKNN. Figure 5 shows the emotion visualization after adaptation. Emotions are coloured differently. Better definition of clusters is achieved by increasing the number of cycles.
8 Subjects – 113 training images
Number of Cycles per neighborhood size: 20 Top Layer Eyes Area Mouth Area
Emotion Color
Joy
6 16 19
Cyan Surprise Red
Sadness Black Anger Blue
Fear Magenta Disgust Yellow
Figure 5: SOM emotion map for 8 subjects
Table1 : Recognition results using single-layer Self-Organizing Maps for Joy emotion
Emotion: JOY (cyan) Number of testing images: 20 Number of
Subjects Generalized
by SOM
Number of Training Images of
Specific Emotion
Correct Wrong Recognition Rate
2 6 20 0 100%
3 8 20 0 100%
4 12 19 1 95%
5 16 19 1 95%
1 95%
8 22 19 1 95%
Table 2: Recognition results using multi-layer Self-Organizing Maps for Joy emotion
Emotion: JOY (cyan) Number of testing images: 20 Number of
Subjects Generalized
by SOM
Number of Training Images of
Specific Emotion
Correct Wrong Recognition Rate
[image:5.612.60.304.398.540.2]4 Conclusion
An emotion recognition system was presented in this paper. The system recognizes unknown subjects’ facial emotion. Human brain’s cognitive architecture was briefly studied. Next, the development stages of the proposed system were presented. These concern both the Gabor feature extraction as well as Self-Organizing emotion adaptation. Finally, the performance of the developed emotion recognition system was evaluated. Self-Organizing Maps demonstrated the highest overall recognition rate of 74.02% when used to understand or recognize emotions of unknown subjects. The best result was shown to be using 6 training subjects for a network size of 400 neurons. Biased-SWKNN is the recommended recognition strategy.
5 References
[1] C. Darwin, “The Expression of the Emotions in Man and Animals”, J.Murray, London, 1872.
[2] Paul Ekman, W.V. Friesen, The Facial Action Coding System: A technique for the measurement of facial movement. San Francisco: Consulting Psychologists Press, 1978.
[3] M. Suwa, N. Sugie, K. Fujimora, A preliminary note on pattern recognition ofhuman emotional expression, Proceedings of the Fourth International Joint Conference on Pattern Recognition, Kyoto, Japan, 1978, pp. 408–410.
[4] Pantic, M. and L.J.M. Rothkrantz, Automatic analysis of facial expressions: the state of the art. Pattern Analysis and Machine Intelligence, IEEE Transactions on, 2000.
22(12): p. 1424-1445.
[5] Cohn, J.F., et al. Feature-Point Tracking by Optical Flow Discriminates Subtle Differences in Facial Expression. in International Conference on Face & Gesture Recognition. 1998: IEEE Computer Society.
[6] Essa, I.A. and A.P. Pentland, Coding, analysis, interpretation, and recognition of facial expressions.
Pattern Analysis and Machine Intelligence, IEEE Transactions on, 1997. 19(7): p. 757-763.
[7] Black, M.J. and Y. Yacoob, Recognizing Facial Expressions in Image Sequences Using Local Parameterized Models of Image Motion. International Journal of Computer Vision, 1997. 25(1): p. 23-48.
[8] Wong, J.-J. and S.-Y. Cho. A Brain-Inspired Framework for Emotion Recognition, Neural Information Processing—Letters and Reviews, Vol. 10, No. 7, pp. 169-79, July 2006.
[9] G.E. La Cara, M. Ursino, “A Neural Network Model of Contours Extraction Based on Orientation Selectivity in
the Primary Visual Cortex: Applications on Real Images”,
Proc. 26th Annual Intl. Conf. of the IEEE EMBS, , pp. 4029-4032, 2004.
[10] J.P. Jones, L.A. Palmer, “An evaluation of the Two-Dimensional Gabor Filter model of simple Receptive fields in cat striate cortex”, J.Neurophysiol., vol. 58 (6), pp. 1233-1258, 1987.
[11] J. Daugman, “Uncertainty relation for resolution in space, spatial frequency, and orientation optimized by two-dimensional visual cortical filters,” J. Opt. Soc. Amer.,vol. 2, no. 7, pp. 1160-1 169, 1985.
[12] G.E. La Cara, M. Ursino, M. Bettini “Extraction of Salient Contours in Primary Visual Cortex: A Neural Network Model Based on Physiological Knowledge”,