Parental Opinion Survey 2009
Research Report DCSF-RR194
Mark Peters, Ken Seeds, Gareth Edwards and
Erica Garnett
Research Report No
DCSF-RR194
Parental Opinion Survey 2009
Mark Peters, Ken Seeds, Gareth Edwards and Erica Garnett
TNS-BMRB
The views expressed in this report are the authors’ and do not necessarily reflect those of the Department for Children, Schools and Families.
Table of Contents
Executive Summary ... 1
Introduction... 5
Policy Background ...5
Aims and Objectives ...6
Summary of survey method ...8
Recreating the parent segments...11
General notes of caution...13
Structure of the report...13
Reporting conventions ...14
1 Confidence in Parenting Skills... 15
Key Findings ...15
1.1 Introduction ...16
1.2 Confidence of parent when caring for child...16
1.3 Parental reward...17
1.4 Parental frustration...18
1.5 Frequency of Arguing...20
1.6 Relationship with child ...21
1.7 Behaviour problems affecting mental health of parents ...22
1.8 Family rows and tensions ...22
1.9 Managing behaviour - Special Educational Needs ...22
1.10 Managing behaviour - lone parents ...23
1.11 Creating a Confidence Index ...24
1.12 Segmentation - Key Findings ...30
2 Perceived Ability of Parents to Support Child’s Learning ... 34
Key Findings ...34
2.1 Introduction ...34
2.2 Do parents feel able to support their child’s learning at school?...35
2.3 Do parents feel able to support their child’s learning at home? ...37
2.4 Are schools doing enough to engage parents? ...43
2.5 Segmentation - Key Findings ...45
3 Access to Parental Information and Advice Services ... 47
Key Findings ...47
3.1 Introduction ...48
3.2 Use of formal services for parents ...51
3.3 Use of informal services of support and advice ...53
3.4 How parents received information, advice or support ...54
3.5 How parents would liked to have received information advice or support.55 3.6 Barriers to accessing information, advice or support ...56
3.7 Support for fathers ...57
3.8 Segmentation - key findings...58
4 Confidence in parental support services ... 60
Key Findings ...60
4.1 Introduction ...60
4.2 Whether support services meet parents’ needs...61
4.3 Parental feedback on support services...62
4.4 Whether parents confident would know where to access information ...63
4.5 Parental engagement with child’s educational establishment...64
Conclusions and Implications for Policy ... 68
Appendix A - Parental Opinion Survey comparisons with Parental Involvement in Children’s Education (PICE)... 72
Appendix B - Parental Opinion Survey comparisons with National Survey of Parents and Children (NSPC)...74
Appendix C - Sample design...78
Appendix D - Introductory letters...81
Appendix E - Questionnaire ...83
Appendix F - The recreation of the Segmentation of Parents and Carers ...119
Appendix G - Segmentation Key Findings and Pen Portraits...128
Appendix H - Parental Frustration - Regression Analysis ...140
Glossary
Abbreviations
DCSF Department for Children, Schools and Families
PICE Parental Involvement in Children’s Education [Survey]
NSPC National Survey of Parents and Children
SEN Special Educational Needs
Explanations
Non-resident parents Parents whose child / children live at a different address
Reference child The child that was randomly selected at the start of the survey and was referred to in questions throughout the survey interview.
NSPC In 2007 BMRB was commissioned by the Department for Children, Schools and Families to conduct this
segmentation study of parents and children in England. The study was seen as an important contribution towards understanding how the DCSF can help parents and children to engage more with the education system. The study was conducted using a random probability methodology, and face to face interviews were conducted with 2,572 parents and carers of children aged 0-19. In each household where a 10-19 year old was present, one was selected for interview and a total of 1,154 interviews with young people were achieved.
PICE In 2007 the DCSF commissioned BMRB to undertake research to assess the extent to which parents are involved in their children’s education. The research also explored the level of awareness parents have of
government initiatives in this field. Just over 5,000 20 minute CATI interviews were conducted with a random sample of parents who had children aged 5-16 attending state schools in England.
Executive Summary
Introduction
1. This project was set up in order to provide Ministers with information about the opinions of parents on a range of issues, focusing on their role as parents, their confidence as
parents and their views about the services that they or their children use. The questionnaire and this report were structured around a series of parental confidence themes that were created by the DCSF to provide guidance for this survey.
2. The survey was conducted between February and May 2009 and covered a
representative sample of 2,384 parents with resident or non-resident children aged 0-19 in England.
Confidence in Parenting Skills (Chapter 1)
3. The vast majority (94 per cent) of parents were confident when caring for their children. Confidence was highest for parents of older children and amongst parents who left the education system at a later age (aged 22 or over). In contrast, levels of confidence were lowest amongst parents who did not speak English as a first language (81 per cent). Although still relatively high, this is significantly lower than for other groups.
4. Nearly all parents (99 per cent) found parenting rewarding, with 83 per cent saying that they found it rewarding ‘most of the time’. Non-resident parents expressed the lowest levels of satisfaction (73 per cent), whilst parents of children under three years old found parenting most rewarding (88 per cent).
5. Over two thirds of parents found parenting frustrating most or some of the time. Parents of children with SEN were less likely than average to find parenting rewarding and were more likely to find it frustrating most or some of the time (74 per cent said this was the case). Further analysis of frustration levels shows that demographic and attitudinal factors are key drivers of frustration. More specifically, frustration is increased for parents with three or more children, lower education background and working status (two full-time working parents). Attitudinal factors which have the largest impact include perceived lack of time, perceived behaviour issues; and lack of parental confidence.
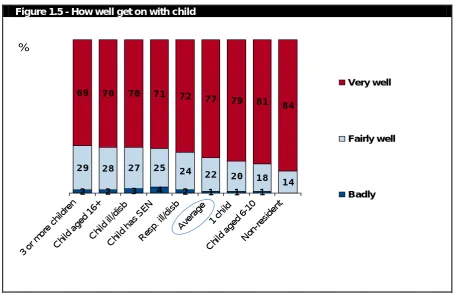
6. Over a third (36 per cent) of parents argued with their child either most days or more than once a week. The proportion doing so increased amongst parents of children aged 6-10 (47 per cent) and non-working parents (38 per cent). However, parents of children aged 6-10 were most likely to say they got on very well with their child (81 per cent) and there was a gradual decline for parents of older children.
7. Parents of children with SEN were more likely than average to cite difficulties in managing their children’s behaviour and experience negative outcomes as a result. More
specifically, they were more likely to argue with their children at increased frequency; get on less well with their children; have problems with their child’s obedience; struggle to control their child’s behaviour; experience behaviour problems which have affected their mental health; experience tension with their partners; and experience major family rows.
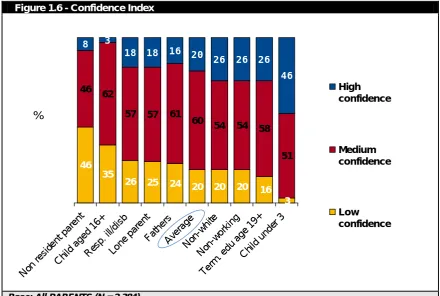
9. A Confidence Index (see section 1.11) was produced for this survey providing a measure of parental confidence. Age of child was the key driver of high confidence and parents of children aged under three were most likely to appear in the ‘higher’ confidence group (46 per cent)1, while only three per cent of parents of young people aged 16 or above were highly confident. Other factors were also important. Parents who left the education system aged 19 or above were more likely to fall into the ‘higher’ confidence group (26 per cent). Non white respondents and those not working were also more likely to have ‘higher’ confidence (both 26 per cent). In contrast, non-resident parents were most likely to appear in the ‘lower’ confidence group (46 per cent).
10. High levels of confidence had positive impacts on other aspects of parenting, such as enjoyment of parenting, parental involvement and behaviour management.
Perceived Ability of Parents to Support Child’s Learning (Chapter 2)
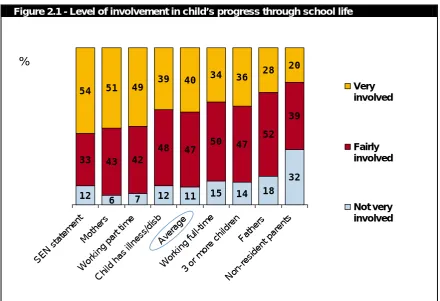
11. Levels of parental involvement in children’s learning were lowest amongst non-resident parents (42 per cent said they were not involved). Although more involved than non-resident parents, involvement was lower than average for fathers (20 per cent not
involved), parents under 25 (18 per cent not involved), parents with three or more children (16 per cent not involved) and parents working full time (16 per cent not involved).
Involvement was highest amongst mothers, part time workers and parents of children with an illness or disability. Further analysis shows that parents of children with a statement of SEN were most likely to feel very involved (54 per cent).
12. When asked who was most involved in their child’s school life - them or their partner, very few fathers said they were most involved. Mothers were five times more likely to say they were most involved. A third of parents said that they and their partner were equally involved in their child’s schooling.
13. Most parents (91 per cent) felt confident in their ability to support their child’s learning and development. Confidence increased to 96 per cent amongst those with more experience of the education system (terminal education age of 19 or older). Similarly, confidence was higher than average (94 per cent) amongst parents of younger children (10 or under). Confidence was lowest amongst parents who did not speak English as their first
language, non-resident parents and those who left the education system at an early age (15 years old or younger).
14. The age of the child was an important factor affecting parental confidence in helping children with homework. Confidence was highest amongst parents of children under 10 (89 per cent). In contrast, confidence was lowest for parents of children aged 16 or over (42 per cent). Confidence was also lower than average for parents who themselves had an illness or disability, those who left the education system aged 16 or under and parents who do not speak English as their first language. Consistent with ratings of confidence, the frequency of helping with homework is closely tied into which school year the child is in. Parents of children in lower school years were more likely than parents of children in later school years to help their child with homework.
15. Nearly half (46 per cent) of full-time working parents felt that they did not spend enough time with their children. Fathers and parents of children with SEN were also more likely than average to say that they did not spend enough time. Non-resident parents were the least positive about the amount of time they spent with their child. A third (32 per cent) said the time they spent with their child was nowhere near enough. In contrast, 16 per cent of young parents (aged under 25) felt they spent too much time with their child.
1
16. Many parents who claimed to be less involved in their child’s schooling expressed a desire for more involvement in the future. Parents of three or more children - 38 per cent, fathers - 37 per cent, and non-resident parents - 45 per cent all mentioned a desire to get more involved. While the majority of fathers (62 per cent) were happy with their level of involvement, significantly more fathers than mothers said they wanted to be more involved (37 versus 27 per cent).
17. As noted earlier, a large proportion of parents of children with a statement of SEN felt very involved in their children’s education. Two fifths of these parents also sought more
involvement in the future.
Access to parental information and advice services (Chapter 3)
18. Around two-thirds (68 per cent) of all parents were ‘service users’, i.e. they had used at least one of the support services asked about within the last year. Parents of children aged under three were most likely to be service users (85 per cent), whilst the least likely users were non-resident parents (43 per cent). Confidence was a key factor: parents in the low confidence group were the least likely to be service users (53 per cent increasing to 85 per cent for the high confidence group).
19. Only tiny proportions of parents who had not used a particular service said they had required information but not received it, i.e. the overwhelming majority of non-service users reported that they simply do not require any advice.
20. The findings relating to ‘informal services’ show that seven in ten (71 per cent) parents had spoken to other parents / carers about parenting issues within the last month and four-fifths (79 per cent) to other family members; however, 12 per cent of parents had spoken to neither. The types of parents who were less likely to spend time talking to other parents or family members were generally the same groups as those who were also found to be less likely to have used formal support services in the last year.
21. Parents were most likely to obtain information, advice or support by means of written material (61 per cent) or in person (56 per cent); in comparison, smaller proportions used the internet (27 per cent) and telephone helplines (19 per cent) for this purpose. There was near uniformity in the use of a telephone helpline for the purpose of receiving information across the various sub-groups, suggesting that, as a means of accessing parental support services, it is perhaps more accessible to parents as a whole than other forms of communication.
22. Only a very small proportion of service users (five per cent) reported that they had not received information in the way they had required it, signalling that the vast majority were content with the method by which they had obtained advice. Further, around nine in ten or more said they found it easy to obtain information about nearly all the different services they required, with services related to schools recording the highest levels for ease of acquiring information (98 per cent). Only disability services recorded notably lower levels of satisfaction for ease of obtaining information (76 per cent).
Confidence in parental support services (Chapter 4)
24. Encouragingly, the vast majority of parents felt that the support services they had
accessed were useful. In particular, 97 per cent of parents who had used services offering information or advice on teenagers felt they had been of use. Services relating to disability received the lowest rating in terms of usefulness (87 per cent), but this figure still
represents a high level of satisfaction in relative terms.
25. There was considerable variation across the different services in relation to whether parents felt their parenting skills / confidence had been improved as a result of the service accessed. Four-fifths (79 per cent) of parents who had sought advice on pregnancy, maternity or babies felt their parenting skills had improved to some extent compared with one third (34 per cent) of parents who had accessed information on finances.
26. There was also some variance across the different services in relation to those that parents said had given them the opportunity to provide feedback. More than one third (36 per cent) of parents who had accessed disability support services said that the option to provide feedback had been available decreasing to fourteen per cent who said there was an opportunity to do so for services related to health, finances and laws and rights.
27. Around three-quarters (77 per cent) of parents said they were confident they would know where to go if they needed to obtain information or advice about general or specific parenting issues.
28. The vast majority (94 per cent) of parents had been in contact with staff at their child’s nursery, school or college within the last year. Two-fifths (39 per cent) had communicated within the last week, whilst only small proportions said there had been no contact in the last year or not at all (three per cent for both).
29. Parents reported having used a number of different methods for obtaining information about their child’s progress within the last year in varying proportions: three-quarters (74 per cent) said they had received information about how their child was getting on at nursery, school or college from parents’ evenings through to only six per cent who had done so via text messages.
Introduction
Policy Background
31. The 2007 Children’s Plan set out the Government’s strategy for making this country ‘the best place in the world for children and young people to grow up’.2 The Plan specifies how DCSF will achieve this by working in partnership with stakeholders, children, young people, and their families (mothers and fathers) and carers. The Plan positions families at the forefront of Government thinking. The Children’s Plan sets out how “families are the bedrock of society and the place for nurturing happy, capable and resilient children”.
32. Working in partnership with parents is a unifying theme of the Children’s Plan. The plan recognises that parents bring up children, not Government, but more needs to be done to reach out and involve all parents. The Government recognises that families are more diverse than ever before, the role of mothers and fathers in modern families is changing. A holistic approach is needed to ensure that services are designed and operate for all parents. The system needs to be flexible to meet the needs of families, in whatever shape or form. In the last 10 years, family life has become more complex with changes in
employment patterns meaning that more people are juggling family life and paid work. Many parents are also supporting elderly relatives as well as their own children.
33. A major challenge is engaging with the most disadvantaged families: These parents often lack the confidence, skills, time or motivation to engage in their children’s learning. The Government has announced a number of measures to tackle these challenges, including outreach support and Parent Support Advisers. The plan recognises these challenges “….We also need to reach out to the minority of families who most need our help but do not always come forward without additional encouragement or support”.
34. The Children’s Plan also included a commitment to putting parents’ views at the heart of Government by creating a Parents’ Panel to advise the Government on policies affecting parents.
“to provide a voice for parents we will set up a new national Parents’ Panel with links into a full cross-section of public opinion, so these perspectives are better reflected in government policy making” Children’s Plan, 2007, page 21.
35. Building on the Children’s Plan, The Government’s recent White Paper3 proposes a ‘Parent Guarantee’. The Parent Guarantee aims to ensure that children have the best possible opportunities to fulfil their potential by ensuring partnership working with mothers, fathers and other carers in their child’s learning and development.
2
DCSF (2007) Children’s Plan
3
Aims and Objectives
36. The DCSF commissioned BMRB to set up and co-ordinate the national Parental Opinion Survey and Parents’ Panel4.
37. The aim of the survey was to provide Ministers with information about the opinions of parents on a range of issues focusing on their role as parents, and in particular their confidence as parents and their views about the services that they or their children use. To provide guidance for the survey the DCSF created a number of parental confidence measures. These were grouped under four major themes and are detailed below.
38. These measures acted as key aims and objectives for the survey. More specifically, the questionnaire and this report have been structured around them.
4
Core Theme Measure
1.
Parents feel able to support their child's
learning
1.1 Are schools doing enough to engage parents?
1.2 Have schools engaged parents? How often?
1.3 Do parents feel able to support their child's learning at school? 1.4 Do parents feel able to support their child's learning at home?
1.5 Do parents have access to information and support needed in
their role as parents as partners?
2.
Access to information and
advice
2.1 How confident are parents that information that they need is available?
2.2 How difficult do parents find it to access the information they need?
2.3 Is the info needed available through appropriate range of
locations / channels?
2.4 Is info needed available to parents of all backgrounds?
2.5 Are parents able to find the information they need in the format they require?
2.6 How parents have used information to access services?
3.
Confidence in support services
3.1 Have parents been involved in the design & development of services?
3.2 Have parents used support services?
3.3 Do parents find that the support services used have met their needs?
3.4 Have services helped parents to support their children?
3.5 Are there any barriers preventing parents from using services (e.g. parents not being aware of services)?
3.6 Can parents with complex needs get the support they require?
4.
Confidence in parenting skills
4.1 Do parents report problems in managing their children's
behaviour?
4.2
Do parents find that services to help them develop their
parenting skills (e.g. available through parenting classes, advice services, Sure Start Children’s Centres, outreach) meet their needs?
4.3 Do parents take up available services which aim to improve their parenting skills?
Summary of survey method
Sample design
43. The survey was based on a representative sample of parents and carers of children aged 0-19 in England. The sample consisted of a core sample and a boost sample of parents living in deprived areas. This was designed to ensure adequate coverage of parents in low income households.
44. Parent and carer was defined as parents, step-parents, foster parents and guardians of child(ren) aged 0-19 who were either resident in their household or lived elsewhere.
45. The sampling and eligibility criteria for the survey were consistent with the NSPC. The only difference was that non-resident parents were also deemed eligible.5 Non-resident parents refer to parents who lived at a separate address from their child. To be eligible to participate in the survey, non-resident parents had to have seen their child in the last 12 months or tried to make contact with their child in the last 12 months. This was to ensure that they were able to answer questions about their child which referenced the previous 12 months.
46. A random probability methodology was adopted6, with a sample drawn from the small-user Postcode Address File. At each sampled address a dwelling unit was randomly selected where there was more than one at the address. Before selecting a parent for interview, where necessary the interviewer randomly selected a “parenting unit” from the sampled household. Parenting unit was defined as a set of parents or single parent of a child - households could contain more than one unit if for example there were three generations at an address (e.g. parent with teenage child with a child of their own). Random selection ensured that single parents living in multi-generational households were not under-represented in the survey. This was because they had an equal chance of selection even if the other parenting unit(s) in the household was made up of two parents. Within each parenting unit, where there were two parents, one was randomly selected for interview.
47. Interviewing was conducted using Computer Assisted Personal Interviewing (CAPI).
48. Further details on the sampling methodology can be found in Appendix C.
Questionnaire design and pilot survey
49. The questionnaire used for the survey had eight discrete sections:
A. Household Grid / Child selection B. Child’s education status
C. Segmentation questions (used to replicate the NSPC Segmentation) D. Parental engagement with children’s learning
E. Information / Advice and confidence in support services F. Informal parenting information / advice services
G. Confidence in parenting skills (self-completion) H. Demographics
5
The inclusion of non-resident parents had a minimal impact on the overall survey findings as they made up just three per cent of the interviewed sample.
6
50. A number of questions in the survey were taken from the NSPC and PICE surveys as there was some overlap with the issues examined in each. New questions were also formulated specifically for this survey, especially for the section dealing with information and advice services for parents.
51. Due to the sensitive nature of some of the questions and the fact that many questions involved asking about personal relationships with other household members who may have been present, a section of the questionnaire was administered using Computer Assisted Self-Interviewing (CASI), which allowed parents to complete this section in private using a laptop.
52. A pilot survey was conducted to test aspects of the questionnaire including the initial contact stage (i.e. the introduction and screening), the interview length and the actual questions themselves (especially the questions being used for the first time on this survey). Nineteen interviews were conducted during the pilot stage and revisions to the questions were made on the basis of the pilot findings.
53. A copy of the questionnaire can be found in Appendix E.
Fieldwork, analysis and weighting
54. All interviews took place in England between February and May 2009. The interview lasted an average of 31 minutes. A total of 2,384 interviews were conducted with parents, based on a 64% response rate.7
55. Once interviews had been conducted, data was collated and open-ended responses were categorised/coded (i.e. respondent verbatim responses were added into response code(s) that most closely matched the response(s) given). All response lists were approved before use and a full SPSS dataset was produced and checked.
56. Design weights8 were applied to reflect the differential probability of selection for eligible parents in different size households. The design weight adjusts for unequal probability of selection within the household. The sample selection for the survey is based on
households; however, only one person was interviewed per household. This means that people who lived in households where there was more than one eligible adult had a different (lower) probability of being interviewed than those who lived alone. The design weight simply makes an adjustment to compensate for the unequal probability of selection. The percentages reported throughout the report are based on weighted data.
57. A socio-demographic profile of interviewed respondents is provided below along with socio-demographic profiles of interviewed respondents in the NSPC and PICE surveys.
58. Please note that although the NSPC was almost the same as the Parental Opinion Survey in terms of interview technique and sampling approach (see above), the PICE survey was slightly different in that it was a telephone survey with parents who had children aged 5-16 attending state schools in England. Therefore, caution should be taken when comparing responses from the Parental Opinion Survey and PICE.
7
Response rate is worked out by dividing the number of interviews achieved (2,384) by the number of eligible/assumed eligible households in the sample (3,741).
8
Table 1; Socio-demographic characteristics of Parents in Parental Opinion and NSPC and PICE surveys
% All Interviewed
Parental Opinion Sample
% All Interviewed
NSPC Sample
% All Interviewed PICE Sample
Gender
Male 44 44 44
Female 56 56 56
Age
Under 25 5 4 1
25-34 26 27 17
35-44 44 45 53
45 or over 26 24 30
Ethnicity
White 86 83 87
Non-white 14 17 13
Household Income Not provided
Under £10,000 10 11 -
£10,000 to £24,999 15 19 -
£25,000 to £44,999 23 26 -
£45,000 or more 31 28 -
Not known / given 21 16 -
Highest Qualification Not provided
Degree level or above 27 29 -
A-level / Voc. level 3 or above 30 29 -
Below A-level / Voc. level 3 or other unknown 28 29 -
No qualifications 15 13 -
Marital status
Married 65 76* 82*
Living with a partner (unmarried) 13 - -
Separated / divorced 13 10 8
Single (never married) 9 14 8
Other 1 1 2
Age of child
Under 3 18 19 0
3-5 16 10 8
6-10 21 26 44
11-15 26 23 43
16-17 12 11 5
18-19 7 12 0
Parent of reference child with SEN
Yes 6 7 12
No 93 93 88
Recreating the parent segments
59. The parent segments were originally formed as part of the National Survey of Parents and Children 2008 (NSPC) study to assist the DCSF in their understanding of different
perspectives and experiences of parents, with the aim to identify the likely incentives and motivations that are important to different parenting types.
60. A range of questions were combined in the NSPC study to create a number of dimensions associated with parenting. These dimensions were then used to develop nine segments by identifying similarities within a group and differences from others.
61. The nine segments identified were:
A1. Comfortable and Confident A2. Committed but discontented A3. Struggling through
A4. Supportive but Frustrated A5. Relaxing and caring A6. Stepping back A7. Separate lives A8. Family focused
A9. Content and Self-fulfilled
Overview of the key characteristics of each parent segment
Segment Overview
A1. Comfortable and Confident
Generally content and optimistic about their lives, enjoy parenting and spending time with their children. They place a high value on learning for their children, who are normally young. Typically both parents work, generating medium-high incomes.
A2. Committed but discontented
Although they sometimes find parenting frustrating and difficult to cope with, they are very committed to their family. They tend to have a lower than average income but they value education highly for its importance to their children’s future.
A3. Struggling through
Sometimes finds parenting frustrating or difficult to cope with and even unrewarding. They tend to have lower than average income, and are less likely than average to feel education will have a strong impact on their child’s future.
A4. Supportive but Frustrated
Although they sometimes find parenting frustrating or difficult to cope with, parents in this segment enjoy spending time with their family. They recognise the importance of learning to their
children, but are less confident than other parents.
A5. Relaxing and caring
This segment enjoys the time that they spend with their children, and rarely finds parenting difficult to cope with. They tend to place less importance on learning than others, but do still get involved in the learning of the children, who are normally young.
A6. Stepping back Although they find parenting rewarding, it is not without frustrations and they are more likely than other parent segments to argue relatively frequently with their children, who are likely to be teenagers. Though they believe in the importance of education, they are less likely to be involved in their child’s learning.
A7. Separate lives Enjoyment of parenting tends to be lower than average in this segment, but the majority of parents feel that they are able to cope most of the time. They are less likely to feel that education is important to their children, who tend to be teenagers, and less likely to get involved in it.
A8. Family focused These parents are likely to be satisfied with their environment and to find parenting enjoyable and rewarding. They value learning and are the most likely to say they feel very involved in their child’s education.
A9. Content and Self-fulfilled
This segment rarely finds parenting frustrating or difficult to cope with and tends to get on well with their children without many arguments - the vast majority are happy with how close they are as a family.They typically have teenage children and higher than average household incomes.
64. Consequently, a subset of seventeen relevant questions were identified that best allocated respondents to their associated segment without impacting too much on
questionnaire content, relevancy and length. These were added into the Parental Opinion Survey and a successful recreation of the original segments was conducted.
65. A summary by parenting segment has been included at the end of each chapter in this report.
66. More details on the recreation of the parent segments are included in Appendix F. Key findings for each segment can be found in Appendix G.
General notes of caution
67. It is important to recognise that parents may view confidence in a variety of different ways. The survey sought to capture general measures of confidence across a range of areas, but it is not known how confidence was assessed by individual parents. Further (more qualitative) research would be needed to unpack how parents assess their own parenting skills.
68. It is also important to recognise the impact of social desirability bias in surveys of this nature i.e. respondents giving interviewers answers they think are socially desirable rather than those which reflect true beliefs or attitudes. While every attempt is made to limit the potential effects of this, some effects are inevitable. These are limited in places by asking respondents to complete some sections of the interview themselves (entering responses into the interviewer’s laptop).
69. At the start of the interview, once information about all members of the household was collected, the computer randomly selected a child within the parenting unit to be used as the “reference child” during the interview. As the interview often focused on the
parent/child bond, this enabled questions to be asked about one particular child, rather than all children present. Reference children selected covered the full age-range 0-19. Although the majority of questions were asked only in relation to the reference child there were also questions asking about all of the respondents’ children. These questions are highlighted throughout the report.
Structure of the report
70. The chapters focusing on the survey results have been arranged thematically, drawing together questions on similar issues from across the parental survey. The structure follows the 4 broad parental confidence themes (discussed earlier) and is as follows:
• Confidence in Parenting Skills (Chapter 1)
• Parents Ability to Support their Child's Learning (Chapter 2)
• Access to Information and Advice (Chapter 3)
• Confidence in Support Services (Chapter 4)
Reporting conventions
71. When comparing sub-groups, the report only includes differences which are
statistically significant at the 95% confidence level.
72. All data are weighted to make the findings representative of the sample population.
73. The following conventions have been used in the tables throughout the report:
• Where the term “parent” is used, this refers to the parent or guardian of the reference child.
• Where the term “child” is used, this refers to the reference child or young person aged 0-19 that was selected at the start of the survey.
• Where the term “mother” is used, this refers to the interviewed mother, step-mother, foster-mother or other female guardian.
• Where the term “father” is used, this refers to the interviewed father, step-father, foster-father or other male guardian.
• Base refers to the unweighted base. It should be noted that due to the sampling strategy adopted, the weighted profile of the sample varies significantly from the unweighted profile. Principally this is due to the over-sampling of more deprived areas.
• Where percentages add to more than 100%, this is because respondents could give more than one answer at that question.
• A * symbol denotes less than 0.5 per cent.
1 Confidence in Parenting Skills
Key Findings
• The vast majority (94 per cent) of parents were confident when caring for their children.
• Although still relatively high, confidence was significantly lower than average amongst parents who did not speak English as a first language (81 per cent).
• Nearly all parents (99 per cent) found parenting rewarding, with 83 per cent saying that they found it rewarding ‘most of the time’. Non-resident parents expressed the lowest levels of satisfaction (73 per cent), whilst parents of children under three years old found parenting most rewarding (88 per cent).
• Over two thirds of parents found parenting frustrating most or some of the time. Parents of children with SEN were less likely than average to find parenting rewarding and were more likely to find it frustrating most or some of the time (74 per cent said this was the case).
• Parents of children with SEN were more likely than average to cite difficulties in managing their children’s behaviour and experience negative outcomes as a result.
• Over a third (36 per cent) of parents argued with their child either most days or more than once a week. However, almost all parents (99 per cent) said they got on well with their child with just over three quarters (77 per cent) saying they got on very well.
1.1 Introduction
74. This section provides some important background information about parental confidence levels, which sets the later sections of this report in context. Confidence in parenting is a central area of interest for the DCSF and the benefits of being a confident parent have long been recognised. More specifically, the confidence of parents may impact on parents’ perceived ability to support their child’s learning and their interaction with parental support services. The PICE Survey in 2007 showed that confidence levels had fallen over time in some areas (notably confidence helping children with homework). The benefits of greater parental involvement are widely acknowledged, e.g. Desforges (2003)9, but parents need to feel equipped with the necessary levels of confidence to get involved in their children’s education and learning.
75. Aside from parental involvement levels, some parents face greater difficulties dealing with behaviour issues. This section also focuses on the challenges that some parents face and the confidence parents have in dealing with such issues. This section also seeks to unpack parental frustration alongside which groups find parenting most rewarding.
76. Specifically, this section addresses the following confidence theme:
• Do parents report problems in managing their children’s behaviour?
77. There are a number of measures related to the core theme of confidence in parenting skills. Chapters 3 and 4 explore these measures in greater depth as they are primarily related to information and support services:
• Do parents find that services to help them develop their parenting skills meet their needs? (covered in section 4.2)
• Do parents take up available services which aim to improve their parenting skills?
(covered in section 3.2)
• Did these services improve their parenting skills? (covered in section 4.2.2)
1.2 Confidence of parent when caring for child
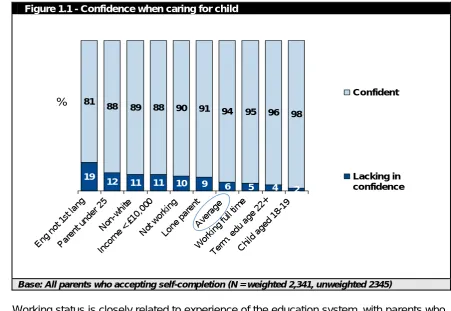
78. The vast majority of parents (94 per cent) felt confident when caring for their children. As figure 1.1 shows, confidence was highest for parents with older children - aged 18-19 (98 per cent) and for parents who left the education system aged 22+ (96 per cent).
Furthermore, parents who worked full time had high levels of confidence (95 per cent).
79. In contrast, confidence was lowest for parents where English was not their first language (81 per cent). A fifth (19 per cent) were therefore lacking in confidence - a significant minority. Although still relatively high, this is a notable lack of confidence compared with other types of parents. Confidence was also lower than average for non-white parents (89 per cent). However, this is heavily driven by larger proportions of these parents having English as a second language. For non-white parents with English as a first language, confidence increases (94 per cent).
9
80. Younger parents (aged under 25) were also lacking in confidence (88 per cent) compared with their older counterparts.
Figure 1.1 - Confidence when caring for child
Confident
19
12 10 9
6 5 2
81
88 89 88 90 91 94 95 96
98 4 11 11 Eng not 1st lang Par ent under 25 No n-wh ite Inco me <
£10, 000 Not wo
rkin g Lon e p arent Aver age Wor king f
ull t ime
Ter
m. edu age 22+ Chi
ld aged
18-19
%
Lacking in confidence
Base: All parents who accepting self-completion (N = weighted 2,341, unweighted 2345)
81. Working status is closely related to experience of the education system, with parents who left the system aged 22+ most likely to be working full time. However, further interrogation of the data show that both variables appear to be important drivers of confidence. More specifically, confidence was particularly low amongst parents that left education aged under 16 who were not working (89 per cent) compared with those who left aged 22+ and were working full time (97 per cent).
1.3 Parental reward
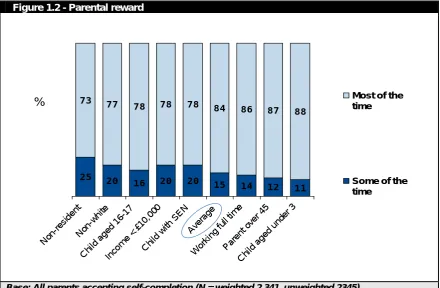
82. Nearly all parents (99 per cent) agreed that they found being a parent ‘rewarding’ most or some of the time. However, analysis of the proportion who found it rewarding most of the time reveals various sub-group differences.
83. As figure 1.2 illustrates, non-resident parents were least likely to find parenting rewarding most of the time (73 per cent). Other parents who were less likely than average to find parenting rewarding most of the time included non-white parents, parents with older children (aged 16-17), parents on lower incomes (less than £10,000 per annum) and parents of children with SEN.
84. In contrast, parents of children aged under three were most likely to find parenting
Figure 1.2 - Parental reward
Most of the time
25 20
16 20 20 15 14 12 11
73 77
78 78 78 84 86 87 88
No n-re side nt Non-w hite Chi ld ag
ed 16 -17 Incom e < £10, 000 Child with SE N Ave rage Wo rkin
g ful l tim
e
Par ent ov
er 4 5 Child age d u nde r 3 %
Some of the time
Base: All parents accepting self-completion (N = weighted 2,341, unweighted 2345)
1.4 Parental frustration
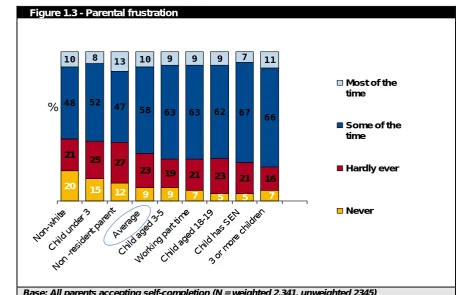
85. The survey uncovered higher levels of frustration than found in the NSPC. Two thirds of parents (68 per cent) found parenting frustrating most or some of the time (compared with less than half - 45 per cent - in the NSPC). This is a large difference, which might be attributable to a number of factors including an actual shift in opinion, social desirability bias, question positioning or sampling error.
86. The proportion of parents that are frustrated may have increased, although such a large increase is unlikely to have been expected in a relatively short time period. It is therefore reasonable to assume that some differences may be due to the varying content of the two surveys. More specifically, prior content asked in each survey will have some
(unquantifiable) impact on the responses to future questions i.e. the content of the two surveys is not identical and there are many differences.
87. There may also be an element of social desirability bias (in both surveys) in the way that respondents answer questions, potentially giving interviewers answers they think they want to hear rather than those reflecting true beliefs or attitudes. With a sample size of c.2,300, some degree of sampling error is also inevitable.
88. Frustration peaked in larger families (77 per cent of parents with three or more children were frustrated ‘most or some of the time’). As noted above, parents of children with SEN were less likely than average to find parenting rewarding. They were also more likely to find parenting frustrating ‘most or some of the time’ (74 per cent). This is in line with findings from the NSPC, which show that parents of an SEN child were more likely to be frustrated.
Figure 1.3 - Parental frustration
20 15
9 7 5 5
21
25 27
23 19
21 23 21 16
48 52 47
58 63 63 62 67 66
10 8 13 10 9 9 9 7 11
9 12 7 No n-whi te Child un der 3 No n -re
side nt p
aren t Ave rage Child age d 3 -5 Wo rking part time Chi ld ag
ed 18 -19 Child has SEN 3 or more chil dren
Most of the time
%
Some of the time
Hardly ever
Never
Base: All parents accepting self-completion (N = weighted 2,341, unweighted 2345)
90. It is important to look deeper into levels of frustration to unpack the key drivers of
increased frustration levels. A logistic regression was conducted to control for a number of factors when looking at levels of frustration among respondents. This approach allows the impact of different variables to be detected and isolates the most significant drivers of frustration.
91. Further details can be found in Appendix H. In summary, there are a number of important factors that affect parental frustration. Frustration is driven by demographic and attitudinal factors. Key demographic factors include:
- Increased number of children;
- Lower education background; and
- Working status (two full-time working parents).
It is worth noting that whilst levels of parental involvement are affected by gender of the parent and age of the child (see later section 2.2) frustration levels are not significantly affected by either of these factors.
92. Attitudinal factors which have the largest impact include:
- Perceived lack of time;
- Perceived behaviour issues; and
- Lack of parental confidence.
93. While the above analysis shows that the demographic and attitudinal factors are
94. There are a number of policy challenges associated with engaging ‘frustrated’ parents further. These parents may need more support and encouragement as well as work to build their parental self-esteem and confidence. There are possible opportunities for schools to reach out to these parents, although they may require help identifying and supporting them. Additional support might be needed in behaviour management
strategies. The key barriers that schools and support services might face in engaging this group are likely to centre on time constraints, a particular issue amongst working parents.
1.5 Frequency of Arguing
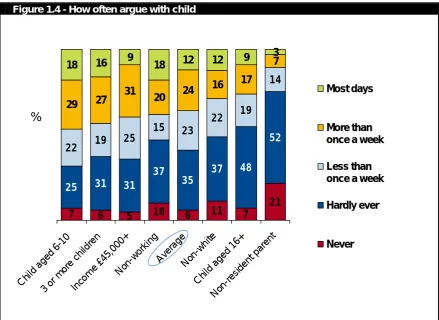
95. Figure 1.4 shows that over a third (36 per cent) of parents argued with their child either most days or more than once a week. The proportion doing so increased amongst parents of children aged 6-10 (47 per cent) and non-working parents (38 per cent).
96. The amount of time parents spend with their children also appears to influence frequency of arguing. Parents who said they spent too much time with their child were more likely than average to say they argue with their child on most days (29 per cent). As might be expected, non-resident parents (who are less likely to see their children) were least likely to argue with their child (10 per cent did so most days or more than once a week). Parents of young people aged 16 or above were also less likely than average to argue on a
[image:26.595.85.525.348.668.2]frequent basis (26 per cent).
Figure 1.4 - How often argue with child
7 6 5 10 6 11 7 21
25 31 31
37
35 37
48 52
22 19 25
15 23 22
19 14 29 27 31 20 24 16 17 7
18 16 9 18 12 12 9
3
Chi ld ag
ed 6 -10
3 or m ore c
hildr en
Inco me £
45,0 00+ Non -wor king Aver age Non -wh ite Child aged 16+ Non -res iden t pa ren Most days
%
More than once a weekLess than once a week
Hardly ever
t
Never
1.6 Relationship with child
97. Almost all parents (99 per cent) said they got on well with their child with just over three quarters (77 per cent) saying they got on very well and a further 22 per cent fairly well. This puts some of the previous findings into context and while over a third of parents reported arguing with their children most days or more than once a week, nearly all parents reported positive relationships with their children.
98. Figure 1.5 shows that the age of the child influenced relationships. Parents of children aged 6-1010 were most likely to say they got on very well (81 per cent) and there was a gradual decline for parents of older children to 70 per cent of those with a child aged 16 or above. Related to this, frustration levels were above average for parents of older children and confidence was also lower for parents of children aged 16 or over.
[image:27.595.77.532.333.626.2]99. Illness or disability and SEN also had an impact on relationships. Ill or disabled parents (72 per cent) and those with ill or disabled children (70 per cent) or children with SEN (71 per cent) were less likely than average to get on very well. Similarly, parents of children with SEN or an illness/disability were more likely than average to say they struggle to control their child’s behaviour (20 per cent and 27 per cent respectively versus 13 per cent average).
Figure 1.5 - How well get on with child
%
Very well
2 2 3 4 2 1 1 1
29 28 27 25 24
22 20 18 14
69 70 70 71 72 77
79 81 84
3 or mor
e chi ldren
Chi ld aged
16+
Ch ild il
l/dis b
Child has
SE N
Res p. il
l/disb Aver
age 1 chi
ld
Chi ld aged
6-10
No n-resi
den t
Fairly well
Badly
Base: All Parents whose child was aged 6 or above (N = weighted 1537, unweighted 1513)
10
1.7 Behaviour problems affecting mental health of parents
100. Eleven per cent of parents said problems with their child had affected their mental health in the previous 12 months. It is important to note that these findings relate to parents’ reported perceptions and do not necessarily imply causality.
101. Parents of children with SEN or an illness / disability were more likely than average to say this (24 per cent and 21 per cent respectively) as were parents who themselves had an illness or disability (22 per cent). This might be explained by these parenting groups being less likely to get on well with their child (see above).
102. Parents who were not working (18 per cent) and lone parents (17 per cent) were also more likely than average to say problems with their child had affected their mental health in the last 12 months.
1.8 Family rows and tensions
103. Following on from findings in section 1.5, one in five parents said problems with their child had led to major family arguments in the previous 12 months and 36 per cent said they had caused tensions between them and their partner. The survey did not follow up on the nature of such arguments or problems with children and these findings therefore need to be treated with an element of caution, in light of other more positive findings about parent and child relationships (see section 1.6).
104. Child SEN and illness or disabilities (amongst both parents and children) were again determining factors. Parents of children with SEN or illness / disability were more likely than average to say problems had led to tension with their partner (both 43 per cent), while ill or disabled parents and those whose child had SEN were more likely than average to have had major family rows (26 per cent and 35 per cent respectively).
1.9 Managing behaviour - Special Educational Needs
105. The PICE survey highlights various sub-group differences that have impacts on measures of parental involvement and communication, but some of the strongest impacts and most consistent differences were found in respect of parents of children with SEN.
106. To set this in context, the SEN Code of Practice (2001)11 acknowledges the pressure that parents of pupils with SEN can come under. It recognises that parents need support to gain confidence in making their thoughts known to staff and it emphasises the importance of parental involvement in their children’s education. Among its many themes, the Code of Practice aims to promote a climate of co-operation and participation between parents and school, enabling pupils with SEN to achieve their potential.
107. Further to the above, the Lamb Inquiry12 recommended changes in the area of communication and engagement with parents - “We need to ensure that parents can access the information that they need, when they need it, in ways that are convenient to them and that include face-to-face discussion with those who are working with their child”. The Inquiry described how gaps in information had a significant impact on parental
confidence.
11
Special Educational Needs: Code of Practice: 2001 (DfES /581 / 2001)
12
108. The PICE survey found that parents of children with statements of SEN were more likely to feel a heightened sense of involvement in their child’s education. The survey also showed a clear desire for parents of children with SEN to become more involved in their children’s schooling. Parental involvement is examined in further detail in Chapter 2 and comparisons are made between the surveys. However, it is important to summarise some important findings in relation to SEN and behaviour. Parents of children with SEN were more likely than average to:
• Argue with their children at increased frequency (47 per cent argued with their child most days or more than once a week - versus 36 per cent average);
• Get on less well with their children (68 per cent said they got on with their child very well - versus 76 per cent average);
• Have problems with their child’s obedience (21 per cent disagreed that there child was generally obedient - versus eight per cent average);
• Struggle to control their child’s behaviour (27 per cent agreed that they struggled to control their child’s behaviour - versus 14 per cent average);
• Experience behaviour problems which have affected their mental health (12 per cent said their mental health had been affected very often or a fair amount in the last 12 months - versus four per cent average);
• Experience tension with their partners (18 per cent had experienced tension with their partner very often or a fair amount in the last 12 months - versus eight per cent average); and
• Experience major family rows (14 per cent had experienced major family rows very often or a fair amount in the last 12 months - versus five per cent average).
109. Parents of children with SEN were the most likely to have used support services to obtain information and advice on behaviour issues (e.g. anti-social behaviour, bullying, and discipline). A fifth (20 per cent) had used support services in this area compared with nine per cent of parents whose children did not have SEN.
110. The PICE survey and this research provide a strong message about some of the specific challenges and possible information needs that parents of children with SEN have.
111. The research does not examine type of SEN in more detail. SEN cover a broad spectrum of needs and it is possible that the behaviour challenges of some parents will be very different to others. This is likely to be related to the precise needs and age of the child. Further research would be needed to unpack this further.
1.10 Managing behaviour - lone parents
112. The data also indicate some important findings related to lone parents. More specifically, lone parents were more likely than average to:
• Only get involved in behaviour management when their child has done something really serious (31 per cent said this ‘always applies’ - versus 24 per cent average); and
113. Mothers were also more likely than fathers to experience behaviour problems which have affected their mental health. Seven per cent of fathers had experienced an adverse affect on their health13 compared with 14 per cent of mothers. Once again, it is important to note that these findings relate to parents’ reported perceptions and do not necessarily imply causality.
114. DCSF analyses of the Longitudinal Study of Young People in England (LSYPE) data show that children from single parent families have lower levels of attainment than other
families. However, much of this underachievement is compounded by income (i.e. lone parents are poorer than other families). The Parental Opinion Survey data show that this is also the case (i.e. lone parents do have lower incomes). However, this does not explain some of the above differences. For instance, in comparison to other families, lone parents on higher incomes still cite higher than average levels of frustration, and are more likely to report getting involved in behaviour management only when their child has done
something really serious.
115. The above findings do seem to indicate that lone parents face particular challenges which affect their perceived ability to manage their child’s behaviour. Furthermore, lone parents were more likely than other families (12 versus nine per cent) to have used support services to obtain information and advice on behaviour issues (e.g. anti-social behaviour, bullying, and discipline).
1.11 Creating a Confidence Index
116. From the survey results a Confidence Index has been created, providing a measure of overall parental confidence. It has been created using statistical processes to establish a number of themes (i.e. dimensions) related to parental confidence, such as confidence when having to deal with the poor behaviour of a child. Question items were chosen to represent each of these themes with a numerical value applied to the response given at each question (the more the response was associated with high confidence the higher the value given). The values were then combined for each parent (based on the answers they had given at each of these questions) giving an overall ‘score’ of parental confidence. A higher score indicated higher confidence.
117. The lowest possible score that could be achieved in theory was 18 and the highest was 98. In practice, 35 was the lowest achieved score by a parent and 94 the highest for this wave of the survey. The mean average score achieved was 69.14 The confidence index (and mean average score) may be used over time to monitor whether or not levels of confidence are subject to change. It may also be used on a cross-sectional basis (in each year of the Parental Opinion Survey), to examine how confidence varies between different sub-groups (e.g. age, gender - see below).
13
Defined as problems which had affected their mental health very often, a fair amount or occasionally in the last 12 months
14
118. Respondents were also allocated into one of the following groups based on their ‘score’:
• ‘Lower’ confidence: The score range for parents in this group was between 35 and 61;
• ‘Medium’ confidence: The score range for parents in this group was between 62 and 76;
• ‘Higher’ confidence: The score range for parents in this group was between 77 and 94.
119. The above groupings were constructed to ensure there were adequate numbers in each group for in-depth sub-group analysis, whilst also making sure that the overriding majority of parents appeared in the Medium confidence group. In total, 20 per cent of parents were allocated to the lower confidence group, 60 per cent to the medium confidence group and 20 per cent to the higher confidence group. This split was not created based on any pre-existing concepts and it should not be assumed that 20 per cent of all parents are low in confidence or that 20 per cent of all parents are high in confidence. The data have been grouped in this way for analysis purposes.
Chart 1.1 illustrates the raw Confidence Index score applied to all respondents, showing the frequency distribution split between the Lower, Medium and Higher confidence
groups.
Chart 1.1 - Distribution of Raw Confidence Index Score
100.00 90.00
80.00 70.00
60.00 50.00
40.00 30.00
250.00
200.00
150.00
100.00
50.00
0.00
Higher Confidence
group Lower
Confidence group
Medium Confidence
group
Fr
eq
uency
Confidence Index Raw Score
Base: All PARENTS (N = 2,384)
Further details of the index can be found in Appendix I.
121. Figure 1.6 shows that age of child was a notable factor determining high confidence and parents of children aged under three were most likely to appear in the higher confidence
the 3 per
e education also impacted on confidence. Parents who left the education system aged 19 or above were more likely than average to fall into this
ikely to appear in the lower confidence group (46 per cent). Similarly, lone parents and parents who themselves had an illness or
t). group (46 per cent), while only three per cent of parents of young people aged 16 or above were highly confident. The number of children in the household was also an influencing factor and parents with a child aged under three were less likely to fall into higher confidence group if they had more than one child. Just over half of parents (5 cent) with an only child aged under three were in the higher confidence group falling gradually to a third of parents with a child aged under three where at least two other children lived in the household.
122. The age parents finished full-tim
group (26 per cent). Non white respondents and those not working were also more likely to have high confidence (both 26 per cent).
123. In contrast, non-resident parents were most l
[image:32.595.84.525.323.619.2]disability were more likely than average to have low confidence (both 26 per cent), while fathers were more likely than mothers to fall into this group (24 per versus 16 per cen
Figure 1.6 - Confidence Index
46 35
24 20 20 20
3 46 62
57 57 61
60 54 54 58
51
8
18 18 16 20 26
46 16 26 25 26 26 Non res iden t par
ent Child
age d 16+ Res
p. il l/dis
b Lone p
are nt Fat hers Aver age Non -whi te No n-wor king Ter m. ed
u ag e 19+ Chi
ld und er 3
3 High confidence Medium confidence Low confidence %
Base: All PARENTS (N = 2,384)
124. I racteristics of parents resulted in the largest differences in high parental confidence, CHAID15 models were also constructed. CHAID modelling is a
els.
n order to recognise what cha
widely used and well established technique for advanced statistical analysis, which comprehensively searches to identify relationships within the data. It separates the data into statistically different groups, based on the probability of having a particular
characteristic (such as level of education). Independent variables which were thought to affect whether a parent had ‘high confidence’ were entered into the CHAID mod
15
125. As mentioned earlier, respondents were allocated to one of three groups based on their confidence index ‘score’. CHAID models were constructed which looked at the largest
variables were included in the models. These included gender; age; marital status; whether lone parent or part of a couple; terminal age of education;
e input ing to
128. bles were entered into the model, the primary determinant of high parental confidence appeared to be the age of the reference child. Around half (53 per cent) of
likely the parent was to be in the higher confidence group. In particular, where the child was aged 16 or over and the parent was part of a
e interesting findings related to the parental segments. These are summarised at the end of this chapter, alongside a wider discussion of the
131. ere less likely to be in the higher confidence group (15 per cent) compared with mothers (23 per cent), although this difference was not as large as exhibited between
is was able to further split mothers by their working status. Mothers who had finished their education at age 16 or earlier and were working full time were less
in the higher confidence group if there was more than one child in the household (12 per cent). Where there was only one child in the differences in the ‘high confidence’ group i.e. respondents in the top 20 per cent of the confidence index score.
126. A range of demonstrable
highest qualification achieved; working status; household income; number of children in household; age of reference child; Government Office Region; housing status; religion; whether child has special educational needs (SEN); whether child has a disability; whether parent themselves has a disability; whether English is first language of household; whether a non-resident parent; parental segment; and ethnic group. 127. A number of models were created which used different combinations of the abov variables. This was done to try to ensure consistency across models while also try find fewer visible patterns among different subgroups.
Age of child
When all varia
parents where the child was less than 3 years old and was the only child in the household were in the higher confidence group.
129. The older the reference child, the less
couple (as opposed to being a lone parent), two per cent of this parental sub-group were in the higher confidence group.
130. The CHAID model also found som
different segments. The next section looks at the wider implications of high confidence.
Gender
Fathers w
other subgroups.
132. The CHAID analys
likely to be in the higher confidence grouping (14 per cent). This compared with 20 per cent of mothers who had finished their education at age 16 or earlier but who were working part time or not working at all.
133. Fathers appeared to be less likely to be
Educational achievement
134. Educational achievement was already shown to be an important determinant in
distinguishing high confidence. Another result revealed by the CHAID analysis concerned parents with no disability themselves who were working part time or not working at all. Those whose highest qualification was A-level or equivalent were more likely to be in the higher confidence group compared with those with lower education attainment (29 per cent and 22 per cent respectively). Parents who themselves had a disability (who were working part time or not at all) were less likely than both of the previous groups to exhibit high confidence (17 per cent).
1.11.1 Implications of high confidence
135. It is important to examine the impact that parental confidence has on other aspects of parenting, such as enjoyment of parenting, parental involvement and behaviour management. These areas are all addressed further below.
Enjoyment of parenting
Confident parents were more likely to enjoy parenting and find it less frustrating. They were more likely to be content with the amount of time they spent with their child.
136. Respondents in the higher confidence group were more likely than average to say they found parenting rewarding ‘most of the time’ (92 versus 83 per cent average). They were also more likely to say they hardly ever or never found parenting frustrating (44 versus 33 per cent average).
137. Furthermore, they were more likely to say they spent about the right amount of time with their child (66 versus 61 per cent average). This was in contrast to those in the lower confidence group who were more likely to say they spent nowhere near enough time with their child (15 versus eight per cent average).
Involvement levels
Confident parents were more involved in their child’s education.
138. Highly confident parents were more likely than average to say they were very involved in their child’s progress through nursery, school or college (66 versus 44 per cent average). They were also more likely to say that they were ‘much more involved than their partner’ (32 versus 25 per cent average). This is supported by their increased likelihood of helping their child with homework every day (26 versus 13 per cent average).
Behaviour management
Confident parents argued less with their children, faced fewer struggles managing behaviour and experienced less tension as a result of their children’s behaviour.
139. Highly confident parents were more likely than average to hardly ever argue with their child (40 versus 35 per cent average) or struggle to control their child’s behaviour (77 per cent