Evidence Report 1
November 2008
Evidence Reportspresent detailed findings of the research andpolicy analysis generated by the Research and Policy Directorate of the UK Commission for Employment and Skills. The Reports contribute to the accumulation of knowledge and intelligence on a range of skills and employment issues through the publication of reviews and synthesis of existing evidence or through new, primary research. The Evidence Reports are accompanied by Executive Summaries, presenting the key findings of the main Evidence Report. These and other outputs in the Research and Policy Analysis series can be accessed on the Research and Policy pages of the UK Commission’s websitewww.ukces.org.uk
Skills
for
the
W
orkplace:
Employer
Perspectives
Evidence
Report
1
Produced by IFF Research Ltd for the UK Commission for Employment and Skills
To obtain copies of this document, contact: UKCES
3 Callflex Business Park Golden Smithies Lane Wath-upon-Dearne South Yorkshire S63 7ER
T +44 (0)1709 774 800 F +44 (0)1709 774 801
UKCES
28-30 Grosvenor Gardens London
SW1W OTT
T +44 (0)207 881 8900 F +44 (0)207 259 1290
Employer Perspectives
Jan Shury, Ben Davies and Timothy Riley
IFF Research Ltd
Carol Stanfield
Senior Research Manager
UK Commission for Employment and Skills
Launched on 1
stApril 2008, the UK Commission for Employment and Skills is a key
recommendation in Lord Leitch’s 2006 review of skills
Prosperity for All in the Global
Economy: World Class Skills.
The UK Commission aims to raise UK prosperity and
opportunity by improving employment and skills. Its ambition is to benefit individuals,
employers, government and society by providing independent advice to the highest levels
of the UK Government and Devolved Administrations on how improved employment and
skills systems can help the UK become a world class leader in productivity, in
employment and in having a fair and inclusive society.
Research and policy analysis plays a fundamental role in the work of the UK Commission
and is central to its advisory function. In fulfilling this role, the Research and Policy
Directorate of the UK Commission is charged with delivering a number of the core
activities of the UK Commission and has a crucial role to play in:
•
Assessing progress towards making the UK a world-class leader in
employment and skills by 2020;
•
Advising Ministers on the strategies and policies needed to increase employment,
skills and productivity;
•
Examining how employment and skills services can be improved to increase
employment retention and progression, skills and productivities.
•
Promoting employer investment in people and the better use of skills.
We will produce research of the highest quality to provide an authoritative evidence base;
we will review best practice and offer policy innovations to the system; we will undertake
international benchmarking and analysis and we will draw on panels of experts, in the UK
and internationally, to inform our analysis.
This first Evidence Report, reporting on the results of a major survey of employers, will be
followed in the coming months by other reports on major projects in our Business Plan.
We hope you find the report useful and informative in building the evidence we need to
achieve a more prosperous and inclusive society.
Professor Mike Campbell
Director of Research and Policy Directorate
Lesley Giles
Table of contents
Executive Summary ... i
Introduction... i
Skills challenges... i
Training ... ii
High Performance Working Practices ... ii
Vocational Qualifications ... iii
Perceptions of SSCs ... iv
Conclusion ... iv
1
Introduction and survey methodology... 1
1.1 UK Commission for Employment and Skills... 1
1.2 Methodology ... 2
2
Skills Challenges ... 4
2.1 Recruitment difficulties ... 4
2.2 Education System Skills Supply ... 6
2.3 Retention – Retaining Valued Staff ... 8
3
Training... 10
3.1 Training Planning and Budgets... 11
3.2 Training Levels... 13
3.3 Informal Training Practices... 15
3.4 Barriers to Training... 18
3.5 Access to Help and Advice ... 21
3.5.1 Organisations that establishments approach for information or advice ... 23
3.5.2 Overall awareness of business support organisations ... 24
4
High Performance Working Practices... 26
4.1 Introduction... 26
4.2 High Performance Working Practices (HPWP)... 27
4.3 Working Practices and the 4 A’s Model ... 30
4.3.2 Attitude ... 34
4.3.3 Application... 35
5
Vocational Qualifications ... 39
5.1 Introduction ... 40
5.2 Awareness and Knowledge of Vocational Qualifications... 41
5.2.1 Depth of Knowledge of Vocational Qualifications... 44
5.3 Use of Vocational Qualifications ... 45
5.3.1 Use of Vocational Qualifications in training funded or arranged by employers... 45
5.3.2 Training to meet Legislative Requirements ... 48
5.3.3 Training to NVQs / SVQs ... 49
5.3.4 Use of VQs in Recruitment... 50
5.4 Benefits of Vocational Qualifications to Employers ... 52
5.4.1 Flexibility of Vocational Qualifications... 55
5.5 Comparison of NVQs / SVQs and other Vocational Qualifications ... 56
5.6 How Vocational Qualifications Reward Individuals ... 58
5.7 Barriers to greater uptake of Vocational Qualifications ... 60
6
Perceptions of Sector skills councils ... 63
6.1 Introduction ... 64
6.2 Awareness and Understanding of SSCs ... 65
6.2.1 Awareness of elements of the SfBN ... 67
6.2.2 Awareness of network - summary ... 71
6.2.3 Understanding of the SfBN, SSDA, and SSCs ... 72
6.3 Engagement with SSCs... 74
6.4 Nature of Engagement with SSCs ... 76
6.5 Satisfaction, Advocacy and Impact ... 78
6.6 Impact on Establishments and Sector... 80
7
In conclusion... 83
Bibliography... 85
APPENDIX 1: Technical details ... 86
Sampling Approach... 86
Sample Source... 88
Questionnaire Design ... 89
Pilot Exercise ... 90
APPENDIX 2: SSC Footprints (SIC definitions)... 94
APPENDIX 3: Changes to SSC footprints since 2005 survey ... 97
APPENDIX 4: ConstructionSkills, Automotive Skills and Skills for Care
Table of Graphs and Charts
Figure 2.1 Recruiting staff with the skills needed ... 5
Figure 2.2 Supply of skills through the education system ... 7
Figure 3.1 Training budgets and training plans, UK, 2003 – 2007... 11
Figure 3.2 Training budgets and training plans by establishment size, UK,2007 ... 12
Figure 3.3 Correlation between training plans and training budgets, 2007 ... 13
Figure 3.4 Training status by size of establishment... 15
Figure 3.5 Use of informal training practices ... 16
Figure 3.6 Relationship between formal and informal training practices ... 17
Figure 3.7 Barriers to (further) training... 18
Figure 3.8 Barriers to (further) training by training status... 20
Figure 3.9 Confidence in knowing whom to approach for information or advice by size of establishment ... 22
Figure 3.10 Organisations establishments would approach for information or advice ... 23
Figure 3.11 Overall awareness of business support organisations ... 25
Figure 4.1 HPWP amongst all establishments ... 27
Figure 4.2 Establishments with 10 or more HPWP by establishments ... 29
Figure 4.3 Relationship between Skills Challenges and HPWP uptake ... 30
Figure 4.4 4 A’s model of capability ... 31
Figure 4.5 Establishments’ adoption of High Performance Working Practices designed to build on the ability of their workforce ... 33
Figure 4.6 Establishments’ adoption of High Performance Working Practices designed to build on the attitude of their workforce ... 34
Figure 4.7 Establishments’ adoption of practices designed to facilitate application ... 36
Figure 4.8 Linkage between HR and business strategies... 38
Figure 5.1 Spontaneous awareness of Vocational Qualifications ... 41
Figure 5.2 Prompted awareness of Vocational Qualifications ... 43
Figure 5.3 Depth of awareness of Vocational Qualifications... 44
Figure 5.4 Training to Vocational Qualifications... 47
Figure 5.5 The role of legislative requirements in training to VQs ... 48
Figure 5.6 Whether VQs trained to were NVQs / SVQs ... 49
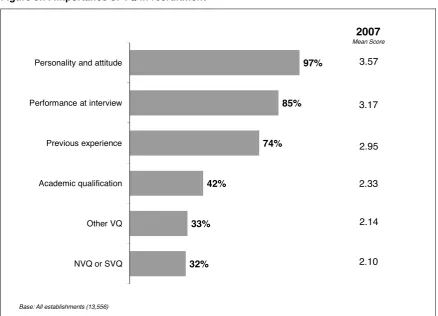
Figure 5.7 Importance of VQ in recruitment ... 50
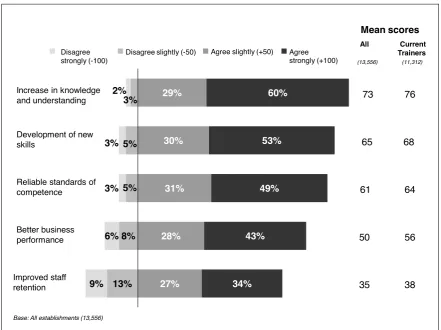
Figure 5.8 Benefits of Vocational Qualifications... 52
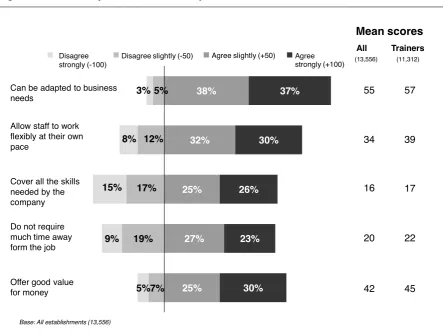
Figure 5.9 Whether qualifications provide ‘relevant and valuable skills’ to employers .... 54
Figure 5.13 Impact of acquisition of VQs on employee pay and promotion... 59
Figure 5.14 Barriers to the uptake of vocational qualifications ... 61
Figure 6.1 Awareness of own SSC by size of establishment, UK, 2004 – 2007 ... 66
Figure 6.2 Awareness of own SSC by country, 2004 – 2007... 67
Figure 6.3 Awareness of network elements ... 68
Figure 6.4 Awareness of network elements by establishment size ... 69
Figure 6.5 Awareness of network elements by country... 70
Figure 6.6 Awareness of network elements – subgroup differences ... 71
Figure 6.7 Levels of understanding of network elements... 72
Figure 6.8 Perceived role of own SSC... 73
Figure 6.9 Engagement with own SSC... 75
Figure 6.10 Frequency of contact with own SSC – time series ... 76
Figure 6.11 Nature of dealings with own SSC ... 77
Figure 6.12 Overall satisfaction with dealings in last 12 months... 78
Figure 6.13 Satisfaction with individual contacts in last 12 months ... 79
Figure 6.14 Impact on establishment’s approach to skills development... 80
Executive Summary
Introduction
This report provides analysis from a major survey of employers across the UK, exploring
their experiences and perceptions of key aspects of the skills system across the UK. This
is an important platform of evidence for the newly formed UK Commission for
Employment and Skills in delivering its remit to raise UK prosperity and opportunity by
improving employment and skills.
The survey covers:
•
Skill challenges experienced by employers;
•
Training practices;
•
Wider high performance working practices;
•
Perceptions of vocational qualifications (this aspect was included for the first time in
this survey to provide data for the evaluation of the UK Vocational Qualification
Reform, Programme);
•
Perceptions of Sector Skills Councils.
The survey was conducted between December 2007 and February 2008, before the
economic downturn began to bite in the UK. It is important to view the results of the
survey in this context.
Skills challenges
Skills related problems recruiting staff continue to pose an important challenge for
employers, although the challenge is one that has been decreasing over the last few
years. Around half of establishments (52%) reported experiencing difficulty in recruiting
staff with the required skills, compared to 57% in 2005 and 62% in 2003.
Half of establishments reported that the education system does not supply enough
people equipped with the skills needed when starting a job. This figure has changed little
over the last five years.
The more problems an employer experiences in terms of external skills shortages, the
more likely they are to report difficulties retaining valued staff.
Training
Just over one third (36%) of establishments have a budget for training expenditure and
just under half (48%) have a training plan that specifies the type and level of training
required for the coming year. Three in ten (28%) establishments engage in both of these
types of business planning and 44% engage in neither.
Just over three quarters of establishments have funded or arranged training for their
employees (77%) and 65% of establishments had done so in the 12 months prior to the
survey.
The use of informal training practices is more common, and pursued by more than 9 in 10
establishments. Around four in five use supervision structures to develop the skills of their
employees, with a similar proportion offering opportunities for staff to spend time learning
through watching others and/or allowing staff to perform tasks that go beyond their strict
job role and then provided them with feedback on performance.
Barriers to training are far less commonly related to the (perceived) benefits of training
and more likely to relate to the “costs” of providing training (in the broadest sense, not
only financially). More than six in ten establishments (62%) reported disruption of work
patterns and over half reported financial cost to be barriers to investing in training.
Just under three quarters of establishments (72%) felt that they were confident about
knowing where to go outside of their organisation for help and advice on skills and
training issues, with educational institutions and/or industry bodies the most likely to be
approached for advice.
High Performance Working Practices
Three in ten establishments (30%) can be classified as engaging in high performance
working practices (HPWP) in that they engage in at least 10 of the 16 measures explored.
These establishments tend to be larger and are far more likely to operate within the public
sector than the private. There has been little change in the proportion of High
Performance Working Practice employers over time.
Considering the practices within the framework of a well recognised model of good
employee practice
1, practices associated with the development of employees’ abilities are
the most common (and are increasingly common), with those associated with deployment
(developing the attitude of the workforce and the application of skills) considerably less
common, and in a slower period of growth.
Larger employers and/or those in the public sector are most likely to adopt most of the
high performance working practices. The exceptions are in the area of application. In
particular, private sector establishments are more likely than public sector ones to reward
employees in relation to overall company performance and/or individual performance.
There is also less of a correlation between size of establishment and the propensity to
adopt these reward and remuneration strategies than there is with the other practices.
Vocational Qualifications
NVQs/SVQs are the best known vocational qualification among business establishments.
However, beyond NVQs/SVQs top of mind awareness of VQs is quite low and
fragmented; two in five employers (40%) are unable to name a vocational qualification on
a spontaneous basis. Almost all establishments recognise VQs when prompted.
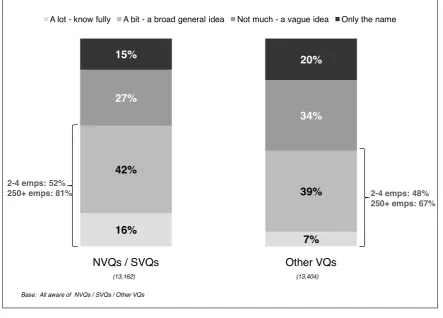
A high level of awareness of NVQs is supported by a relatively deep level of knowledge.
Three in five employers who have heard of NVQs/SVQs state that they have at least a
broad general idea of what they are (compared to just under half - 46% - for other VQs).
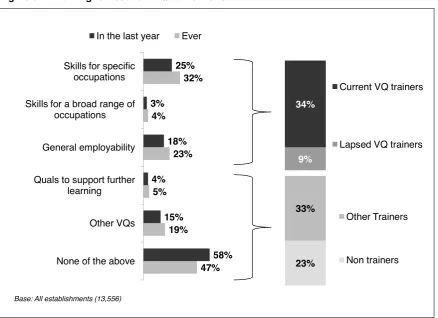
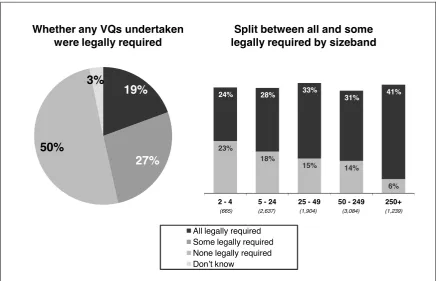
A third of employers currently (34%) train to VQs, with around a further one in ten (9%)
having done so in the past but not over the last 12 months. Legislative requirements play
a role in bringing establishments to training. A fifth (19%) of VQ trainers has trained to
VQs
only
when there was a legislative requirement to do so and just over a quarter (27%)
had trained to VQs in
some
cases because they were required to do so by law. However,
half of those who had trained staff to a vocational qualification had done so without being
required to by law.
Those employers who are not investing in VQs perceive a range of barriers to doing so.
The most commonly given reason was that staff do not want this type of training
(mentioned by 38%) but other reasons given by similar proportions of employers
focussed around a lack of knowledge about VQs, the cost, the bureaucracy involved and
the length of time that they take to complete.
Perceptions of Sector Skills Councils
Three in ten establishments covered by a Sector Skills Council (SSC) are aware of this
SSC; this is slightly up on 2005. Larger establishments and those in the public sector are
most likely to be aware of their SSC.
SSCs are most commonly associated, in employers’ minds, with
running training courses
for their sector’s employees
and the most common reasons for having had dealings with
an SSC were, as in previous years, to do with training (71%).
The proportion of establishments who have had dealings with their SSC has increased
from 2005 to 2007. The vast majority (54%) of those who had had dealings with the SSC
made contact
occasionally
– every 6 months.
After having remained relatively static between 2004 and 2005, engagement with SSCs
has increased over the last two years (from 14% of aware employers in 2005 to 20% in
2007).
The majority (67%) of establishments reported that they were satisfied with the dealings
they had had with their own SSC in the 12 months to the survey date. The majority of
establishments with an awareness of their own SSC reported that this contact had had
some positive impact on skills development in their sector (59%), rising to 80% of those
who had dealings with their SSC. Half of those which had dealings with their SSC (52%)
reported that it resulted in some change in the way they approached skills development.
Conclusion
1
Introduction and survey methodology
This report provides analysis from a major survey of employers across the UK, exploring
their experiences and perceptions of key aspects of the skills system across the UK. This
is an important platform of evidence for the newly formed UK Commission for
Employment and Skills in delivering its remit to raise UK prosperity and opportunity by
improving employment and skills. In this section we provide background information to
the UK Commission for Employment and Skills and the survey methodology.
1.1
UK Commission for Employment and Skills
The UK Commission for Employment and Skills is a key recommendation in Lord Leitch’s
2006 ‘Prosperity for All in the Global Economy’ (HMT 2006). This important review of the
skill levels and demand for skills in the UK identified that the UK needed to enhance its
level of skills, not just absolute levels but also relative to other countries in the OECD. Its
key principles included:
•
Shared responsibility between employers, individuals and the state for action on,
and investment in, skills;
•
A focus on economically valuable skills which deliver real returns for individuals,
employers and society;
Launched on 1st April 2008, the UK Commission is, then, an employer-led organisation,
with Commissioners drawn from the highest levels of private, public and voluntary
sectors, supported by trade union leadership. The UK Commission will strengthen the
employer voice, provide greater employer influence over the employment and skills
systems and promote employer investment in people. This survey of employers provides
an important first assessment of employer perceptions of the skills system in particular
and of their investment in the skills of their employees.
The survey of 13,500 employing business establishments across the UK provides
evidence on a range of issues of importance to the UK Commission: the skills challenges
employers face; how they respond to these issues through training practices; their use of
and attitudes towards vocational qualifications (VQs); the organisational practices they
adopt which can help them absorb skills and training and how they view Sector Skills
Councils (SSCs), which form a key part of the demand-led skills systems.
Commissioned by the Sector Skills Development Agency (SSDA) in 2007, the survey
provides a vital platform of intelligence for the UK Commission to develop further as it
seeks to fulfil its remit. It builds on previous surveys commissioned by the SSDA,
comparative analysis from these are included in the report.
1.2
Methodology
Further details on the survey method are provided in the Annexes. This section provides
a summary of the approach.
Telephone contact details for the employers sampled were sourced from the Experian
Business Database, which has been found to be the most comprehensive source of
establishment-level sample with telephone numbers. Given this database is of
businesses
it has more patchy coverage of public sector establishments, and therefore
sample for such establishments was sourced from the IDBR database, with telephone
numbers appended by UK Changes.
As the survey was commissioned by the SSDA, it was also designed to provide data for
sectors as defined by the footprint of the SSC sectors. Quotas were set for 500 interviews
to be achieved with employers under the footprints of each of the 25 SSC sectors, with an
additional quota of 1,000 interviews shared evenly between two groups of establishments
not covered by SSCs.
Within each SSC sector, interviews were distributed by size based on a modified
Probability Proportionate to Size (PPS) approach using population figures from ONS
(IDBR). In addition, a “rim” quota for nation within the UK was overlaid on the SSC sector
by sizeband matrix. These national “rim” quotas ensured large enough base sizes in each
constituent nation within the UK to allow analysis at the national level. This is necessary,
in part, because skills policy is devolved to the UK nations and there is a need to have a
clear understanding of whether and how employers’ perceptions and experiences differ
across different parts of the UK.
Final data were grossed to reflect the total business population of establishments with 2+
employment using a sub-sector by sizeband grid for each SSC (using the same
population figures from the IDBR). Over the top of these cell weights, a rim weight for
country by SSC was imposed to correct for the over-sampling of Scotland, Wales and
Northern Ireland within the survey design.
2
Skills Challenges
Chapter Summary
•
Skills related problems recruiting staff continue to pose an important challenge for
employers, although the challenge is one that has been decreasing over the last few
years. Around half of establishments (52%) reported experiencing difficulty in
recruiting staff with the required skills, compared to 57% in 2005 and 62% in 2003.
•
Half of establishments reported that the education system does not supply enough
people equipped with the skills needed when starting a job. This figure has changed
little over the last five years.
•
Retaining valued staff poses a significant problem for three in ten establishments.
•
Nearly two fifths (37%) of all establishments agreed both that they have problems
with recruiting and that the education system was part of the problem in that it
doesn’t supply people equipped with the skills they need to start work. Only 16% of
establishments agreed that they had skill related recruitment difficulties but did not
agree that the supply of skills from the education system was also a challenge for
them. A similar proportion of establishments, 13%, had concerns about recruits from
the education system, but they did not also report recruitment difficulties. A third
(34%) considered neither to be a problem.
Employers face a wide variety of challenges and problems, and this section considers
some of these problems which relate to skill levels within the workforce. The Leitch
Review argues that the nature of demographic, technological and global change
increases competitive pressures on all sectors of the economy. Government policy is that
one of the means to remain competitive is by increasing the skills of the workforce. In light
of this wider context, we examine employer’s perceptions of the challenges of recruiting
employees with the right skills; the ability of the education system to supply potential
employees with the right skills; and the difficulties in retaining valued staff.
2.1
Recruitment difficulties
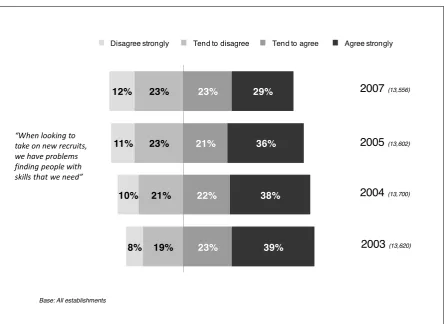
The proportion of employers having difficulty recruiting staff with the skills they require
[image:18.595.80.526.220.544.2]has continued to decline over the past five years and has fallen by 10 percentage points
from 2003 to 2007, from 62% to 52%. Interestingly, the proportion of employers who
tend
to agree
that finding suitably skilled staff is a problem has been stable through previous
waves, with the proportion who strongly agree with the statement accounting for all of the
drop of 10 percentage points. The proportion who report that they do
not
have problems
in recruiting suitably skilled staff has risen from 27% in 2003 to 35% in 2007.
Figure 2.1: Recruiting staff with the skills needed
19% 21% 23% 23%
8% 10% 11% 12%
23% 22% 21% 23%
39% 38% 36% 29%
Disagree strongly Tend to disagree Tend to agree Agree strongly
2004
(13,700)2003
(13,620)2007
(13,556)2005
(13,602) “When looking totake on new recruits, we have problems finding people with skills that we need”
Base: All establishments
Difficulties finding suitably skilled new recruits were less of a problem for larger
establishments than for smaller ones. Larger establishments were less likely than smaller
establishments to agree that they have difficulty in recruiting people with the right skills:
only 33% of those with 250 or more employees reported this problem compared to 54%
of those with 2 to 4 employees.
Employers in England were less likely than those elsewhere in the UK to describe
problems recruiting suitably skilled staff. In Wales, Northern Ireland and Scotland 64%,
Private sector establishments were more likely to agree they have difficulties with
recruitment due to skills issues than public sector establishments. Just over half of private
sector establishments (54%) agreed they have difficulty compared to 40% of public sector
establishments and 46% of voluntary sector establishments.
2.2
Education System Skills Supply
One source of new recruits available to employers is the pool of (young) people leaving
education. The National Employer Skills Survey (NESS) 2007 reported that in England
over a quarter of establishments (27%) consider that new labour market entrants at 16
were poorly prepared for work, 21% that 17 to 18 year old new labour market entrants
were poorly prepared and 10% that HE graduates were (LSC, 2008). This pattern was
mirrored in Skills in Scotland 2006 where 34% of ‘school leavers’, 20% of ‘FE leavers’
and 13% of ‘HE graduates’ were considered unprepared for work
2(FSS, 2006).
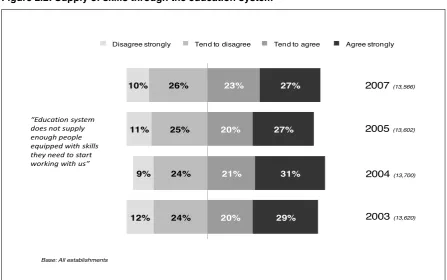
Figure 2.2: Supply of skills through the education system
24% 24% 25% 26%
12% 9% 11% 10%
20% 21% 20% 23%
29% 31% 27%
27%
Disagree strongly Tend to disagree Tend to agree Agree strongly
2005(13,602)
2004(13,700)
2003(13,620) 2007(13,566)
“Education system does not supply enough people equipped with skills they need to start working with us”
Base: All establishments
Just as smaller employers were more likely to face difficulties sourcing suitably skilled
new recruits, they were also more likely to find the education system lacking in its
provision of suitably skilled new entrants to the labour market. Just under half (47%) of
the largest establishments (with 250 or more employees) disagreed compared to 28% of
the smallest establishments (with between 2 and 4 staff).
Again, private sector establishments (52%) were more likely to agree than public sector
(38%) or voluntary sector (41%) establishments.
A different pattern than was evident with general recruitment difficulties emerges,
however, when the different countries of the UK are analysed separately. Whilst England
stood out in terms of general skill related recruitment difficulties, establishments in Wales
did so in terms of the proportion agreeing that the education system does not supply
In overall terms, across the UK, nearly two fifths (37%) of all establishments agreed both
that they had problems with recruiting
and
that the education system was part or the
problem (that is, they agreed to both statements). Only 16% of establishments had
recruitment difficulties but did not see the supply of skilled recruits out of education as
inadequate. Slightly fewer (13%) had reservations about the calibre of recruits out of the
education system, but had not themselves experienced difficulties in recruiting. A third of
establishments (34%) considered neither to be a problem – that is they had no difficulties
recruiting suitably skilled recruits nor did they question the calibre of new recruits leaving
education into their first full-time job.
2.3
Retention – Retaining Valued Staff
Skills challenges are faced internally as well as when recruiting. The employer skills
surveys carried out in each of the countries of the UK over the last few years have
consistently shown that a key cause of establishments having skill gaps is where staff are
new or inexperienced (in NESS 2007 68% of establishments with skills gaps reported this
as a cause of at least some of these gaps, compared to only 28% for the next most
important reason). It follows that where there is a high turnover of staff an establishment
is more likely to have skills challenges / gaps and face high recruitment and vacancy
costs. The CIPD Annual Survey Report
Recruitment, Retention and Turnover
shows that
70% of establishments highlight the loss of staff as having a negative impact on business
performance and suggests an average cost of filling a single vacancy of £4,667 and as
much as £5,800 when associated labour turnover costs are included) (CIPD, 2008).
It is interesting therefore to consider the extent to which employers experience difficulties
holding on to (skilled) staff. All employers were asked the extent to which they agreed or
disagreed that holding onto valued staff presented them with a significant problem. Whilst
the majority of establishments (63%) do not report difficulties in holding onto valued staff,
a significant proportion (28%) do report that the retention of valued staff poses a problem.
(This question was not asked in previous waves of this research.)
Surprisingly, and contrary to the problems employers experience in relation to the
external supply of skilled labour, there was no clear relationship between problems
retaining valued staff and size of establishment. Rather the extent to which employers
agreed or disagreed that holding on to valued staff posed them a significant problem was
fairly consistent across all sizes of establishments.
The more problems an employer experiences in terms of external skills shortages (that is,
recruitment difficulties and problems with the education system), the more likely they are
to report difficulties retaining valued staff. Just over a third of employers (37%) reported
both difficulties recruiting staff and deficiencies in new recruits coming out of the
education system, and two fifths of these (42%) also had problems retaining valued staff
– 14 percentage points higher than the national average of 28%. By contrast, only 14% of
employers who experienced neither of the external skills challenges agreed that they had
problems retaining valued staff.
In conclusion, combined with evidence from other sources, this brief picture suggests
decreasing, although in some cases, persistent skill difficulties faced by employers. The
combination of difficulties is also of note, since it suggests more entrenched problems for
some employers. The following chapter will now go on to consider employer training
3
Training
Chapter Summary
•
Just over one third (36%) of establishments have a budget for training expenditure
and just under half (48%) reported having a training plan that specifies the type and
level of training required for the coming year. Three in ten (28%) establishments
engaged in both of these types of business planning and 44% had engaged in
neither.
•
The use of specific budgets for training expenditure and of training plans is strongly
dependent on establishment size.
•
Just over three quarters of establishments have funded or arranged training for their
employees (77%) and 65% of establishments had done so in the 12 months prior to
the survey.
•
The use of informal training practices was more common, with around four in five
establishments reporting that they used supervision structures to develop the skills
of their employees, offered opportunities for staff to spend time learning through
watching others and allowed staff to perform tasks that go beyond their strict job role
and then provided them with feedback on performance.
•
More than six in ten establishments (62%) reported disruption of work patterns and
over half reported financial cost to be barriers to investing in training.
•
Just under three quarters of establishments (72%) felt that they were confident
about knowing where to go outside of their organisation for help and advice on skills
and training issues.
•
In terms of awareness of organisations to approach for training and skills advice,
educational institutions and professional and/or industry bodies were the most
frequently cited by employers.
The survey seeks to measure training and workforce development activity amongst
employers to gain an understanding of employers’ response to training needs amongst
3.1
Training Planning and Budgets
Employers were asked whether they had a training plan which specified in advance what
training employees would receive, and whether there was a site-specific budget for
training expenditure.
Around half of establishments had a training plan which specified in advance the type and
level of training required for the coming year, although only a third had a budget allocated
for this training. Training planning has been steadily increasing over the last 4 years or
so, with a particularly large increase over the last two years; budgeting for training is at a
similar level to 2005 when it jumped considerably from previously recorded levels (see
Figure 3.1).
Figure 3.1: Training budgets and training plans, UK, 2003 – 2007
30%
39%
30%
40% 37%
42% 36%
48%
Has site-specific budget for training expenditure Has training plan specifying type and level of training required for coming year
2003
2004
2005
2007
(13,620) (13,700) (13,602) (13,556)
Base: All establishments
The larger the establishment the more likely it was that it had a training plan and/or a
budget for training (Figure 3.2). Only one quarter (24%) of the smallest establishments
(those with 2 to 4 employees) had specific budgets for training, but this figure rises such
that 90% of establishments with 250+ employees have one. A similar pattern is apparent
Figure 3.2: Training budgets and training plans by establishment size, UK, 2007
24%
35% 44%
59% 65%
74%
77% 80%
90% 88%
Has site-specific budget for training expenditure Has training plan specifying type and level of training required for coming year
2 to 4 5 to 24 25 to 49 50 to 249 250+
(1,672) (4,296) (2,517) (3,689) (1,382)
Base: All establishments
There is little difference in the extent of planning and budgeting for training across the
countries of the UK.
There is a higher than average propensity to set budgets and plans for training in the
public sector Four fifths (81%) of establishments in the public sector have training
budgets with the same number having training plans, compared to 30% and 44%
respectively for the private sector and 59% and 61% in the voluntary sector.
Figure 3.3 shows the proportion of establishments who had a training plan and the
proportion that did not. It then shows what proportion of those who had a training plan
also had a training budget (on the left-hand branch), and then, on the right-hand branch,
Figure 3.3: Correlation between training plans and training budgets, 2007
Training Plan
Training
budget
58%
Yes
42%
No
48%
Yes
15%
Yes
85%
No
52%
No
Training
budget
28%
20%
8%
44%
Proportion of all establishments
Base: All establishments (13,556)
Overall, almost three in ten establishments (28%) have both a training plan in place and a
ring-fenced budget for funding this training. On the other hand, one in five establishments
have a training plan but no specific budget set aside to meet the cost of the plan. This
could therefore compromise these employers’ ability to undertake all the intended
training. Or alternatively, it could point to these employers’ training plans being less
detailed and specific, and more likely to fall foul of changing circumstances or needs.
The most common scenario is the one where an establishment neither has a training plan
nor budget (44%). As one would expect, relatively few establishments have a training
budget but no accompanying plan outlining how it is to be spent – although one in 12
establishments fall into this category.
3.2
Training Levels
Two thirds (65%) of establishments in the UK had funded or arranged
any
training for any
employees in the 12 months leading up to the survey. This figure has remained fairly
stable across the years although there has been a drop of 4 percentage points since
As with the use of budgets for training and the use of training plans, the likelihood of
funding or arranging training rises with establishment size; whilst only half of the smallest
establishments (with 2 to 4 employees) provided training for staff, four fifths of
establishments with 5 to 24 employees funded or arranged training, as did over 90% of
those with 25 employees or more. Again, this pattern has changed little over time.
Within the UK, establishments in Northern Ireland (59%) are less likely to have funded or
arranged training for their employees in the last 12 months, and establishments in Wales
(69%) are comparatively more likely. This pattern is also consistent over time and mirrors
what has been seen in employer skills surveys conducted across the four countries of the
UK.
Nearly nine in ten public sector establishments in the UK (89%) arranged or funded
training compared to 79% of those within the voluntary sector and only 62% of those
within the private sector.
One in eight establishments had not funded or arranged training in the previous 12
months (12%) but had done so in the more distant past. The remaining quarter of
establishments (23%) had never funded or arranged training.
Figure 3.4 details the profile of training establishments (current trainers), ‘lapsed’ trainers
(i.e. which have trained in the more distant past but not in the last 12 months) and non
trainers by size and compares these profiles to the overall size distribution of
establishments across the UK. This highlights that the vast majority of non-trainers (82%)
are small establishments with fewer than 5 employees (compared to only around a half in
the UK as a whole). It also shows that lapsed trainers most closely represent the size
profile of UK establishments, although slightly fewer of them are in the largest size bands.
Figure 3.4: Training status by size of establishment
82%
58%
41%
53%
17%
36%
44%
36%
1%
3%
8%
6%
1%
2%
6%
4%
1%
1%
Non-trainer
Lapsed
trainer
Current
trainer
Total
2-4
5-24
25-49
50-249
250+
(13,556)
(11,312)
(1,113)
(1,342)
Base: All establishments
We look at other differences between current, lapsed and non-trainers in section 3.3 and
3.4.
3.3
Informal Training Practices
As well as formal training practices, establishments have other more informal methods at
their disposal to help their staff develop skills and capabilities. As such, only considering
formal training provides a somewhat restricted picture of the training landscape in the UK
economy. It is important, therefore, to examine the role of informal training and
supervision amongst employers. To this end employers were asked whether they used
any of the following methods/approaches to develop their employees’ skills:
•
Supervision structures to ensure employees are guided through their job role
over time
•
Opportunities for staff to spend time learning through watching other staff
members perform their job role
All of these informal practices are relatively common, with around four in five
establishments adopting each of them - 83% provide opportunities for work-shadowing,
80% allow to staff to perform tasks beyond their job role, and 78% provide supervision
structures, and only 8% adopt do not adopt any of these practices (see Figure 3.5).
Figure 3.5: Use of informal training practices
68% 72% 69%
78%
74%
69% 78%
83%
80%
Supervision structures Work shadowing Performing tasks beyond job rob
2004
2005
2007
(13,700) (13,602) (13,556)
Base: All establishments
The use of supervision structures has remained constant since the last survey in 2005,
while there have been considerable increases in the use of work shadowing and of
allowing staff to ‘act up’ (beyond their strict job role) and then providing feedback on their
performance.
Smaller employers are considerably less likely than larger employers to adopt any of the
informal training practices, although there is evidence that all of the practices are gaining
currency with smaller employers at a faster rate than among larger employers.
Overall, three in ten establishments (29%) use these informal training practices but do not
fund or arrange formal training. Only 6 per cent of establishments provide neither formal
nor informal training opportunities.
Figure 3.6: Relationship between formal and informal training practices
3% 7%
20%
27%
38%
32% 71%
54% 48%
Current Trainers Lapsed Trainers Non-Trainers
All
Some
None
Base: All establishments
(11,312) (1,113) (1,342)
Interestingly, establishments who provide formal training are more likely to adopt these
informal practices, and those who have never funded or arranged formal training are least
likely to adopt informal training practices. That is, informal training practices are adopted
3.4
Barriers to Training
All employers were asked what barriers they felt prevented them from funding or
arranging (more) training for their employees. The list adopted in the survey reflects, as
far as possible in a survey like this, market imperfections and failures which are
commonly reported in the literature. They range from micro barriers that deter
organisations from investing in training, to information failure and to consideration of
potential policy imperfection in terms of the supply of training.
Figure 3.7: Barriers to (further) training
10%
23% 24%
31% 37%
38% 41%
46% 56%
62%
Training not delivered in the past Formal training not best way to develop skills Previous training less beneficial than hoped Concern that acquisition of new skills leads to
higher wage demands
Reluctance of staff Lack of suitable training provision Concern that will make staff susceptible to
'poaching'
Lack of knowledge about range of provision available
Financial cost Disruption to work patterns
All establishments
Base: All establishments (13,556)
Figure 3.7 shows that micro barriers are dominant in the survey, with disruption to work
patterns and the financial cost of training being the principal barriers (reported as
potential barriers by 62% and 56% of establishments respectively). Such barriers suggest
a short-term approach where decisions taken about training potentially downplay the
longer term benefits. Businesses may be especially focussed in this way in uncertain
economic and labour market circumstances (Keep, 2006). The next most commonly cited
barrier (acknowledged by almost half of establishments) is a lack of knowledge about the
range of provision available, suggesting employers may be keen to know more about
A concern that training will lead to poaching of trained staff from competitors is cited by
41% of all establishments. It is worth noting that this is phrased as a ‘concern’ rather
than an experience, as it is the fear of poaching which is often cited as a barrier to
training.
The findings here suggest it remains a real concern of employers, despite
evidence that training actually improves staff retention.
3This is much less likely to be
cited by establishments in the public sector (18%) than in the voluntary (33%) or private
sectors (44%).
The lack of availability of suitable training was cited as a barrier by 38% of establishments
and whilst public sector establishments were again less likely to cite this than private
sector establishments, the contrast is less stark than for poaching (33% compared to
39%). For many establishments this may be closely associated with location, especially
for those who source training locally, and this warrants further investigation. This barrier
is more prevalent in Northern Ireland where 49% of establishments report lack of suitable
training provision as a barrier to training.
Just behind supply issues is a barrier associated with the reluctance of staff to train (37%
of establishments). This is more commonly cited amongst public sector establishments.
We will return to this issue, which is more important as a barrier to VQ training, in
section 6.
Around a quarter (24%) of establishments report that training has not delivered expected
results in the past and that this deters them from training. A similar proportion considered
that formal training is not the best way to develop skills (23%). Just 10% say that they
have never provided training before. This was much more prevalent amongst the smallest
establishments.
All barriers to training were most prevalent amongst the smallest establishments (with two
to four employees) with the likelihood of each factor being a barrier trailing off as the size
of the establishment increases. There are two exceptions to this: the proportion of
establishments which considered the reluctance of staff to take up training opportunities
Whilst employers in the private sector were generally more likely to perceive barriers than
those in the public or voluntary sectors, there were exceptions. For example, the financial
cost of training is most likely to be reported as a barrier by voluntary sector organisations
and least likely by establishments in the private sector (voluntary sector 79%; private
sector 54%; and public sector 62%). Furthermore, public sector establishments were
more likely to say that staff were reluctant to be trained (42%) than private sector
establishments (37%).
Figure 3.8 seeks to shed further light on these barriers by assessing the extent to which
they are more or less likely to be reported by establishments which currently train as
opposed to those which have trained in the past but not now (lapsed trainers) or those
which do not and have never trained (non trainers).
Figure 3.8: Barriers to (further) training by training status
28% 31% 24% 43% 34% 40% 46% 52% 63% 67% 28% 28% 28% 42% 41% 49% 50% 57% 71% 19% 23% 26% 38% 37% 38% 43% 54% 59%
Training not delivered in the past Formal training not best way to develop skills Previous training less beneficial than hoped Concern that acquisition of new skills leads to higher
wage demands
Reluctance of staff Lack of suitable training provision Concern that will make staff susceptible to 'poaching' Lack of knowledge about range of provision
available
Financial cost Disruption to work patterns
Current Trainers Lapsed Trainers Non-trainers
(11,312) (1, 113) (1,342)
Base: All establishments
The hierarchy of barriers is fairly consistent whatever the training status of the employer,
and for all three groups the order of the four main barriers is broadly the same, with the
majority of employers agreeing that the disruption that training causes to work patterns
Current trainers are generally less likely to cite all of the barriers than lapsed or
non-trainers. The exception to this is that non-trainers are least likely to cite the reluctance of
staff as a barrier – that is, those employers who have experience of training staff are
more likely to perceive that (some) employees are resistant to training.
Non-trainers are particularly likely to cite the financial costs of training and concerns that
training might lead to higher wage demands as a barrier to their funding or arranging
training. Lapsed trainers are more likely to cite disruption to work patterns as a barrier.
As many as 23% of current trainers state that the training they have delivered in the past
has not delivered the benefits they expected, a high proportion if compared to the 28% of
lapsed trainers who give this reason as a barrier to training.
Similarly, one in five current trainers (19%) believes formal training is not the best way to
develop skills, with this belief inhibiting the provision of further training to staff. This barrier
was cited by 28% of lapsed trainers and 31% of non-trainers.
3.5
Access to Help and Advice
As we have seen, lack of knowledge about available provision is an important barrier to
employers funding or arranging (more) training for their employees. To address these
information difficulties a number of organisations seek to provide advice to employers
about their skills and training options. The survey also explored how confident employers
were about whom to approach (outside of their organisation) to access help and advice
on skills and training related issues, as well as which organisation(s) they would
approach for advice and help and their overall (unprompted) awareness of business
support organisations.
Figure 3.9: Confidence in knowing whom to approach for information or advice by size of establishment
10% 17% 43% 29% Very
confident
Fairly confident
Not very confident
Not at all
confident 12% 10%
5% 5% 3%
19%
16%
13% 12%
9%
43%
42%
47% 47%
48% 26%
31% 34% 35%
40%
Overall UK 2 - 4 5 to 24 25 to 49 50 to 249 250+
Base: All establishments
(13,556) (1,672) (4,296) (2,517) (3,689) (1,382)
Just short of three quarters of establishments (72%) felt that they were confident (either
fairly or very) about knowing where to go outside of their organisation for help and advice
on skills and training issues. This has risen slightly from 67% in 2003 through to 72% in
2007. Confidence in knowing where to go for help and advice rises with establishment
size from 69% amongst the smallest establishments (2 to 4 employees) to 88% amongst
the largest (250 or more employees).
There was some difference within the constituent nations of the UK, with establishments
in Northern Ireland being most confident of whom to approach (78%) and those in Wales
being the least likely (68%).
Those in the private sector were least likely to feel confident (70%), with public sector
3.5.1
Organisations that establishments approach for information
or advice
Those establishments who had some idea of who to approach
4were asked to list,
unprompted, those organisations they would approach for help and advice on training.
Please note that these results should be treated with some caution, as they compare
individual, specific organisations such as the Learning and Skills Council (LSC), SSC and
Business Link as well as
types
of organisation, such as educational institutions. Results
[image:36.595.79.516.231.565.2]are shown in Figure 3.10.
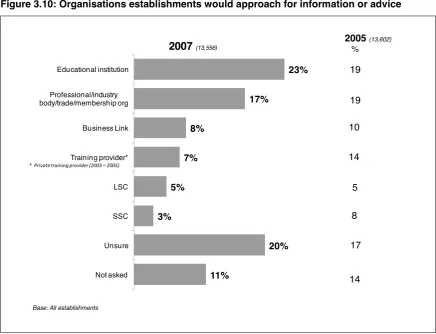
Figure 3.10: Organisations establishments would approach for information or advice
11%
20% 3%
5% 7%
8%
17%
23%
Not asked Unsure SSC LSC Training provider* Business Link Professional/industry body/trade/membership org
Educational institution
2007
(13,556)2005(13,602) %
Base: All establishments
* Private training provider (2003 – 2005)
19
19
10
14
5
8
17
14
The two most frequently cited ‘organisations’ were educational institutions and
professional and/or industry bodies reported by 23% and 17% of all establishments
respectively. These have also been the most widely mentioned in previous waves of
research. No other organisations or types of organisation were mentioned by more than
8% of respondents, and only 3 were mentioned by 5% or more: Business Link (8%), a
One fifth were unsure what organisation they would approach, despite saying they had
some confidence in knowing who to approach
5. If these are combined with those who
were not asked the question because they had already said that they were not at all
confident they would know whom to approach, this gives around a third of establishments
who would have little or no idea which organisations to turn to for help on training issues.
3.5.2
Overall awareness of business support organisations
As well as ascertaining which organisations or types of organisation employers would
approach, all employers were asked to list, again unprompted, all those organisations
that they were aware of that provided help and advice on skills or training-related issues,
regardless of whether or not they would approach them. Again, these results should be
treated with some caution, as they compare individual, specific organisations such as the
Learning and Skills Council (LSC), SSC and Business Link as well as
types
of
organisation, such as educational institutions. Results are shown in Figure 3.11 overleaf.
Again, educational institutions were the most frequently cited type of organisation and
were mentioned by just under one third of establishments. Professional and/or industry
bodies were the next most frequently cited organisation, mentioned by 22% of
Figure 3.11: Overall awareness of business support organisations
22% 3%
4% 5%
8% 12%
13%
22%
32%
Unsure Government departments Chamber of Commerce SSC LSC Business Link Training provider* Professional/industry body/trade/membership org
Educational institution
2007
(13,556)2005(13,602) %
Base: All establishments
* Private training provider (2003 – 2005)
27
25
21
6
8
6
22 13
6
In conclusion, the evidence in this chapter has shown that most employers are adopting
practices to develop the skills of their workforce, whether formally or informally, and that
there appears to be increasing prevalence of informal practices in particular. There is also
increasing sophistication of planning for training (setting budgets and developing plans).
Progress appears to have been made as to the benefits of training. Relatively few
employers cite a belief that (formal) training is not the best way to develop skills or that
past training has not delivered the required outcomes as barriers to providing (more)
training, compared to the proportion who see barriers in the logistics of providing training
and in the implications for the smooth running (and running costs) of the business. But
4
High Performance Working Practices
Chapter Summary
•
30% of establishments can be classified as engaging in high performance working
practices (HPWP). These establishments are far less likely to be very small in terms
of numbers employed than the average and are far more likely to operate within the
public sector than the private. There has been little change in the proportion of High
Performance Working Practice employers over time.
•
Considering the practices within the framework of Tamkin’s 4 A’s model, employers
are most likely to adopt practices associated with the development of employees’
abilities, with most employers doing something in the domain. It is far less common
for employers to adopt the practices focused on attitude and application.
•
Employers are increasingly likely to adopt practices designed to develop ability
within their workforce, but there has been less change in the adoption of practices
focused on the deployment of this ability and these attitudes.
•
Larger employers and/or those in the public sector are most likely to adopt most of
the high performance working practices. The exceptions are in the area of
application. In particular, private sector establishments are more likely than public
sector ones to reward employees in relation to overall company performance and/or
individual performance. There is also less of a correlation between size of
establishment and the propensity to adopt these reward and remuneration strategies
than there is with the other practices.
•
Seven in ten establishments (69%) agree that their HR strategy is closely linked with
their overall business strategy with this statement and one fifth disagree. This has
changed little since the last survey.
4.1
Introduction
This chapter examines the organisational practices employers adopt to help them absorb
training and skills amongst their workforce, referred to as High Performance Working
Practices (HPWP). The “obvious” practices are training (formal and informal) and
planning for training which we looked at in the previous chapter. Here we return to these
Training plan Business Plan
Training budget Creates teams to work on projects
Training needs assessment Individual Performance Related Pay
Conduct staff appraisals Flexible benefits
Formally assess performance Accredited IIP
Conducted training in past 12 months Accredited ISO 9000
Work shadowing / stretching / supervision Performance bonuses
Employee consultation Consults with trade unions
4.2
High Performance Working Practices (HPWP)
Figure 4.1 shows the proportion of all establishments which adopt each of the 16 high
performance working practices measured in the survey.
Figure 4.1: HPWP amongst all establishments
13% 15% 15% 19%
32% 36%
39% 41%
47% 48%
59% 61%
62% 65%
74%
92%
Accredited ISO 9000 Consults with trade unions Creates teams to work on projects Accredited IIP Flexible benefits
Training budget Individual PRP Performance bonuses Employee consultation Training plan Formally assess performance Training needs assessments Business planning Conducted training in past 12 months Conduct staff appraisals Work shadowing/stretching/supervision
As we have already seen, the vast majority of establishments offer at least one of the
informal training practices (work shadowing, “stretching” or supervision structures) and
this is by far and away the most common are of High Performance Working Practice, with
92% of all establishments adopting it. A very large majority (also) conduct appraisals of
their staff (74%), and these are considerably more common than (formal) training, which
as we have already seen is something that around two-thirds of establishments have
funded or arranged in the recent past (65%). Slightly fewer – but still a comfortable
majority – have a business plan (62%), and/or conduct training needs assessments
and/or formally assess the performance of staff (59%).
Below these practices, which are pursued by the majority of establishments, “planning for
training” and “consulting with employees” are adopted by around a half of establishments.
The remainder of the practices fall into two groups:
•
Between a third and two fifths of establishments employ performance bonuses,
individual performance related pay, the setting of a training budget and/or the offer
of flexible benefits;
•
Less commonly, between one in twelve and on in five have IiP accreditation, create
teams to work on specific projects, consult with trade unions and/or have achieved
ISO 9000 accreditation, making these minority High Performance Working
Practices.
To assess the extent to which establishments can generally be thought of as adopting
high performance working practices, a measure of any 10 of the 16 is taken. The logic
here is that it is not always appropriate for businesses of all size and in all sectors to be
adopting all of the practices, and so an assessment has been made that 10 would be a
reasonable benchmark measure to signify those closer to high performance working
practices. Three in ten establishments (30%) can be classified as engaging in HPWP
using this measure, in line with the survey findings in previous years.
Establishments adopting 10 or more of the identified working practices are far less likely
to be very small in terms of numbers employed than the average. Just 14% of those with
2-4 employees adopt at least 10 of 16 HPWP measures compared to 90% of the largest
Figure 4.2: Establishments with 10 or more HPWP by establishment size
30%
14%
41%
64%
76%
90%
Overall UK 2-4 5-24 25-49 50-249 250+
(13,566) (1,672) (4,296) (2,517) (3,689) (1,382)
Base: All establishments
Public sector establishments are most likely to adopt HPWP measures. Seven in ten
public sector establishments (71%) are HPWP establishments, compared to only a
quarter of private sector establishments (25%).
Perhaps surprisingly, HPWP establishments are no less likely to have problems in finding
recruits with the correct skills or holding onto valued members of staff than the average
for all establishments (Figure 4.3). That is, adopting high performance working practices
does not alone appear to make it less likely that staff will want to leave or to make it
easier to find new skilled staff. HPWP establishments are – on the other hand - more
likely to disagree that the education system does not provide people with the skills
required on job entry (42% of HPWP compared to 34% of all establishments). It is not
clear from the survey data whether this is because they have lower expectations, or
because they have lower demand for skills because of a greater ability to develop them
Figure 4.3: Relationship between Skills Challenges and HPWP uptake 27% 29% 29% 24% 23% 23% 35% 34% 13% 10% 13% 12% 15% 13% 22% 23% 26% 23% 16% 16% 24% 27% 28% 29%
Disagree strongly Tend to disagree Tend to agree Agree strongly
Base: All establishments
“Education system does not supply enough people equipped with skills they need to start working with us”
“When looking to take on new recruits, we have problems finding people with skills that we need”
“Holding onto valued staff presents us with a significant problem” UK(13,556) 10+ HPWP(7,446) UK(13,556) 10+ HPWP(7,446) UK(13,556) 10+ HPWP(7,446)
4.3
Working Practices and the 4 A’s Model
Having considered the individual measures of high performance working, the analysis
now moves on to consider the 16 working practices in terms of all establishments
surveyed in the context of the 4 A’s model. The 4 A’s model developed by Tamkin (2005)
considers how a range of inputs such as skills, qualifications and training affect human
and organisational capability. The model, shown in Figure 4.4, categorises high
performance working practices around 4 quadrants which are:
•
Access: the effective resourcing of roles in the organisation
•
Ability: the skills of the workforce
•
Attitude: workplace attributes such as the engagement, motivation and morale of the
workforce