Progress for adult literacy learners
Research report
Maxine Burton, Judy Davey, Margaret Lewis, Louise
Ritchie and Greg Brooks
Published by the National Research and Development Centre for Adult Literacy and Numeracy
For information on alternative formats, or to give feedback on the content and accessibility of this publication, please contact:
Publications NRDC
Institute of Education 20 Bedford Way London WC1H 0AL
Telephone: +44 (0)20 7612 6476 Fax: +44 (0)20 7612 6671 Email: publications@nrdc.org.uk
© Crown Copyright 2010
Extracts from this publication may be used or reproduced for non-commercial, research, teaching or training purposes on condition that the source is
Contents
Contributors... 5
Acknowledgements ... 6
Preface: Policy context... 6
Summary ... 6
1. Introduction ... 7
1.1 Context ... 7
1.2 Structure of this report ... 7
1.3 Notes on statistical terms used... 8
2. The research background ... 10
2.1 Phonics ... 10
2.2 Oral reading fluency... 11
2.3 Sentence combining ... 11
2.4 Summary ... 12
3. Method ... 13
3.1 Aims and design ... 13
3.2 Phase 1 – Training of teachers... 13
3.3 Phase 2 – Implementation and evaluation of teaching strategies ... 14
3.4 Phase 3 – Revision of methods and preparation of teaching materials... 16
4. Phonics ... 18
4.1 The providers, learners and teachers ... 18
4.3 How the strategy was implemented... 29
4.4 The search for factors associated with progress ... 35
4.5 Summary ... 36
4.6 Conclusions and discussion ... 37
5. Oral reading fluency ... 38
5.1 The providers, learners and teachers ... 38
5.2 Learnersʼ progress... 41
5.3 How the strategy was implemented... 45
5.4 The search for factors associated with progress ... 50
5.5 Summary ... 51
5.6 Conclusions and discussion ... 51
6. Sentence combining... 53
6.1 The providers, learners and teachers ... 53
6.2 Learnersʼ progress... 55
6.3 Teachersʼ practice ... 59
6.4 The search for factors associated with progress ... 63
6.5 Summary ... 64
6.6 Conclusions and discussion ... 65
7. Summary and recommendations ... 66
7.1 General summary ... 66
7.2 Limitations... 67
PROGRESS FOR ADULT LITERACY LEARNERS
Contributors
Project team, School of Education, University of Sheffield
Dr Maxine Burton: Research Fellow and project director
Judy Davey: Research Associate; lead researcher, sentence combining strand Margaret Lewis: Research Associate; lead researcher, phonics strand
Shirley Riley-Lake: Project Secretary
Louise Ritchie: Research Associate; lead researcher, reading fluency strand Professor Greg Brooks: adviser to the project
Consultants
Yvonne Spare: independent consultant, sentence combining (and additional fieldworker)
Jan Wainwright, Park Lane College, Leeds: reading fluency (and phonics participant)
Janet Whitfield, Warrington Collegiate: phonics
Contributions to the research and to authorship
Maxine Burton directed the project and devised and delivered much of the material for the training days. All members of the team contributed substantially to the training days, in particular:
•
Greg Brooks and Janet Whitfield to phonics, plus a presentation from Frances Woodward, one of the participating teachers•
Jan Wainwright to oral reading fluency, and•
Yvonne Spare to sentence combining.The fieldwork was shared equally by Maxine Burton, Judy Davey, Margaret Lewis and Louise Ritchie.
All team members except Shirley Riley-Lake contributed to the writing of the report. Greg Brooks carried out all the statistical analyses, wrote the spelling analysis in Section 4.2.1 and the commentaries on the statistical findings, and advised throughout on content. Judy Davey wrote Sections 6.2.2–3 and 6.3.2–4; Margaret Lewis wrote sections 4.2.2–3 and 4.3.2–4; and Louise Ritchie wrote sections 5.2.2–3 and 5.3.2–4. The rest of the report was written by Maxine Burton. The following percentage contributions were agreed amongst the team.
Name Research (%) Authorship (%)
Maxine Burton 50 60
Judy Davey 15 10
Margaret Lewis 15 10
Louise Ritchie 15 10
Acknowledgements
We would like to thank all the teachers who participated in the project:
Claudia Mora Astudillo, Community Education Lewisham, London Alison Bagshaw, MATREC, Sheffield
Jenny Baines, Park Lane College, Leeds
June Borrowdale, North Notts College, Worksop Rachael Burrows, The Sheffield College
Anne Gait-Carr, Gloucestershire College Peter Graham, Lincoln College
Laura Kent, York College Julie Kilgar, Doncaster College Neil Hardy, Park Lane College, Leeds Judy Heath, Gloucestershire College Jane Horan, Derbyshire County Council
Emma Hrubiak, Derbyshire Adult Community Education Service Jan Lovatt, Stockport M.B.C.
Eirlys McCann, Wirral Metropolitan College Shabana Mahmood, The Sheffield College Judith Mayer, The Sheffield College
Jan Wainwright, Park Lane College, Leeds Christine Watt, MATREC, Sheffield
Frances Woodward, Bedford County Council
– and all their learners.
Peer review
Preface: Policy context
Since this research was undertaken, the government has committed itself to the ambition of being a world leader in skills by 2020, benchmarked against the upper quartile of OECD1 countries (Leitch 2006). For Skills for Life, this means ensuring that, by 2020, 95 per cent of adults possess at least functional levels of literacy and numeracy – defined as Entry level 3 numeracy and Level 1 literacy.
To make progress towards this ambition, the government has a Public Service Agreement (PSA) target that between 2008 and 2011:
•
597,000 people of working age achieve a first Level 1 or above literacy qualification;•
390,000 people of working age achieve a first Entry level 3 or above numeracy qualification.To deliver this target and in doing so drive progress towards the 2020 ambition, the government published a refreshed Skills for Life strategy in March 2009 (DIUS 2009a). The refreshed strategy focuses on three central themes:
1. Focusing Skills for Life on employability, ensuring that the literacy, language and numeracy skills we help people develop will support them to find, stay and progress in work.
2. Raising demand for literacy, language and particularly numeracy skills among individuals and employers, changing the culture and attitudes to Skills for Life that prevent people from embarking on learning.
3. Delivering flexible and responsive Skills for Life provision which meets learner and employer needs, is high quality, delivered in innovative ways and
embedded in wider skills provision where that is the best way to meet individual learnersʼ needs.
The priority learner groups identified within the overall refreshed strategy are:
•
people who are unemployed and on benefits;•
low-skilled adults in employment;•
offenders in custody and those supervised in the community; and•
other groups at risk of social exclusion.Since this research pre-dates the refreshed Skills for Life strategy, there may be information in this document that relates solely to the original strategy and information which does not reflect more recent developments including those set out in the refreshed Skills for Life strategy.
1
Summary
Headline finding: Adult literacy learners made statistically significant progress in reading comprehension, spelling and writing following the teaching of phonics, oral reading fluency and sentence combining.2
•
The strategies of phonics, oral reading fluency and sentence combining were selected because they had rarely been observed in adult literacy classes in England but research elsewhere suggested they were promising.•
A total of 140 learners, from teenagers to 60+-year-olds, in 23 classes located over a wide area and taught by 20 teachers took part in the project in the autumn term of 2007.•
Most of the learners were within Entry level at the start, but some were at pre-Entry, Level 1 and Level 2.•
The learners made significant gains in reading comprehension (phonics and reading fluency strands), spelling (phonics strand), and writing (sentence combining strand). The gains amounted to between a third and a half of a National Qualifications Framework (NQF) level.•
The progress was achieved in a very short time, on average 5½–6 sessions.•
The confidence of learners in all three strands improved, but this was notcorrelated with their progress in any strand.
•
The only factors found, across the strands, to correlate with progress were high ratings of the teachersʼ general teaching strategies and, for the phonics and sentence combining strands, also regular attendance by learners – a consistent and familiar story.•
All three strands demonstrated a need for relevant accessible schemes with resources adapted for adults.•
The project also demonstrated the value of effective training and support for adult literacy teachers as part of their Continuing Professional Development (CPD).
2
1. Introduction
1.1 Context
This project forms the literacy element of a larger project, ʻImproving the quality of teaching and learning in adult literacy and numeracy, 2007–08ʼ, funded by the Department for Innovation, Universities and Skills (DIUS) through the National Research and Development Centre for Adult Literacy and Numeracy (NRDC). The numeracy element was led by a research team at Kingʼs College London, and their research is described in a separate report (Hodgen et al. 2009). From April 2007 to March 2008 the University of Sheffield conducted the literacy research which features in this report, in order to explore the effectiveness of various teaching strategies with adult learners.
There are currently few established correlations between the specific teaching strategies used in adult literacy classrooms and adult literacy learnersʼ progress. The large-scale NRDC Effective Practice in Reading (Brooks et al. 2007) and Writing (Grief et al. 2007) Studies did identify as effective some generic features of adult literacy teaching, such as the importance of group and pair work in class, regular attendance and self-study between classes (Brooks et al. 2007, p. 32); and the provision of meaningful contexts for writing tasks rather than only decontextualised exercises (Grief et al. 2007, p. 45).
This project was predicated on:
•
The finding from the Effective Practice in Reading Study that various promising teaching strategies were rarely seen in adult literacy classrooms (Brooks et al. 2007, pp. 49–50)•
Findings in the research literature that phonics, oral reading fluency and sentence combining are all strategies that may help learners make progress in their literacy.Because these are strategies which have not often been observed in adult literacy classrooms, the project also incorporated, as a prior element, the development of appropriate methods and materials, and training of teachers in the use of these strategies. Full details of these for the phonics and fluency strands can be found in the associated Practitioner Guide (Burton et al.2008).
1.2 Structure of this report
PROGRESS FOR ADULT LITERACY LEARNERS
Conclusions and recommendations across the project strands are given in the final chapter.
1.3 Notes on statistical terms used
All the statistical calculations reported here were performed within Excel.
Standard deviation
The abbreviation ʻs.d.ʼ denotes a measure of the dispersal of scores around the average (ʻmeanʼ); a small s.d. indicates that the scores are tightly bunched, a large one that they are widely spread. The s.d. is calculated by subtracting each individual score from the average, squaring each difference, adding up the differences, dividing the total by the number of scores and taking the positive square root of that number.
Statistical tests
For each of the differences between pre- and post-test average scores reported here, the statistical significance of the difference was tested using a paired t-test.
Each of the correlations between two sets of data reported here is the relevant correlation coefficient calculated using Excel – which, however, does not name the type of coefficient or provide statistical significances of the correlations.
Statistical significances
The statistical significance of the difference between two scores is expressed as a ʻpʼ (probability) value. For example, p<0.05 means that the result could have occurred by chance only once in 20 times at most (0.05 = 5% = 1 in 20). This is usually taken as the minimum level of statistical significance that is considered reliable, and all the results stated in this report to be statistically significant were so at at least this level. The other two levels often indicated are p<0.01 (less than 1 chance in 100 that the result was due to chance), often described as ʻvery significantʼ, and p<0.001 (less than 1 chance in 1000 that the result was due to chance), often described as ʻhighly significantʼ.
Effect sizes
Educational Research (NFER) during development, but not possible for the spelling test or writing assessment, which have not been standardised.
The usual rule of thumb for interpreting effect sizes is that those below 0.25 are very small and probably not educationally significant; those between 0.25 and 0.5 are small; those between 0.5 and 0.8 are medium; and those above 0.8 are large. In this report, the effect sizes have been calculated by dividing the average gain in scaled reading scores (= average post-test score minus average pre-test score) by the standard deviation of the standardisation sample, which is 10.
Correlation coefficients
2. The research background
The three teaching strategies of 1. Phonics, 2. Oral reading fluency, and 3. Sentence combining (the ʻspecific project strategiesʼ) implemented by the participating teachers in this project were identified as ʻpromisingʼ and worth investigating on the basis of evidence from research. This chapter examines the rationale behind the choice of strategies and outlines briefly what the literature has to say about their effectiveness.
2.1 Phonics
A significant impetus for investigating a phonics approach in adult literacy teaching is the renewed interest in phonics in initial teaching. By phonics we mean an approach to teaching reading and spelling which focuses on the association of phonemes (sounds) with particular graphemes (letters or letter groups), and of graphemes with particular phonemes.In other words, attention is consistently drawn by the teacher to the relationship between letters and sounds. There is now strong evidence that systematic phonics instruction, within a broad and rich literacy curriculum, enables children to make better progress in word identification than unsystematic or no phonics instruction. This finding rests on two systematic reviews of the research evidence, Ehri et al. (2001) in the US and Torgerson et al. (2006) in the UK. Although there is as yet no research evidence to support the use of synthetic phonics rather than analytic phonics, the Rose Review (Rose 2006) did advocate the former, and the new DfES/DCSF phonics materials, Letters and Sounds (DCSF 2007),are firmly synthetic.
The growing research evidence to support the use of phonics in initial literacy has no comparable research base in adult literacy teaching. The Adult Literacy Core Curriculum (DIUS 2009b) makes little mention of phonics (the word ʻphonicʼ appears only at Entry 2 reading (word focus), though ʻdecodeʼ appears at Entry 1 and 3 reading (word focus), and ʻsound-symbol associationʼ or ʻsound-symbol relationshipsʼ appears under Entry 1, 2 and 3 writing (word focus); there are no such references under other focuses or at Levels 1 and 2), and indeed in the UK there has traditionally been a reluctance to promote it as a useful teaching strategy for adults. For example, a recent National Institute of Adult Continuing Education (NIACE) teacher handbook in the ʻLifelines in adult learningʼ series cautions that, for many learners, phonics ʻmay bring back memories of trying to learn to read at school and their subsequent failure to do soʼ (Lindsay and Gawn 2005, p.40). A US teaching manual, Applying Research in Reading Instruction for
Adults: First steps for teachers (McShane 2005) devotes an entire chapter to
phonics and phonemic awareness, drawing particularly on Kruidenierʼs (2002) recommendations for adult learners, which are based almost entirely on school-level evidence.
This does not mean that phonics is never used in adult literacy classes in the UK. The phonics scheme known as Toe by Toe3 is in widespread use in prisons and with young offenders. There are also a few instances of other phonics schemes
3
designed for children, such as Sound Reading4,Sounds~Write5 and THRASS6,
being used systematically by individual teachers in adult literacy and ESOL classes. However, what recent UK research into the teaching and learning of reading in adult literacy classes (Besser et al. 2004, pp.69–74; Brooks et al. 2007, p.57) has shown is that, when phonics is used, it tends to be spur-of-the-moment – incidental rather than systematic – and is often inaccurate and misleading. This state of affairs may be as much due to lack of underpinning knowledge about English phonetics as lack of conviction about the suitability of the strategy for adult learners.
2.2 Oral reading fluency
By ʻoral reading fluencyʼ we mean reading aloud to one or more people in a rapid, accurate and expressive way, with the momentum unbroken by the need to decode. There is more to it than just reading aloud, as it involves guided practice on the part of the learners, using a selection of one or more distinct methods. An important characteristic of the strategy is supporting the learners by supplying unknown words immediately and not allowing learners to struggle and lose momentum.The main research is from the US, where a huge literature search and analysis on teaching literacy to young children was carried out in 2000 by the National Reading Panel (2000a, b). Many of their findings formed the basis of Kruidenierʼs work on reading instruction for adults (Kruidenier 2002). Non-fluent readers, whose reading is typically ʻchoppy and filled with hesitations,
mispronunciations and false startsʼ, have eye movements which reflect their lack of fluency: ʻThey take in less with each fixation of the eyes on a text and move backwards or skip words more often than good readersʼ (Kruidenier 2002, p.55). Encouraging oral reading fluency has been shown to increase reading
achievement, using the measures of comprehension, fluency (rate and/or accuracy) and word recognition.
Reading fluency is widely used in the US at adult level as well as in schools, and an entire chapter is devoted to the strategy in a US adult literacy teaching manual (McShane 2005). Recent large-scale research (Brooks et al. 2007, p.49)
highlighted the absence of oral reading fluency practice in UK adult literacy classes and led directly to a small-scale development project on this strategy (Burton 2007a). This demonstrated that teachersʼ worries about using the strategy with adults proved to be unfounded in most cases. It also indicated that not only was reading fluency a popular strategy with most of the participants, both teachers and learners, but it also seemed to increase learner confidence.
Building on the findings of the pilot project, the project reported here aimed to establish whether oral reading fluency is also an effective strategy for helping learners make progress with their reading.
2.3 Sentence combining
Sentence combining is not a familiar term in UK literacy teaching but common in the US (where it is usually referred to in one word as ʻsentence-combiningʼ). By
4
For further information see: www.ourrighttoread.com 5
For further information see: www.sounds-write.co.uk 6
PROGRESS FOR ADULT LITERACY LEARNERS
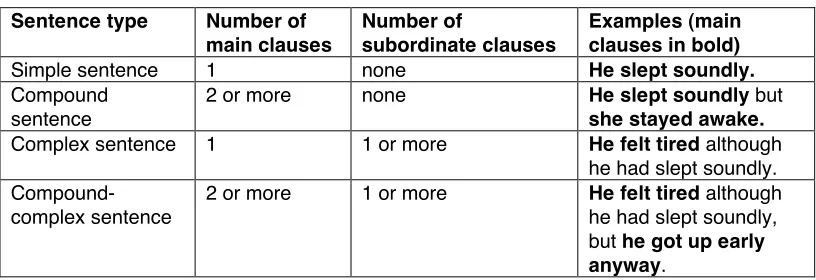
[image:14.595.108.516.164.304.2]sentence combining we mean ʻtechniques of splicing together simple sentences to make compound or complex onesʼ (Andrews et al. 2006, p.42). In other words, it is a way of teaching writing which focuses on ways of expanding simple (one clause) sentences by using conjunctions, in order to make longer sentences which have two or more clauses. The basic concepts can be tabulated as follows:
Table 2.1 The structure of English sentence types
Sentence type Number of main clauses
Number of
subordinate clauses
Examples(main clauses in bold)
Simple sentence 1 none He slept soundly.
Compound sentence
2 or more none He slept soundly but
she stayed awake.
Complex sentence 1 1 or more He felt tired although he had slept soundly.
Compound-complex sentence
2 or more 1 or more He felt tired although he had slept soundly, but he got up early anyway.
The effectiveness of most forms of teaching formal grammar as a way of improving the quality of studentsʼ writing was discredited by a comprehensive review in the 1960s (Harris 1962), a finding which was supported by a more recent systematic review (Andrews et al. 2006). However, this latest review identified one exception in the teaching of grammar, namely sentence combining, which can be shown to improve writing quality. Much of the evidence is from school-level research, with little on its applications to adult literacy learners, apart from possibly just one study in the US dating back 30 years (Mulder et al. 1978). Other forms of grammar teaching do, of course, still have an important role to play in the acquisition of other literacy skills and are indeed essential for ESOL learners. This project did not aim to be a study of ESOL learners and in the sentence combining strand, of the 28 learners involved, there were only two for whom English was not their first language.
In the recent Effective Practice Study in Writing (Grief et al. 2007)sentence combining was not reported as a strategy in adult literacy classes. However, the focus in that study was more on progress in ʻfreeʼ writing, and the
recommendations from the report mention the ʻtechnical aspects of writingʼ (including ʻgrammatical correctnessʼ) only to place them ʻwithin the contexts of meaningful writing tasksʼ. Furthermore sentence combining is not flagged up as such in the Adult Literacy Core Curriculum (DIUS 2009), but there are references in the Writing section under sentence focus to simple and compound sentences at Entry 2 and to complex sentences at Level 2.
2.4 Summary
3. Method
3.1 Aims and design
The overall aim was to investigate the use of three promising teaching strategies, thereby helping to improve the quality of teaching and learning in adult literacy. Before this could be done, focused training of teachers in the strategies had to be undertaken. In order to ascertain a) the best design and delivery of training for adult literacy teachers in the specific project strategies, and b) whether use of the specific project strategies correlated with better progress and/or more positive attitudes on the part of the learners, the project ran in three distinct phases: 1. Development of materials and methods, and training of a group of teachers in
each of the three strategies;
2. Implementation and evaluation of the teaching approaches during the autumn term 2007; and
3. Refining of methods and materials in the light of the previous phases; preparation of guidelines and resources for teacher training and classroom practice.
Each strand of the project – Phonics, Oral Reading Fluency and Sentence Combining – was run independently for the purposes of training and data collection. However the methods employed were the same. The project also benefited from further overlaps in the design: three experienced practitioner-researchers were appointed as consultants, one for each specific project strategy; the oral reading fluency consultant was also a participating teacher in the phonics strand. The sentence combining consultant also undertook fieldwork in two of the strands. One teacher took part in both reading fluency and phonics strands. Each of the three Sheffield-based research associates had responsibility for one strand, but they all contributed to all training and feedback days, and undertook fieldwork in all three strands. Finally, the teachers from all three strands met together in Sheffield for two feedback/consultation days on 9th November 2007 and 11th January 2008.
By means of this research design it was hoped that conclusions and implications for policy and practice might also be drawn in overall terms across all three strands, in addition to the strand-specific findings. Furthermore, since several of the research instruments were the same as those used in the Effective Practice Studies, this would also provide additional potential for parallels to be drawn between the findings of those projects and this study.
3.2 Phase 1 – Training of teachers
Four phonics training days were held between June and September 2007 and two further training days, one each for oral reading fluency and sentence
PROGRESS FOR ADULT LITERACY LEARNERS
also collected so that profiles of their qualifications, experience and prior use of the specific project strategies could be assembled. A total of 20 participating teachers (nine phonics, eight reading fluency, four sentence combining, with one teacher receiving training in both phonics and reading fluency) attended training days.
3.3 Phase 2 – Implementation and evaluation of teaching
strategies
A full list of the research instruments and the order in which they were administered can be found in Table 3.2 at the end of this chapter.
Following the completion of their training, the teachers started using the strategy in their classrooms and submitting weekly log notes electronically, together with lesson plans and resources, in order to report on their experience of using the strategy with their learners.
In advance of the first round of fieldwork, learner consent forms, profiles and pre-questionnaires on attitudes to literacy were administered by the teachers. These instruments were based on those used in the Effective Practice in Reading Study (Brooks et al. 2007). A total of 140 learners completed these three instruments (63 phonics, 49 reading fluency, 28 sentence combining). The learners were selected by their teachers from one (and, for one teacher, from two) of their classes, as learners they considered would benefit from being taught the specific project strategy.
During the first three weeks of October, visits were made by members of the research team to a total of 23 adult literacy classes across England. At the first visit, a total of 125 learners completed pre-assessments (58 phonics, 45 reading fluency, 22 sentence combining). Each strand used a mixture of assessment instruments, but for all strands these included either the complete assessment of reading (Phonics and Reading Fluency) or the first task from the writing
assessment (Sentence Combining), both of which had been specifically designed for NRDC by NFER and were appropriate for learners from Entry level 1 to Level 2 (see Brooks et al.2007, pp.17–18; Grief et al. 2007, p.16).
The reading assessment used two issues of a simulated magazine and tested reading comprehension by means of 30 items (easier level) or 39 items (harder level), which were a mixture of multiple-choice and open-ended question types. There were two levels of the comprehension task – an easier ʻaʼ form and a harder ʻbʼ form. The writing assessment also used this magazine as the stimulus for the writing task, and the marking scheme took account of clear expression of opinion and punctuation, as well as sentence structure; sentences were judged in terms of the use of sentence types (simple, compound and complex) and use of conjunctions. The number of words and number of sentences were counted so that average sentence length could be calculated. Parallel forms of the reading and writing tests were used pre and post.
wide range of attainment in spelling among the learners to be recruited, from very low to quite capable, even though we had asked for classes with learners at Entry level. Very few commercially-produced spelling tests for adults are available, and none would have been suitable here because of cost and the off-putting nature of the formal layout and large number of items.
A very short test (23 items) with a simple layout – two columns, with the numbers 1–23 in the left-hand column and spaces for answers in the right-hand column – was therefore designed. The words were chosen to cover all but three of the phonemes of (most British accents of) English and the graphemes they are most typically represented by, plus the 2-phoneme sequence /ks/ spelt <x> in six – for the list of words see Table 4.7. Because the list was constructed on a phonetic basis, word frequency and familiarity could not be controlled, except that all the words would be familiar to all native and most non-native speakers of English, and rare and unfamiliar words were of course avoided. Also, all but one of the words were monosyllables; – this was done primarily in order to make the test accessible to as wide a range of abilities as possible. It was not intended to reflect the teaching the learners received or impose any limits on it.
The same spelling test was used both pre and post. It was administered dictation-style; that is, the administrator named the words aloud one at a time, allowing sufficient time for learners to write their attempts. Where necessary to avoid misunderstanding, context for the words was supplied by means of actions, synonyms, or collocations.
Finally, with regard to the spelling test and, indeed, all the assessments, it is important to state that the training the teachers received was in no way linked to the assessments administered to the learners. The teachers were given no prior indication of the content of any part of the assessments and would not have been able to tailor their teaching to these assessments.
At this first visit a class observation of any remaining teaching time was also carried out. Detailed observation log notes were taken and an analysis done of the general teaching strategies observed, using the same instrument as in the Effective Practice in Reading Study (Brooks et al. 2007), which was in turn based on the What Works Study in the US (Condelli 2003). This instrument is
reproduced in the Appendix. A further analysis of the elements of the specific project strategy was also undertaken, using coding forms specially designed for each strand. Each form listed ten items which were drawn from the training guidelines and related to aspects of background knowledge and pedagogy which might be expected to feature during the implementation of the strategy.
A second visit to the class was undertaken during the first three weeks of November 2007 to conduct an observation of the full class running time and analyses of general and specific strategies, as above.
The third and final class visit took place between the end of November and mid-December in order to administer the post-questionnaires and post-assessments, and to conduct an observation of any remaining class time. A total of 91 learners completed post-assessments (phonics 42, reading fluency 32, sentence
PROGRESS FOR ADULT LITERACY LEARNERS
evaluation forms to ascertain their reactions to being taught the strategy and taking part in the project.
[image:18.595.104.542.167.245.2]A summary of the number of learners at each stage of the project is shown in Table 3.1 below.
Table 3.1: Learner numbers
Stage Questionnaire Assessment Evaluation Strand
Recruited
pre post pre post
Phonics 63 63 52* 58 42 50
Fluency 49 49** 40 45 32 38
Sentence combining 28 28 17 22 17 22
Total 140 140 109 125 91 110
* The total of phonics post-questionnaires completed was 53, but for data analysis purposes is reduced by one as one learner had not completed a pre-questionnaire or any other instruments.
** The total of reading fluency pre-questionnaires was 50 but for data analysis is reduced by one as one learner had filled in no other instruments.
Two feedback and consultation days for the participating teachers from all three strands were held in Sheffield in November 2007 and January 2008. These aimed to give the teachers an opportunity to share concerns, ideas and
resources with the research team and with each other; and on the second of the days, also to complete a detailed evaluation form to ascertain their reactions to a) the training, b) participation in the project, and c) the implementation of the
strategy in the classroom.
3.4 Phase 3 – Revision of methods and preparation of
teaching materials
Table 3.2: Research instruments used in the project
Instruments specific to particular strands Instruments
common to all 3
strands Phonics Oral reading fluency
Sentence combining
Administered prior to the first class visit
Learner consent form* Learner profile* Phonics teacher questionnaires Fluency teacher questionnaires Sentence combining teacher questionnaires Learner attitudes pre-questionnaire p.1* Learner attitudes pre-questionnaire p.2 Learner attitudes pre-questionnaire p.2 Learner attitudes pre-questionnaire p.2
Throughout the implementation of the project
Teaching log notes Teaching log notes Teaching log notes
At the first class visit
Reading comprehension pre-assessment* Spelling pre-assessment Reading comprehension pre-assessment* Writing pre-assessment, question 1*
During all class visits
Coded analysis of general teaching strategies*
Coded analysis of specific strategies
Coded analysis of specific strategies
Coded analysis of specific strategies
At the final class visit
Learner attitudes post-questionnaire, p.1* Learner attitudes post-questionnaire p.2 Learner attitudes post-questionnaire p.2 Learner attitudes post-questionnaire p.2 Reading comprehension post-assessment* Reading comprehension post-assessment* Writing post-assessment, question 1* Spelling post-assessment Reading ʻperformanceʼ evaluation Learner evaluation form Learner evaluation form Learner evaluation form
After the final visit
Teacher evaluation form
4. Phonics
This chapter describes the findings from the phonics strand of the project in terms of the sample, the learnersʼ progress, the implementation of the strategy in the classroom and the search for factors associated with progress.
4.1 The providers, learners and teachers
4.1.1 The providers and settings
Seven of the ten participating classes represented the Further Education (FE) sector and the remaining three were Adult and Community Learning (ACL). All classes were held in college or adult education centre settings. They covered a wide geographical area of England – Bedford, Cheltenham, Derbyshire,
Doncaster, Leeds, Lincoln, London, Sheffield and Worksop. All were ʻsingle purposeʼ adult literacy classes.Sessions were mainly of 2 hours in duration, with three classes having sessions lasting 2.5 hours. All were daytime classes except for two held in the evening.
4.1.2 The learners
The initial sample consisted of 52 learners who completed consent forms, learner profiles and both pre- and post-questionnaires. Their characteristics are set out in Table 4.1. (Note that in some cases the numbers (percentages) do not total 52 (100 per cent) as not all learners responded.)
Prior to the pre-assessment, the teachers were asked for their judgements about their learnersʼ levels. The largest number were judged to be at Entry level 3, followed by Entry level 1. The great majority (83 per cent) were at or below Entry level 3, a range of learner ability at which, it might be expected, most benefit from this strategy would be derived.
Table 4.1: Background characteristics of the 52 learners
N %
Men 20 38
Gender
Women 32 62
16–19 0 0
20–29 10 19
30–39 15 29
40–49 9 17
50–59 7 13
Age distribution
Over 59 11 21
White 38 73
Ethnicity
Other 14 27
English 44 85
First language
Other 8 15
Employed (full-/part-time) 15 29
Unemployed 9 17
Occupational status
Unwaged 24 46
[image:20.595.140.497.550.770.2]15 13 25
16 22 31
Age of leaving full-time education
Over 16 4 8
None/no response 30 58 Literacy certificate 18 35 CSE/GCSE/O-level 4 8
NVQ/BTEC 0 0
Highest qualification
A-level or above 0 0
[image:21.595.141.500.70.172.2]The teachersʼ judgements corresponded on the whole closely with the levels indicated by the reading pre-assessment results (Table 4.2). Differences affected only seven learners – three cases where the teacherʼs judgement was one level higher than the test result (E2 for E1), three where it was one level lower (E3/L1, E2/E3) and one where it was two levels lower (E1/E3).
Table 4.2: Learner levels according to pre-assessment – phonics
Level N %
L2 2 3
L1 8 14
E3 20 35
E2 11 19
E1 or below 17 29
Total 58 100
On the evaluation form at the end of the project teachers were asked about the levels of learners they had used the strategy with and types of learners for whom they thought the strategy was most useful/unsuitable. The range of learners taught by each teacher is shown in Table 4.3.
Table 4.3: Levels of learners who received phonics instruction
Teacher Pre-entry Entry 1 Entry 2 Entry 3 Level 1 Level 2
1 √
2 √ √ √ √
3 √ √ √
4 √ √
5 √ √
6 √ √
7 √ √ √ √
8 √ √
9 √
Thus the teachers used the strategy with learners from a mix of abilities from Pre-entry to Level 2. Most of the teachers (seven) used the strategy with learners at E1 level, while five groups contained learners at E2 level. Only two groups included Level 1 learners and only one group learners working at Level 2. In terms of range of ability within each group, one group included learners ranging from E1 to L1, and another learners ranging from Pre-entry to E3. Only two teachers had learners who were all at one level, E1 in one group and E3 in the other.
[image:21.595.205.419.279.370.2]PROGRESS FOR ADULT LITERACY LEARNERS
20s to 80sʼ, although one teacher considered that the strategy was most suitable for younger learners. One teacher felt that phonics was appropriate for learners for whom English is the first language, while another felt that it was most suitable for ESOL learners. Another teacher related it to the purposes for which it is used: ʻI think it is useful for different purposes at different levels, e.g. reading/spelling – Entry levels; spelling – Level 1/2ʼ. One teacher had found that the strategy worked well for learners with mild learning difficulties or dyslexia; another felt that phonics was suitable for ʻthose learners who have missed out on these reading skills at school rather than those who have significant learning difficultiesʼ.
One teacher highlighted the need for a systematic approach, which might seem too slow and laborious for learners who come to a class expecting a ‘quick fix’ – even though ‘these were the very people who needed the systematic approach to learning!’ This teacher found that the strategy was useful for learners who lacked confidence and who were prepared to take time to learn.
Teachers were also asked if they thought that there are learners for whom phonics would be unsuitable. A range of views were expressed. Two of the teachers thought the approach would be suitable for all groups of learners, and a third believed that phonics would only be unsuitable if learners are ‘uninterested’. One teacher ‘would hesitate to use it with a deaf learner’, while another asserted that ‘phonics does not work for my dyslexic learners, especially because they have severe auditory processing problems’. A teacher whose learners were at Pre-entry and E1 level pointed out the need to go slowly, with lots of practice, for some learners, but that ‘it can work for them all’. Another teacher flagged up that phonics proved problematic for one learner who ‘felt challenged because he had to move out of his comfort zone’.
4.1.3 The teachers
Nine teachers took part in the phonics strand, one teaching two classes, and at the first training day they completed individual profiles:
•
Gender: Eight of the nine were women, and eight of the ten classes were taught by women.•
First language: English was the first language of seven of the nine teachers. One teacher had Spanish as her first language, and another had Urdu, although the latter teacher had spent her entire life in England and had native speaker competence in English.•
Teaching experience: Their basic skills teaching experience ranged from 3 to 17 years with an average of about 6.5 years; all but 2 had additional teaching experience in other subjects.•
Phonics experience: Six had received at least some prior training in phonics, if only briefly as a component of Level 4 training; three had some priorknowledge of the International Phonetic Alphabet (IPA); only two had never used phonics as a teaching strategy before – the others had all used it at least occasionally.
4.2 Learners’ progress
The learnersʼ progress was assessed by:
1. Pre- and post-assessments of reading comprehension and spelling
2. Their views of their own progress, obtained mainly from the learner evaluation forms and pre- and post-questionnaires
3. Their teachersʼ views of their progress from the teacher evaluation forms, observational data, teaching logs and additional data from feedback days and correspondence.
4.2.1 Reading and spelling attainment
Two measures of progress were used for the phonics learners – a test of reading comprehension and a spelling assessment. A total of 42 learners from 9 classes completed both assessments at both pre-test and post-test.
Reading
[image:23.595.177.441.374.429.2]The average scaled reading scores at pre- and post-test are shown in Table 4.4.
Table 4.4: Average pre- and post-assessment scaled reading scores – phonics strand
Pre-test Post-test
Sample size 42 42
Average score 19.2 24.3
(standard deviation) (18.3) (19.6)
The learnersʼ pre- and post-test average scores were well below the national average of 50 derived from the piloting of the assessments by NFER, consistent with the majority of learners (83%) having pre-assessment levels of Entry 3 or below (Table 4.2). The average scores were also lower at both points than those of the learners in the oral reading fluency strand.
However, the average score improved by 5.1 scaled-score points between pre- and post-test, and the effect size was 0.51 (medium). The difference was highly statistically significant (p<0.001). The standard deviations at both points were larger than the norm of 10, which suggests that the samples were diverse; indeed on both occasions there were learners who scored zero and learners whose scores were in the 60s (increasing to 70s at post-test).
PROGRESS FOR ADULT LITERACY LEARNERS
Table 4.5: Average pre- and post-test reading raw scores, phonics strand
Test form Pre-test Post-test Gain
Average score 8.8 10.8 2.0
a
(N=29) (standard deviation) (5.4) (7.0) (3.6)
Average score 15.0 17.4 2.4
b
(N=11) (standard deviation) (7.3) (6.7) (5.1)
The ʻaʼ groupʼs gain was highly statistically significant (p=0.005) but the ʻbʼ groupʼs was not significant (p=0.16), probably because of the small sample.
The average gains of 2.0 and 2.4 raw score points were equivalent to about 7 per cent and 6 per cent of the maximum scores of 30 and 39 respectively. The pre-test average raw score for the learners who took form ʻaʼ would put a learner with this score very near to the upper end of Entry level 1, and the form ʻaʼ post-test average score would put a learner with that score over the threshold into Entry level 2. The pre-test average raw score for the literacy learners who took form ʻbʼ would put a learner with this score just into Level 1, and the form ʻbʼ post-test average score would put a learner with that score further into Level 1. In both cases the average gain was equivalent to about one third of an NQF level.
Spelling
The average scores for the spelling assessment, based on number of words correctly spelt from a total of 23, are shown in Table 4.6.
Table 4.6: Average pre-and post-assessment spelling scores
Pre-test Post-test
Sample size 42 42
Average score 12.5 13.9
(standard deviation) (7.4) (7.1)
The average score improved by almost one and a half words correct between pre- and post-test, and the difference was statistically significant (p=0.002). This was despite the fact that four of the learners scored full marks at both stages. Nine learnersʼ average scores went down (including two who had had perfect scores at pre-test), seven scored the same at both stages (including the four just mentioned), and 26 improved. The biggest improvements were made by a
learner whose score went up by 12 (from 5 to 17), and another whose score went up by 8 (from 13 to 21).
Except where stated, all the figures quoted in the rest of this sub-section are based on the 38 learners who did not have perfect scores at both stages,since correct spellings can contribute nothing to error analysis. (In Table 4.7, the four who did have perfect scores at both stages would contribute a further four correct spellings at each stage.)
Table 4.7: Number of correct spellings of the words, pre and post
Word Pre Post
cup 33 34
six 32 33
book 32 34
van 30 31
this 27 29
den 26 28
rock 22 26
thing 22 22
sheep 22 23
zip 21 29
year 21 22
north 17 18
roof 17 21
light 17 19
chair 16 14
owl 14 16
church 13 14
farm 13 18
puff 10 16
quiz 10 10
waiter 9 13
goal 8 13
join 7 10
The number of correct spellings went up on every word except ʻquizʼ and ʻthingʼ. At pre-test, no single word was spelt correctly by all these learners, but at post-test this was true of ʻcupʼ and ʻbookʼ. Very high frequency and familiarity would seem to account for most of the words at the top of the list, but lower frequency and familiarity seem unlikely to have accounted for the words at the bottom. Rather, ʻjoinʼ, ʻgoalʼ, ʻwaiterʼ and ʻquizʼ contain phonemes with strongly competing spelling choices (<oi, oa, ai, er, z> v. <oy, o.e/ow, ay, or, s>). This factor may also have affected the ranking of the words from ʻnorthʼ to ʻpuffʼ, since the alternatives to <or, oo, igh, air, ow, ur, ar, ff> pose some, though less strong, competition. Vowel phonemes were misspelt more often than consonant phonemes were.
Spelling error analysis
A detailed analysis was made of the misspelt words. A few (15) could not be analysed because of illegibility of the learnerʼs handwriting. A further 56 defeated attempts to analyse them, for example ʻchairʼ spelt ʻhiaeʼ, ʻowlʼ spelt ʻaerʼ, and ʻyearʼ spelt ʻhatʼ (which was therefore an error even though a real word). There were also several instances of learners writing just one letter for a word,
sometimes one of the letters of the correct spelling (which enabled the rest of the word to be classified as omissions; see next paragraph), e.g. ʻTʼ for ʻwaiterʼ, ʻOʼ for ʻowlʼ, sometimes a letter that did not appear in the correct spelling, e.g. ʻSʼ for ʻrockʼ,ʻCʼ for ʻsixʼ. Words in the latter category were classified as uncodable.
PROGRESS FOR ADULT LITERACY LEARNERS
and minor ones judged whether an error was a real word and/or seemed to be a ʻbetter errorʼ.
The first four major categories are largely self-explanatory; examples are:
Insertion: thing spelt theing Omission: farm spelt arm Substitution: den spelt dan Transposition: this spelt Tihs
The fifth major category was called ‘grapheme substitution’. It was used only for errors which appeared to be attempted spellings of a single phoneme at the correct point in the word but using an incorrect grapheme, e.g. ‘dis’ for ‘this’ and ‘gole’ for ‘goal’.
[image:26.595.137.473.301.408.2]The distribution of errors across the major categories is shown in Table 4.8.
Table 4.8: Spelling error frequencies, major categories
Pre Post
Category N (%) N (%)
Insertion 63 (10) 73 (13)
Omission 307 (50) 260 (46)
Substitution 138 (23) 138 (25)
Transposition 17 (3) 12 (2)
Grapheme substitution 85 (14) 78 (14) Total coded errors 610 (100) 561 (100)
Omissions were by far the largest category at both stages, as might be expected of less competent spellers. Most omissions were of single letters, but sometimes more, e.g. where just one letter of the word was written. Substitutions were also quite frequent, insertions and grapheme substitutions occurred less often, and transpositions were rare.
The total number of errors dropped by 8 per cent, but otherwise the amount of change from pre to post was small, as was to be expected given the small change in the overall average score. Nevertheless, it is a positive sign that the proportion of omissions went down, and also that the proportions of insertions and substitutions went up – meaning that learners were on average more prepared to have a go than to leave something out.
Another positive sign was that the number of errors which resulted in a real word went down, again suggesting that some learners were more willing to have a go at the target word rather than write one similar to it. Also, there were scattered signs of some learners making ʻbetter errorsʼ, in the sense of ones that were closer to the target and more likely to lead on to the word being spelt correctly. Some examples are:
Target Pre Post
zip cep sip
join yoen Joiyn
chair hiae hear
goal go golle
While these and other errors do show closer approximations to the targets, this tendency could not be quantified because of the very subjective nature of the judgments required.
4.2.2 Learners’ views of their progress
Attitudes questionnaires
The attitudes pre- and post-questionnaires asked about the learnersʼ general self-confidence in a range of language-, literacy- and learning-related situations (nine questions common to all three strands) and about attitudes to reading and spelling (two questions specific to the phonics strand). All were rated on a scale of 1 to 4. The two specific questions were:
10. When I have to work out what a word says I feel… 11. When I have to spell a word I feel….
Fifty-two learners completed both pre-and post-questionnaires. Confidence increased from an average rating across the 11 questions of 2.4 (pre) to 2.6 (post), and this change was statistically significant (p<0.001). Most differences on individual items were not statistically significant, but there were significant
improvements on three items (1. When I think about speaking in front of a group of people, I feel..; 6. When I have to fill in a form…; 8. If I have to read a set of instructions…) and highly significant improvements on items 7 (If I have to read something out loud) and 11 (see above). Confidence did increase on item 10 but not significantly. Improvements therefore affected not only the areas of decoding and spelling, which might be expected to benefit directly from phonics instruction, but also other skills, including oracy (items 1 and 7).
Evaluation form
Fifty of the learners who took part in the phonics strand completed a learner evaluation form at the end of the project. This form had seven questions to elicit information about learnersʼ understanding of the concept of phonics and
experience of it, and whether they wanted to continue to learn in this way. Two of the questions dealt directly with progress and enjoyment, and provided a valuable source of information on how learners viewed the progress they felt they had made. The responses to these questions are summarised below.
3. Do you feel it has helped you read and/or spell better? (a lot/a little/not at all)
Of the 48 learners who responded to this question, 28 stated that they felt that phonics had helped them ʻa lotʼ to read and/or spell better, 18 learners felt that it had helped ʻa littleʼ and one learner felt that it had not helped at all. One learner simply wrote ʻyesʼ. Of the learners who wrote ʻa littleʼ, one learner explained that it had helped with ʻsmall words not long onesʼ and another wrote ʻspell a little bitʼ. The learner who wrote that phonics had not helped at all qualified this with ʻI think it will help – 2 and 3 letters (blends).ʼ
4. What have you enjoyed most about phonics?
PROGRESS FOR ADULT LITERACY LEARNERS
directly or indirectly to progress. Many comments referred to ʻsoundsʼ and
learners explained that they had enjoyed the way phonics helped them to listen to sounds – ʻit has helped me listen to the sounds more and Iʼve enjoyed thatʼ, ʻlistening for sounds that I couldnʼt hear beforeʼ. ʻSounding out words as a class activity and individuallyʼ was the response of one learner. For one learner, focusing on sounds through phonics had impacted upon his life beyond the classroom – ʻfamiliarising myself with the different sounds and it helps me with my hobbyʼ. In terms of specific resources, ʻflip flap booksʼ were singled out by one learner as the most enjoyable aspect of phonics instruction.
Three learners felt that phonics had improved their spelling, while another highlighted that they had enjoyed ʻgetting to know what letters go on the end of words and in the middle.ʼ Four learners wrote about progress in terms of learning more words, either for their meaning or being able to read them. Three felt that phonics had improved their learning generally – ʻIʼm learning something – I enjoy learning – Iʼm doing more than I have ever done beforeʼ, ʻI feel like I have been able to take more in and remember betterʼ.
The final question was open-ended and gave the opportunity to highlight any aspect of the experience:
7. Is there anything else you would like to say about taking part in this project or using phonics?
Thirty-four learners wrote a response to this. Apart from the statement ʻit does not help meʼ, the comments were almost exclusively positive, and many related to progress in some way, especially in terms of motivation, enjoyment, and helping them to learn. Three of the more detailed responses included:
ʻI wish it would carry on. Itʼs a great way phonics is put across to us. And itʼs an easy way of remembering the words. I would never have remembered as many words without this. In 60s we never learnt this.ʼ
ʻThis has helped me a lot with my writing and my spelling and I feel better about myself and my spelling because now I can sound the words out and spell them.ʼ
ʻItʼs made me understand how to read more – I will try to sound the word out more carefully. It helps me when I am on my ownʼ.
As well as the information gathered on learnersʼ views of their progress from the evaluation forms, a couple of situations arose during the research that provided additional insights. In one case, before the start of a lesson, a researcher asked a learner (aged 22, with dyslexia and Asperger syndrome) what she thought about the phonics teaching her group had experienced. The learner said that she had done more than ever before and was clearly delighted with her progress.
Secondly, a lorry driver, who had apparently driven lorries for many years, said in the course of a lesson that it used to take him more hours than necessary to complete a journey. Now he felt more able to read road signs.
4.2.3 Teachers’ views
forms, completed anonymously at the end of the project. Note that all references are to ʻsheʼ and ʻherʼ, although one of the teachers was a man.
Evaluation forms
Question 23 requested views on the extent to which phonics tuition had impacted upon learners; teachers were asked to rate, on a scale of 1–5 (5 being the most positive, 3 representing no change, and 1 and 2 representing a negative impact), how they felt phonics had affected their learnersʼ:
a. enjoyment/engagement in class b. confidence
c. ability to decode d. ability to spell
e. reading comprehension f. peer support/ʻgellingʼ of class.
In each of the six areas there was at least one teacher who felt that there had been no change in terms of learnersʼ progress. However, apart from one who thought that phonics had had a negative impact on learnersʼ ability to spell, the majority of teachers felt that using phonics had had a positive impact on each of the aspects outlined in this question.
The area in which most progress was reported was enjoyment and engagement in class. Almost all the teachers (eight out of nine) reported that learners had enjoyed and engaged with the strategy, with six rating their learnersʼ progress at 5 and two at 4. Only one teacher felt that there had been no change in this respect. Another area where the strategy seems to have impacted positively on learners is peer support and ʻgellingʼ of class – five teachers rated progress in this area at 5 and only one teacher reported no change. Confidence levels were also felt to have increased when using the strategy, with three teachers rating learnersʼ progress at 5 and only one teacher reporting no change.
Perceptions of change in actual literacy skills were not as positive as those for the ʻsofterʼ areas of impact, but teachers did report progress in ability to decode and ability to spell; in both areas six teachers rated learnersʼ progress as 4. Even in the area where least change was reported, namely reading comprehension, where five teachers felt there had been no change, four of the teachers rated learnersʼ progress as 4. (The teachers had been given no information about the gains on the reading assessment.)As mentioned above, the only area where a negative impact was reported was in the ability to spell, where one teacher rated learnersʼ progress as 2.
Teachers were also asked, in the second half of this question, ʻDid you notice any other effects on your learners?ʼ One teacher noted that, as a result of the phonics tuition, the learners had become ʻvery proficient in the use of dictionariesʼ.
Another pointed out that all the learners had continued throughout the course, with no withdrawals, commenting that this was an achievement for a Skills for Life class.
PROGRESS FOR ADULT LITERACY LEARNERS
individual success story. From this came a wide range of ʻsuccess storiesʼ, including the following vignettes:
ʻIn a session I taught this week, I decided to re-cap everything we had done so far, to see if learners could remember their learning after the Christmas break … I showed pictures of CVC words and asked individuals to sound out the phonemes … I very quickly became redundant as they discussed
alternatives and 90 per cent of the time arrived at the correct spelling as a group.ʼ
ʻOne of my learners had no sound/symbol recognition and was desperate to learn to read. He has worked very hard at home learning the sounds. He finds it difficult to blend, but is making progress rapidly. He can now read 3 and 4 sound words, including consonant digraphs. His confidence has soared – he is happy and I canʼt wait to see how far we can get by June!ʼ
ʻOne learner has made particularly good progress with her spelling and reading and general confidence. The use of small group work has benefited the learners and they have become very supportive of each other… The learners have obviously enjoyed the approach and still have a lot to learn.ʼ
More informally, one teacher reported in subsequent email correspondence that:
ʻAn LSA [Learning Support Assistant] was allocated to my class today who had worked with these learners [who took part in the phonics strand] regularly last year. She commented on her amazement at the progress which two of the Entry 1 learners had made with their reading and she echoed my thoughts that neither f us felt these learners were aware themselves of the fluency with which they are now reading and the progress they had made, largely I
believe, due to the work we have done on phonics. It was very rewarding, I can tell you!ʼ
Comments from the teachers in their teaching logs or as a result of semi-structured interviews after observed sessions provided detailed information on how they viewed learnersʼ progress week-by-week. The majority of views were positive about the progress being made, although many made the point that it was very slow – ʻmeasurable but slowʼ, as one teacher expressed it. Several mentioned the need for reinforcement and consolidation before moving on in order to avoid confusion, and ʻthe value of revision in reinforcing the link [between phonemes and graphemes].ʼ
One learnerʼs progress was described by her teacher as going well beyond phonics instruction:
ʻN was rather distressed when she arrived this morning due to personal events, but really blossomed during the phonics! Again, her confidence seems to grow by going back to basics in order to move forward. I must take care not to rush these learners by moving too quickly! Pace will be
everything!ʼ
had one-to-one LSA support. This is largely because of her confidence issues and she has always felt the need to check almost every word she writes with the LSA before she puts pen to paper. I have noticed that N is now beginning to complete phonics tasks herself without constantly having to seek the LSAʼs approval. This appears to be very slow progress but it is a major step for Nʼs development as she also participates a little more in speaking activities.ʼ
ʻN in particular impressed me this week as she has poor memory and sequencing ability. Last year she would not have spoken in class but today she directed our support assistant from her house to the church she attends. She spoke in front of the class very confidently with a bit of back up where needed!ʼ
4.3 How the strategy was implemented
A detailed account of recommended methods and materials for teaching phonics, with examples from practice, can be found in the associated Practitioner Guide (Burton et al. 2008). This section concentrates on giving an account of the teaching that took place over the course of the project, both from classroom observations and from the teachersʼ own descriptions of their practice. Information was obtained from observation log notes and strategies analysis sheets, teaching logs and teachersʼ end-of-project evaluations.
4.3.1 General and specific teaching strategies
Each of the ten classes was observed on up to three occasions (at the end of the pre- and post-assessment sessions if any teaching time remained, and a full observation at one point between), and the teaching and learning activities were coded according to the general and specific strategies analysis sheets. A record was also kept of the total amount of teaching time observed during each visit (over which the general strategies applied) and the length of time spent on delivery of the specific strategy. For phonics, the average amount of teaching time observed was 96 minutes, and the strategy was used on average for 48 minutes per session, that is for half the teaching time.
The teachersʼ general teaching strategies were rated during the observations on a schedule containing 19 items, divided into two parts: A. General teaching strategies (11 items) and B. Opportunities for learner involvement (8 items). Each item was rated for every class observed on a four-point scale where 0
represented ʻnot observedʼ and 3 ʻobserved to a high degree (characteristic of the teacher)ʼ. The Effective Practice in Reading Study concluded that the whole instrument could be treated as a measure of a single latent factor, ʻquality of teaching observedʼ (Brooks et al. 2007, p.47). For the purposes of this study too, both sections have been combined to give a total score. The ratings per class, averaged over the sessions, ranged from 0.8 to 2.5, representing quite a wide range of teaching quality. The average across all classes was 1.6, which (the maximum score being 3) can be interpreted as reasonably good overall, although not outstandingly so.
PROGRESS FOR ADULT LITERACY LEARNERS
and pedagogy which might be expected to feature in the course of phonics teaching. These activities corresponded closely with the guidelines given to the teachers during the training (for further details see the associated Practitioner Guide (Burton et al. 2008)), and the list was therefore less a snapshot of quality of teaching than a measure of the fidelity with which the strategy was
implemented. The items are listed below:
•
Provides teaching that accurately reflects the underlying principles of English phonetics and phonology.•
Maintains a clear and accurate distinction in teaching between graphemes and phonemes.•
Encourages learners to sound out and blend for reading, modelling as appropriate.•
Encourages learners to segment and sound out for spelling, modelling as appropriate.•
Makes sure, when appropriate, that learners realise some phonemes have more than one spelling and that some graphemes have more than one pronunciation.•
Encourages wider reading beyond phonic texts.•
Can respond to learnersʼ questions and concerns, adapting methods and materials as appropriate.•
Uses existing worksheets/guidelines appropriately and creatively; is inventive in devising new materials and activities.•
Provides systematic teaching, building on the learning from previous weeks in a systematic way; doesnʼt move on too fast but allows time for consolidation.•
Provides opportunities for self-study of strategy by setting homework/makingsuggestions for activities between classes.
[image:32.595.199.397.563.702.2]
Each item was rated on a 2-point scale where 0 represented ʻnot observedʼ and 1 ʻobservedʼ. The average ratings for the specific strategy items ranged from 0.2 to 0.9, again a wide range, with an average of 0.6. Table 4.9 shows the average ratings by class for both general and specific strategies.
Table 4.9: Average general and specific strategies ratings, phonics strand
Class no. General Specific
1011 0.8 0.2
1021 1.4 0.6
1041 1.6 0.6
1042 1.4 0.6
1051 1.5 0.6
1061 1.7 0.6
1071 1.6 0.6
1081 2.5 0.9
1101 1.9 0.9
4.3.2 Patterns of strategy use
The time devoted to phonics was recorded in observation documents and in the weekly teaching logs. The time spent on the strategy ranged from 10 to 131 minutes per session, representing a proportion of the whole teaching time which varied from 9 per cent to 100 per cent. The average time spent on phonics was 48 minutes. Two of the teachers used the strategy with a sub-group within the class, but most involved the entire class in the delivery of phonics.
In most lessons the phonics element seemed to be clearly defined and formed a self-contained part of the session. For example, in one observed lesson, the teacher introduced the phonics section by telling the learners that she was now putting on her ʻphonics hatʼ. One teacher, however, was quite clear that she wanted a more ʻholisticʼ approach and felt it was important to deliver the phonics as an integral part of her lesson rather than as a discrete unit. Even though the phonics was delivered by most teachers as a self-contained section, it was noteworthy that many of them referred wherever possible to the phonics and made links in other parts of the session with the phonemes and graphemes they had been studying.
A range of patterns of classroom activity was observed, the most common being a whole-group presentation by the teacher, either to revise or to introduce graphemes/phonemes, followed by pair work or work in small groups, and some time spent on individual activities. Games or other activities often featured in lessons as whole-group activities, for example bingo or dominoes. Some
teachers were constrained by room size and this meant that work in small groups would have been difficult. The presence of one or more Learning Support
Assistants in the classroom also impacted upon the patterns of classroom activity, for example the LSA might take a small group of learners and play a game based on phonics, such as snakes and ladders.
4.3.3 Teachers’ approach to the strategy
Eight of the nine teachers reported that they had used phonics for both reading and spelling, with one using the strategy just to improve spelling.
Teachers started at a wide range of points in terms of phonics progression. Some teachers started by introducing the so-called long vowel sounds, while others started back at basics with the recommended starting-point of ʻs a t p i nʼ one-to-one correspondences. A clear progression could be charted in most cases; one-to-one group, who had begun the strategy with ʻsatpinʼ letters was tackling <qu> by the final week. In another class, where the learners were divided into two groups according to ability, the teacher noted that by the end of the strategy the lower-level group had reached the point at which the higher-lower-level learners had begun. The breadth of activities used to deliver phonics was impressive, and teachers had clearly spent a great deal of time and effort to find or create suitable materials to use with their learners. It is worth noting that teachers seemed to maximise the opportunities to use games with their learners to make the phonics enjoyable. Many of the games used were produced either by tea