Child Yield
Data Management and Analysis Group
DMAG Briefing 2005/25
August 2005
Child Yield
For more information please contact:
John Hollis
Demographic Consultant
Data Management and Analysis Group Greater London Authority
City Hall (5 East PP14) The Queen’s Walk London SE1 2AA
Tel: 020 7983 4604
Copyright © Greater London Authority, 2005
Labour Force Survey data are © Crown Copyright
London Household Survey data are © Greater London Authority
Front cover photograph © London Borough of Brent
Acknowledgements
Thanks to Margaret Melling (OxfordshireCC), Steve Clyne (EFM Ltd) and GLA colleagues for helpful comments
Executive Summary
Child yield relates to the assessment of the impact of new dwellings upon the local education authority’s services by introducing additional children to the local school rolls. Estimates of the child yield of new dwellings are a matter of debate between the LEAs and the developers.
Good data to support child yield negotiations are limited. Many London boroughs are still using factors developed from 1991 Labour Force Survey data by the London Research Centre.
Child yield factors should relate solely to new accommodation and incorporate tenure, dwelling type, size of the accommodation in terms of number of bedrooms and the ages of the children.
At present the 2001 Census cannot assist in getting such factors, although the possibility of identifying areas of new development and commissioning appropriate tables are being explored. Even so, the Census only has data on the total number of rooms rather than bedrooms.
The 2002 London Household Survey can offer results relating to tenure and numbers of both rooms and bedrooms, but due to its sample size cannot offer results specific to new dwellings. However, it can be directly compared to the 1991 Labour Force Survey and, potentially, act as a link between 2001 Census data relating to rooms and the requirement for factors relating to bedrooms.
Two recent surveys of new housing can offer results of direct relevance to the assessment of child yield in London boroughs. Data from these surveys are presented and compared to the original 1991 LFS factors.
The Wandsworth survey in 2004 is particularly relevant to inner London, especially for private flatted developments.
The Oxfordshire survey, also in 2004, has results that may be used in outer London where more developments are of houses.
Introduction
Child yield is usually taken to relate to the impact of new dwellings upon the local education authority’s services by adding children to the local school rolls. Estimates of the child yield of new dwellings are a matter of debate between the LEAs and the developers.
While child yield is a key point of negotiation that can lead to the sharing of LEA expenses for providing additional school places that may amount to millions of pounds, there is very little data to support the arguments.
Child yield is acknowledged to vary within the type of accommodation and in terms of size (usually measured as the number of bedrooms) and tenure. It will also vary by locality and by the ages of the children.
Ideally the base data required to calculate child yield should be collected as follows:
• New dwellings – preferably up to three years old and identifying flats and houses separately
• Number of bedrooms in each dwelling
• Tenure – particularly social rented and private ownership
• Number of children by age in each dwelling– at least for pre-school, primary and secondary school ages
A number of additional factors relating to whether the children were in maintained or private education and whether the move to the new accommodation involved a change of school for any of the children would also assist education planning.
For very large developments that take place over ten or more years it is logical to survey every few years as the children in early completions age and cohorts of different sizes pass through the education system.
The London Research Centre (LRC) commissioned tables from the 1991 Labour Force Survey – which in that year asked a question on number of bedrooms – and calculated child yield factors for 0-15 year olds by tenure for both Inner and Outer London. The original note by Ian McCallum - see Appendix - relating to these calculations has been used by many boroughs and is still requested. However, the data did not relate to new dwellings but to households in all dwellings and so adjustments were made to the results based upon LA/HA allocation policies.
2001 Census
For most demographic purposes the Census would be considered to be the first port of call. However, in regard to child yield estimates, it fails on two counts: it does not ask for age of dwelling and it asks for numbers of rooms rather than bedrooms. So, while it has more than adequate data on the residents of households, it is not, at face value, a viable source of child yield estimates, although it can identify differentials between dwelling types and tenures.
There is a role for the Census if discrete output areas can be determined to be mainly composed of ‘new’ dwellings. These areas should preferably be combined, even if not geographically contiguous, into clusters in order to get appropriate tabulations. It is highly likely that if tables relating to children by age groups, by number of rooms and by tenure were commissioned from ONS for individual output areas, the results would have difficulty with statistical disclosure control procedures and hence be relatively useless. Unfortunately, in London at the time of 2001 Census there were few newly developed or redeveloped sites large enough to ensure robust data for individual output areas, that average about 125 households.
An alternative possibility that will be pursued with ONS is to use newly created postcodes. Each postcode has a date of creation and it may be assumed that new postcodes relate to newly developed localities, although that assumption will need to be tested for areas within London. Work has already been done1 to merge the new
postcodes created since 1996 with the ONS 2001 Census postcode output showing total numbers of both residents and households. If Inner and Outer London clusters of new postcodes created since, say April 1998, can be created, it should be possible to get precisely the child yield tabulations required from the 2001 Census, albeit relating to total rooms available to a household rather than bedrooms. Conversion tables of rooms to bedrooms provided by the Survey of English Housing or the London Household Survey will provide useful indicators of how to adjust the Census tabulations.
2002 London Household Survey
The 2002 London Household Survey (LHS)2 reached over 8,000 households across
London in all boroughs. It was validated against data from the 2001 Census and the GLA’s rolled-forward population and household estimates for 2002. The LHS has the advantage of being able to present the age structure of the household population, by the numbers of both rooms and bedrooms and by a range of tenures. However, although a question was asked to determine the age of dwellings, the sample is too small to use to identify new developments. Fewer than 200 households in the sample were resident in property less than three years old.
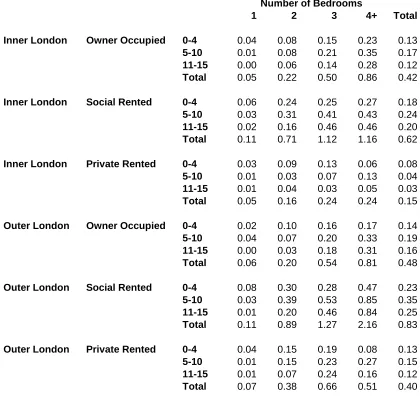
The basic child yield data from the 2002 LHS are shown in Table 1.
[image:6.595.89.509.278.696.2]
tal
Table 1: Child Yield by Age, Inner and Outer London, 2002
Number of Bedrooms
1 2 3 4+ To
Inner London Owner Occupied 0-4 0.04 0.08 0.15 0.23 0.13
5-10 0.01 0.08 0.21 0.35 0.17
11-15 0.00 0.06 0.14 0.28 0.12
Total 0.05 0.22 0.50 0.86 0.42
Inner London Social Rented 0-4 0.06 0.24 0.25 0.27 0.18
5-10 0.03 0.31 0.41 0.43 0.24
11-15 0.02 0.16 0.46 0.46 0.20
Total 0.11 0.71 1.12 1.16 0.62
Inner London Private Rented 0-4 0.03 0.09 0.13 0.06 0.08
5-10 0.01 0.03 0.07 0.13 0.04
11-15 0.01 0.04 0.03 0.05 0.03
Total 0.05 0.16 0.24 0.24 0.15
Outer London Owner Occupied 0-4 0.02 0.10 0.16 0.17 0.14
5-10 0.04 0.07 0.20 0.33 0.19
11-15 0.00 0.03 0.18 0.31 0.16
Total 0.06 0.20 0.54 0.81 0.48
Outer London Social Rented 0-4 0.08 0.30 0.28 0.47 0.23
5-10 0.03 0.39 0.53 0.85 0.35
11-15 0.01 0.20 0.46 0.84 0.25
Total 0.11 0.89 1.27 2.16 0.83
Outer London Private Rented 0-4 0.04 0.15 0.19 0.08 0.13
5-10 0.01 0.15 0.23 0.27 0.15
11-15 0.01 0.07 0.24 0.16 0.12
Total 0.07 0.38 0.66 0.51 0.40
2 See DMAG Briefing 2005/14 Guide to Accessing the LHS at the ESRC Data Archive, by Lovedeep Vaid,
The child yield values in relation to total numbers of children aged 0-15 in Owner
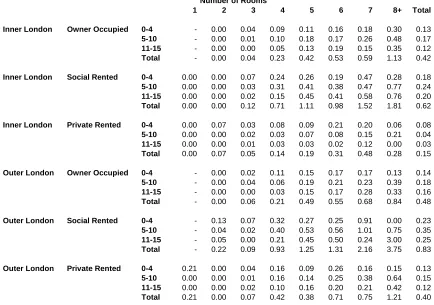
able 2 presents the same data on the basis of rooms, as defined by the 2001 Census.
should be noted that some of the cells in Table 2 relating to larger numbers of rooms Occupied households are quite close to those from the 1991 Labour Force Survey, though generally slightly lower. The child yield within the Social Rented sector is, in almost all cases, higher than the equivalent LA/HA data in the 1991 Labour Force Survey. The single exception is the lower rate for 4+ bedrooms in Inner London. Chart 1 shows the data relating to all children aged 0-15.
Chart 1: Child Yield (0-15) by Tenure, Inner and Outer London, LHS, 2002
0.00 0.50 1.00 1.50 2.00 2.50
1 2 3 4+
Number of Bedrooms
Children aged 0-15
Inner - OO Inner - Social Outer - OO Outer - Social
T
The general situation shown by these data is that as dwelling size increases, apart from there being more children in the household, the age profile of the children also gets older.
It
[image:7.595.101.475.186.421.2]Table 2: Child Yield by Age, Inner and Outer London, 2002
Number of Rooms
1 2 3 4 5 6 7 8+ Tot Inner London Owner Occupied 0-4 - 0.00 0.04 0.09 0.11 0.16 0.18 0.30 0.13
5-10 - 0.00 0.01 0.10 0.18 0.17 0.26 0.48 0.17
11-15 - 0.00 0.00 0.05 0.13 0.19 0.15 0.35 0.12
Total - 0.00 0.04 0.23 0.42 0.53 0.59 1.13 0.42
Inner London Social Rented 0-4 0.00 0.00 0.07 0.24 0.26 0.19 0.47 0.28 0.18
5-10 0.00 0.00 0.03 0.31 0.41 0.38 0.47 0.77 0.24
11-15 0.00 0.00 0.02 0.15 0.45 0.41 0.58 0.76 0.20
Total 0.00 0.00 0.12 0.71 1.11 0.98 1.52 1.81 0.62
Inner London Private Rented 0-4 0.00 0.07 0.03 0.08 0.09 0.21 0.20 0.06 0.08
5-10 0.00 0.00 0.02 0.03 0.07 0.08 0.15 0.21 0.04
11-15 0.00 0.00 0.01 0.03 0.03 0.02 0.12 0.00 0.03
Total 0.00 0.07 0.05 0.14 0.19 0.31 0.48 0.28 0.15
Outer London Owner Occupied 0-4 - 0.00 0.02 0.11 0.15 0.17 0.17 0.13 0.14
5-10 - 0.00 0.04 0.06 0.19 0.21 0.23 0.39 0.18
11-15 - 0.00 0.00 0.03 0.15 0.17 0.28 0.33 0.16
Total - 0.00 0.06 0.21 0.49 0.55 0.68 0.84 0.48
Outer London Social Rented 0-4 - 0.13 0.07 0.32 0.27 0.25 0.91 0.00 0.23
5-10 - 0.04 0.02 0.40 0.53 0.56 1.01 0.75 0.35
11-15 - 0.05 0.00 0.21 0.45 0.50 0.24 3.00 0.25
Total - 0.22 0.09 0.93 1.25 1.31 2.16 3.75 0.83
Outer London Private Rented 0-4 0.21 0.00 0.04 0.16 0.09 0.26 0.16 0.15 0.13
5-10 0.00 0.00 0.01 0.16 0.14 0.25 0.38 0.64 0.15
11-15 0.00 0.00 0.02 0.10 0.16 0.20 0.21 0.42 0.12
Total 0.21 0.00 0.07 0.42 0.38 0.71 0.75 1.21 0.40
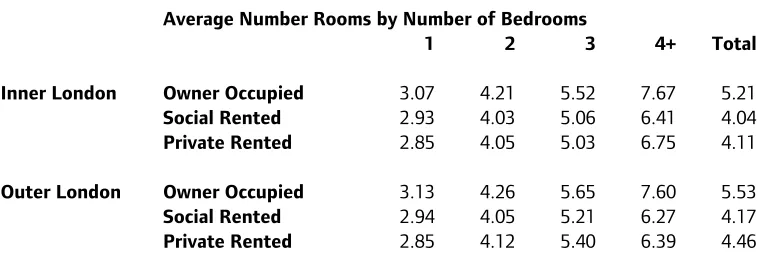
Table 3: Average Number of Rooms, Inner and Outer London, 2002
Average Number Rooms by Number of Bedrooms
1 2 3 4+ To
Inner London Owner Occupied 3.07 4.21 5.52 7.67 5.21
Social Rented 2.93 4.03 5.06 6.41 4.04
Private Rented 2.85 4.05 5.03 6.75 4.11
Outer London Owner Occupied 3.13 4.26 5.65 7.60 5.53
Social Rented 2.94 4.05 5.21 6.27 4.17
Private Rented 2.85 4.12 5.40 6.39 4.46
tal
Table 3 shows the relationships between the number of bedrooms and the average total number of rooms in each household type. It shows that generally the additional rooms available to a household are a little greater in Outer London for households with up to three bedrooms in all tenures. However, this situation is reversed for households with four of more bedrooms, as the average number of total rooms available is greater in Inner London for all three tenure categories. Significantly the average number of rooms available to households is much greater in Outer London, the differences are particularly noticeable for owner-occupiers (0.32 rooms or six per cent more space) and private renters (0.35 rooms or eight per cent more space). These average differences in space do not however compensate for the additional numbers of children in Outer London households.
Should the 2001 Census commissioned data, mentioned above, be made available the relationship between the number of rooms ands the number of bedrooms available to a household from the LHS will be able to crudely convert the Census data to more conventional child yield variables.
Wandsworth New Housing Survey 2004
This survey3 was the first for some time in London that focussed on new dwellings in a
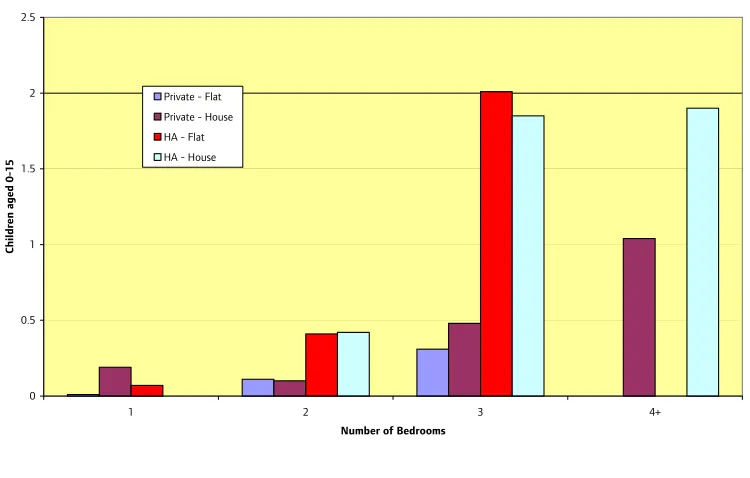
[image:10.595.97.472.488.727.2]borough, irrespective of whether they were in small or large developments. Questionnaires were sent to over 4,000 properties on over 120 sites that completed five or more units between 1997 and 2003. Over 2,000 forms (49 per cent) were returned. It is possible to get information based on nearly 1,800 dwellings on private developments (1,400 of which were flats, with nearly 1,000 containing two bedrooms) and a further 200 dwellings on housing association developments (over 100 of which were one and two-bedroom flats). The report of the survey offers child yield data for numbers of bedrooms up to 5+ and for ages of children: 0-2, 3-4, 5-10 and 11-15. Tables relate to Private and HA developments for all units and separately for flats and houses on those developments. Table 4 summarises the report’s tables for all children aged 0-15.
Table 4: Child Yield (0-15) in Wandsworth, 2004
Number of Bedrooms
1 2 3 4+ All
Private – all 0.01 0.11 0.42 0.98 0.22 Private – flats 0.01 0.11 0.31 0.00 0.10 Private – houses 0.19 0.10 0.48 1.04 0.60
HA – all 0.07 0.40 1.88 1.90 0.81
HA – flats 0.07 0.41 2.01 na 0.27
HA – houses na 0.42 1.85 1.90 1.57
The data for flats and houses are presented separately in Chart 2.
Chart 2: Child Yield (0-15) by Dwelling Type, Wandsworth, 2004
0 0.5 1 1.5 2 2.5
1 2 3 4+
Number of Bedrooms
Ch
ild
ren
aged 0-15
Private - Flat Private - House HA - Flat HA - House
3 New Housing Survey 2004. (LB Wandsworth, 2004) Available from Christine Pollard: 020 8871 7177 or
While Wandsworth may be atypical of boroughs, even of Inner London boroughs, the survey does present a body of evidence to compare to the 1991 LFS data. The key differences shown by the Wandsworth data are that:
• The scaled up LFS LA/HA results appear to be very high for all dwelling sizes except those with 2 bedrooms
• The pre-scaled LFS results for LA/HA are close to Wandsworth for one and two bedrooms
• Results for private accommodation are quite similar before the LFS results were scaled up
Table 5 characterises the age structure of the children by tenure and number of bedrooms. These figures may be compared with the latest ONS estimates of the age structure of Wandsworth’s child population that relate to mid-2003. The estimates showed that of the 0-15 year age group 40 per cent were aged 0-4, 35 per cent were aged 5-10 and 25 per cent were 11-15.
The survey report presents the data by age of child in the form of average number of persons by age per household, this has been presented here in terms of the percentage istribution of those children to offer direct comparability between tenures and dwelling
profile. The families in new two-edroom housing association accommodation most closely represented the borough chil r
d
sizes. Table 5 shows that the children in new private accommodation in Wandsworth had a much younger age profile, while the children in new housing association accommodation were slightly older than the borough
b
Table 5: Percentage Distribution of Children by Age in Wandsworth, 2004
Number of Bedrooms
1 2 3 4+ All
Private – 0-4 100 73 60 51 59
Private – 5-10 0 18 26 35 27
Private – 11-15 0 9 14 14 14
HA – 0-4 100 44 21 24 28
HA – 5-10 0 29 47 45 42
HA – 11-15 0 27 32 31 30
These results are also presented in Chart 3.
Chart 3: Distribution of Children by Age, percentages, Wandsworth, 2004
0% 20% 40% 60% 80% 100%
Private HA Private HA Private HA Private HA
1 2 3 4+
Number of Bedrooms and Tenure
0-4 5-10 11-15
Oxfordshire New Housing Survey
Another recent survey was carried out by Oxfordshire County Council in January 2004.4
While not relating to London or, in many cases, not even to an urban area, the results are a useful adjunct to the Wandsworth data and may be more representative of private dwellings in Outer London.
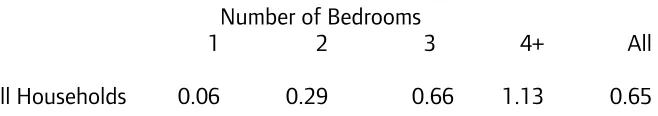
[image:13.595.124.453.365.423.2]The survey was distributed by post on 30 December 2003 to a sample of 3,300 addresses, out of nearly 12 thousand, that were new on the Council Tax registers in the county since 1 April 1999. Nearly 1,800 completed questionnaires were returned by 27 January 2004, over 1,500 of which were from the four ‘rural’ districts of Cherwell, South Oxfordshire, Vale of White Horse and West Oxfordshire. The remainder were from Oxford City. The responding households mostly contained two to four bedrooms, with over 400 in each of these categories. Over half of the responses came from households that had moved to the properties since the beginning of 2002. Over 60 per cent had previously lived in Oxfordshire and 4.5 per cent in London. The data are not split by tenure, but it is possible to get single years of age of all persons under the age of 20 and data for individual numbers of bedrooms up to 8. Table 6 summarises the main results for all children aged 0-15.
Table 6: Child Yield (0-15) in Oxfordshire, 2004
Number of Bedrooms
1 2 3 4+ All
All Households 0.06 0.29 0.66 1.13 0.65
These results are a little higher than those for private developments in Wandsworth, with the exception of one-bedroom households.
As the survey data were available in totally disaggregated form it was possible to calculate child yield by age and dwelling size. Table 7 shows the breakdown of the data presented above.
Table 7: Child Yield by Age in Oxfordshire, 2004
Number of Bedrooms
1 2 3 4+ All
Age 0-4 0.03 0.17 0.31 0.41 0.28
Age 5-10 0.01 0.08 0.21 0.41 0.22
Age 11-15 0.01 0.03 0.13 0.31 0.15
These data are presented in Chart 4.
4 Survey of people in new housing in Oxfordshire. Oxfordshire CC, 2004. Contact Margaret Melling,
Chart 4: Child Yield by Ages, Oxfordshire, 2004
0.00 0.05 0.10 0.15 0.20 0.25 0.30 0.35 0.40 0.45
1 2 3 4+
Number of Bedrooms
Num
ber of Children
0-4 5-10
[image:14.595.100.493.109.326.2]11-15
Table 8 characterises the age structure of the children by the number of bedrooms. These figures may be compared with the latest ONS estimates of the age structure of Oxfordshire’s child population that relate to mid-2003. These estimates showed that of the 0-15 year age group 30 per cent were aged 0-4, 37 per cent were aged 5-10 and 33 per cent were 11-15. Table 8 shows that the children in new accommodation in Oxfordshire had a much younger age profile. The families in new accommodation with four or more bedrooms most closely represented the county child profile.
These data may be compared to those for Wandsworth’s new private developments shown in Table 5. Oxfordshire has a much wider spread of the ages of children in all sizes of accommodation with significantly more aged 11-15. This may reflect the large proportion of flats in the Wandsworth sample. While the Oxfordshire survey did not collect data on the type of accommodation it is likely that the vast majority were houses.
Table 8: Percentage Distribution of Children by Age in Oxfordshire, 2004
Number of Bedrooms
1 2 3 4+ All
Age 0-4 45 60 48 36 43
Age 5-10 18 29 32 37 34
Age 11-15 36 11 20 27 23
These data are presented in Chart 5.
Chart 5: Distribution of Children by Age, Oxfordshire, 2004
0% 20% 40% 60% 80% 100%
1 2 3 4+
Number of Bedrooms
Summary
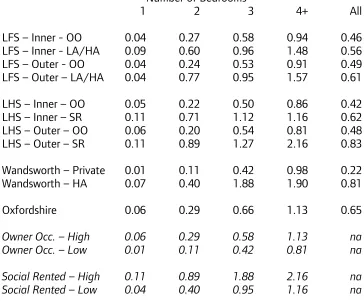
Table 9 summarises the data from the four surveys discussed in this Briefing. It focuses on all children aged 0-15 since this is the only comparator available for the 1991 LFS data that have already had much use by London boroughs.
Table 9: Child Yield (0-15), Summary of Survey Data
Number of Bedrooms
1 2 3 4+ All
LFS – Inner - OO 0.04 0.27 0.58 0.94 0.46 LFS – Inner - LA/HA 0.09 0.60 0.96 1.48 0.56
LFS – Outer - OO 0.04 0.24 0.53 0.91 0.49
LFS – Outer – LA/HA 0.04 0.77 0.95 1.57 0.61
LHS – Inner – OO 0.05 0.22 0.50 0.86 0.42
LHS – Inner – SR 0.11 0.71 1.12 1.16 0.62
LHS – Outer – OO 0.06 0.20 0.54 0.81 0.48
LHS – Outer – SR 0.11 0.89 1.27 2.16 0.83
Wandsworth – Private 0.01 0.11 0.42 0.98 0.22
Wandsworth – HA 0.07 0.40 1.88 1.90 0.81
Oxfordshire 0.06 0.29 0.66 1.13 0.65
Owner Occ. – High 0.06 0.29 0.58 1.13 na
Owner Occ. – Low 0.01 0.11 0.42 0.81 na
Social Rented – High 0.11 0.89 1.88 2.16 na
Social Rented – Low 0.04 0.40 0.95 1.16 na
Note: Oxfordshire data is assumed to be all Owner Occupied for the sake of summary statistics.
The child yield in owner occupied dwellings is quite similar across all surveys, although the predominance of flats in the Wandsworth survey tends to produce the lowest child yield levels for one, two and three bedrooms. The highest values tend to be found in the Oxfordshire survey, where the majority of households are probably in houses rather than flats. The LFS and LHS data, which covered households in all accommodation, whether new or old, show child yield levels only a little below those found in Oxfordshire.
Within the social rented sector, which includes the data labelled HA or LA/HA in some of the surveys, the range of results is much wider. Wandsworth is the only survey to focus specifically on new dwellings in this sector, and its results include one lowest value (two bedrooms) and one highest value (three bedrooms). The LHS provides both the highest and lowest values for 4+ bedrooms.
[image:16.595.88.452.190.492.2]The results of the new dwellings surveys in Wandsworth and Oxfordshire imply that the attempt to compensate the original 1991 LFS data by assuming that there should be two children in Inner London LA/HA three bedroom stock may have been well-meaning and could have been accurate and relevant a decade ago, but it almost certainly caused overestimates in the adjusted data for owner occupied stock and should, clearly, be no longer used if other surveys with suitable attributes are available.
Appendix: The Estimation of ‘Child Yield’ for New Dwellings
(extracted from original note by Ian McCallum)
Work commissioned by the London Research Centre (LRC) from the Department of the Environment and derived from the 1991 Labour Force Survey (LFS) established the numbers of children (aged from 0 to 15) in dwellings with between one and four or more bedrooms in Inner and Outer London for both private and local authority housing.
The LFS showed that for local authority or housing association households in Inner London the average home with three bedrooms yielded 0.957 children. This survey, because it was not confined to new housing stock and included dwellings with the full range of households: one person, elderly couples, those with children all aged 16 or older; underestimates the potential impact of ‘child yield’ from new housing provision.
In the light of the policy of allocating families with two or more children to new LA or HA dwellings with three bedrooms, the findings of the LFS were scaled up by a factor to yield 2.0 children per LA or HA dwelling with three bedrooms in Inner London. This factor was then applied to the remaining data to provide the following table.
Child Yield for Dwellings in Inner and Outer London
Number of Bedrooms
1 2 3 4+ All
Inner London
Owner Occupied - LFS 0.042 0.269 0.575 0.942 0.457 Owner Occupied - scaled 0.088 0.562 1.202 1.969 0.955
LA or HA – LFS 0.093 0.597 0.957 1.478 0.556 LA or HA – scaled 0.194 1.248 2.000 3.089 1.162
Outer London
Owner Occupied - LFS 0.049 0.236 0.532 0.914 0.494 Owner Occupied - scaled 0.102 0.493 1.112 1.910 1.031
Regular Briefings from the GLA Data Management and Analysis Group
Recent DMAG Briefings:
DMAG 2005/1 County of Birth and Labour Market Outcomes Lorna Spence
DMAG 2005/2 2001 Census: London Country of Birth Profiles Giorgio Finella
DMAG 2005/3 2001 Census: Economic Activity in London Giorgio Finella
DMAG 2005/4 2001 Census Profiles: Pakistanis in London Gareth Piggott
DMAG 2005/5 Indices of Deprivation 2004: Ward analysis Lovedeep Vaid
DMAG 2005/6 London – The World in a City Marian
Mackintosh
DMAG 2005/7 Claimant Count Model: Technical Note Lorna Spence/
Georgia Hay
DMAG 2005/8 London Pupil Dataset David Ewens
DMAG 2005/9 Borough Fertility Rates 2000-02 John Hollis/
Georgia Hay
DMAG 2005/10 Borough Life Tables 2000-02 John Hollis/
Georgia Hay
DMAG 2005/11 Demography Team Workplan 2005-06 John Hollis
DMAG 2005/12 Ethnic Diversity Indices Baljit Bains
DMAG 2005/13 London Borough and Sub-Regional Demographic Profiles (2003) Georgia Hay
DMAG 2005/14 Guide to accessing the LHS at the ESRC Data Archive Lovedeep Vaid
DMAG 2005/15 GLA Ward Population Projection Manual Georgia Hay
DMAG 2005/16 Income Poverty in London: 2003/04 Lovedeep Vaid
DMAG 2005/17 Focus on London's Demography John Hollis
DMAG 2005/18 Census Information Note 2005-1 Eileen Howes
DMAG 2005/19 2001 Census: London Country of Birth Profiles – The Arab League Giorgio Finella
DMAG 2005/20 Benefits 1: Income Support Lovedeep Vaid
DMAG 2005/21 Transgenerational Ethnicity Baljit Bains/
John Hollis
DMAG 2005/22 Work Rich and Work Poor Households Lorna Spence
DMAG 2005/23 2001 Census Economic Activity Rates Georgia Hay
DMAG 2005/24 Ward Risks of Population Change John Hollis
Contact details for the Data Management and Analysis Group are as
follows:
Rob Lewis (020 7983 4652) is Head of the Data Management and Analysis Group.
Bill Armstrong (020 7983 4653) works in the Census Team with particular responsibilities for commissioned tables, workplace data and mapping. [email protected]
Baljit Bains (020 7983 4613) works in the Demography Team and is responsible for ethnic demography, including ethnic group projections. [email protected]
Gareth Baker (020 7983 4965) works on GIS issues. [email protected]
Shen Cheng (020 7983 4889) works on Education data and is responsible for school roll projections. [email protected] (maternity leave until early 2006)
David Ewens (020 7983 4656) is responsible for Education research and data analysis.
Giorgio Finella (020 7983 4328) works in the Census Team. [email protected]
Dennis Grenham (020 7983 4532) works mostly on statistical compendia, election statistics and special publications. [email protected]
Georgia Hay (020 7983 4347) works in the Demography Team and is responsible for ward level projections, the Demography Extranet and borough liaison. [email protected]
John Hollis (020 7983 4604) is responsible for the work of the Demography Team and the Social Exclusion Team, and particularly for demographic modelling. [email protected]
Eileen Howes (020 7983 4657) is responsible for the work of the Census Team and the SASPAC
project. [email protected]
Ed Klodawski (020 7983 4694) works in the Demography Team. His post is joint with the London Health Observatory and specialisesin ethnic and health issues. [email protected]
Rachel Leeser (020 7983 4699) works in the Social Exclusion Team with particular responsibilities for indicators and income data. [email protected] (maternity leave until late 2005)
Alan Lewis (020 7983 4348) works on the SASPAC project. [email protected]
Jackie Maguire (020 7983 4655) is responsible to the Group Head and co-ordinates the administrative and financial work of the Group. [email protected]
Michael Minors (020 7983 4654) is responsiblefor the work of the General Statistics, Education, and GIS team. [email protected]
Karen Osborne (020 7983 4889) works on Education data and is responsible for school roll projections. [email protected] (maternity cover until early 2006)
Gareth Piggott (020 7983 4327) works in the Census Team. [email protected]
Lorna Spence (020 7983 4658) is a member of the Social Exclusion Team, with particular
responsibilities for the Labour Force Survey and benefits data. [email protected]
Lovedeep Vaid (020 7983 4699) works in the Social Exclusion Team with particular responsibilities for indicators and income data. [email protected] (maternity cover until late 2005)