First Release
LEARNING AND TRAINING AT WORK 2002
INTRODUCTION
This Statistical First Release presents figures on key indicators of employers’ commitment to training, including the management and delivery of training, the levels of provision of both off-the-job and on-the-job training, and also the awareness of, and involvement with, various training initiatives.
KEY POINTS
Most employers provide training for at least some of their employees.
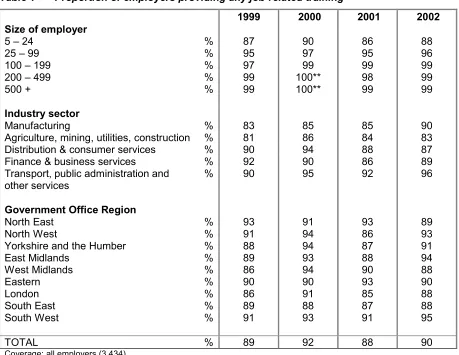
• Nine out of ten employers (90 per cent) had provided any job-related training (either off- or on-the-job training) to their employees in the 12 months prior to the interview. This is consistent with the findings of previous years.
More employers are providing off-the-job training. They are training a greater proportion of their employees but for shorter periods of time.
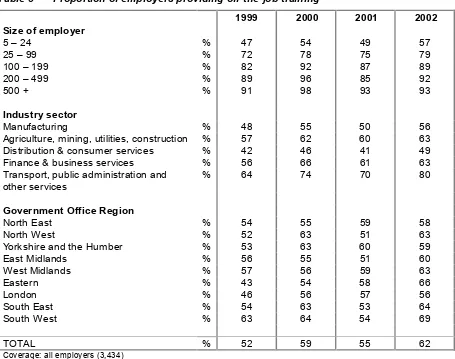
• More than six out of ten employers (62 per cent) had provided off-the-job training to their employees in 2002. This is a significant increase on the 55 per cent found in 2001, but similar to the 59 per cent found in 2000. In SFR 02/2003
23 January 2003
Coverage: England
Theme: Education and Training
Issued by
Department for Education and Skills
Sanctuary Buildings Great Smith Street London SW1P 3BT
Telephone: Press Office 020 7925 6789 Public Enquiries 0870 000 2288
Statistician Bruce Byrne 0114 259 3374
Internet
2
• The survey found that the provision of job-related training increases with increasing size of employer; 57 per cent of employers with 5-24 employees provided off-the-job training compared with 93 per cent of employers with 500 or more employees.
• The proportion of employees receiving off-the-job training over the previous 12 months is increasing over time – 31 per cent in 2002, compared with 28 per cent in 2001, 27 per cent in 2000 and 23 per cent in 1999.
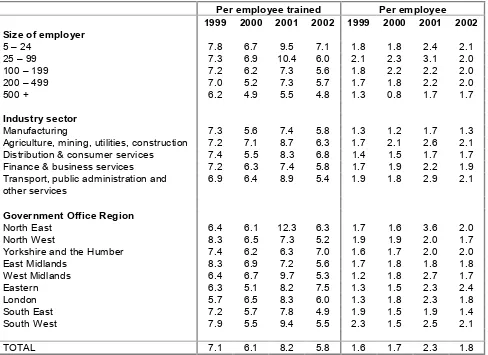
• However, the average amount of off-the-job training provided per employee (1.8 days) has decreased from 2001 (2.3 days). This year’s figure is more similar to the 1.7 days found in 2000 and the 1.6 days found in 1999. This is because the rise in the proportion of employees who train has been offset by a fall in the amount of training undertaken by each trainee.
Looking just at those establishments having employees who undertook off-the-job training:
• Just over half (52 per cent) reported that some of the training was leading to a formal qualification – a slight decline compared to the 55 per cent of 2001 and the 56 per cent of 2000, but the same as the figure for 1999.
• The majority (84 per cent) included some form of Health and Safety training - more than any other training type.
The provision of on-the-job training has also increased.
• More than four out of five employers (82 per cent) provided on-the-job training for their employees in 2002. This is an increase on the 78 per cent found in 2001, but is similar to the 83 per cent found in 2000. In 1999 the figure was 79 per cent.
Employers reported that training had a positive effect on labour productivity and profit margins.
• Two thirds (66 per cent) of employers who had provided any training over the previous twelve months reported that this training had led to an increase in labour productivity. However, for small establishments with 5 – 24 employees, positive effects were less common (64 per cent) than for larger establishments (71 – 77 per cent).
A minority of employers do not feel that training is necessary, although some help their employees to learn through other means.
• Of those employers that did not provide any job-related training, the main reason given for not doing so was that the existing skills of employees meet the needs of the establishment (66 per cent). The only other reasons mentioned by more than 10 per cent of employers was that employees learn from experience (13 per cent) and that new recruits are sufficient to obtain the skills required (12 per cent).
• Of those employers who did not provide any job-related training, a third (33 per cent) had helped some of their employees to learn through one or more specific activity. This was most commonly through attending conferences, workshops, lectures or seminars.
Awareness of NVQs remains steady, but more employers are offering them to employees than in previous years.
• As in earlier years, NVQs are the initiative with the highest level of awareness, with 95 per cent of employers having heard of them.
4
DEFINITIONS
Off-the-job training includes all training away from the immediate work position. It can be given at the employers’ premises or elsewhere. It includes all sorts of courses - full or part time; correspondence or distance learning, Health and Safety and so on - as long as it is funded or arranged by the employer.
On-the-job training is undertaken at the desk or place where the person usually works.
TABLES
All tables are broken down by size, industry sector and region unless otherwise stated. All data shown in this Statistical First Release are weighted data. Where the responses are not based on the whole sample, the unweighted sample size is shown at the foot of the table to indicate the number of employers on whose responses the results are based. An asterisk (*) has been used to signify a percentage of less than 0.5 per cent and a ‘-‘ to indicate that a percentage is zero. 100** has been used to signify a
percentage above 99.5 per cent and ‘..’ signifies a figure that was based on a small number of respondents and has been suppressed.
Table 1: Proportion of employers providing any job-related training Table 2: Type of training provided
Table 3: Proportion of employers providing off-the-job training Table 4: Proportion of employees receiving off-the-job training
Table 5: Average number of off-the-job training days per employee trained and per employee
Table 6: Types of off-the-job training provided by employers
Table 7: Proportion of employers providing off-the-job training leading to a formal qualification
Table 8: Allocation of staff and resources for providing off-the-job training Table 9: Proportion of employers providing on-the-job training
Table 10: Existence of Business, Training, Human Resource Plans and Budgets Table 11: Investor in People Recognition
Table 12: Awareness of training initiatives
Table 14: Organisations links built with, in order to offer employees training and development opportunities
Tables 15a, b: Perceived impact of training on measures of performance
Table 16: Proportion of existing staff who are fully proficient at their current job Table 17: Changes introduced by employers in the last year
NOTES TO EDITORS
The findings are based upon the results of the Learning and Training at Work (LTW) 2002 survey, carried out from September to November 2002 amongst a sample of all employers in England. Interviews were carried out at an establishment level and cover all employers regardless of their size or industry sector– with the exception of schools and Local Education Authorities. A total of 4,010 interviews were obtained, of which 3,434 were with employers having 5 or more employees and are presented here. The overall response rate was 62%.
Results from the survey have been weighted up to population estimates based upon the Inter Departmental Business Register (IDBR). The first LTW survey was carried out in 1999 with subsequent surveys in 2000 and 2001.
Data for employers with 1-4 employees were also collected in the survey. Although not presented in this SFR, results for those employers along with the full results from the survey will be included in the Research Report to be published in March 2003.
ENQUIRIES
Enquiries about the figures contained in this Press Release should be addressed to: Bruce Byrne, Analytical Services, Department for Education and Skills, Moorfoot, Sheffield. S1 4PQ. Telephone: 0114 259 3374.
Press Enquiries should be addressed to 020 7925 6789.
A National Statistics publication
National Statistics are produced to high professional standards set out in the National Statistics Code of Practice. They undergo regular quality assurance reviews to ensure that they meet customer needs. They are produced free from any political interference.
For general enquiries about National Statistics contact: The National Statistics Public Enquiry Service
Telephone: 020 7533 5888 Minicom: 01633 812399 E-mail : [email protected] Fax: 01633 652747
Letters: Room DG/18, 1 Drummond Gate, London. SW1V 2QQ
6
Table 1 Proportion of employers providing any job-related training
Size of employer
1999 2000 2001 2002
5 – 24 % 87 90 86 88
25 – 99 % 95 97 95 96
100 – 199 % 97 99 99 99
200 – 499 % 99 100** 98 99
500 + % 99 100** 99 99
Industry sector
Manufacturing % 83 85 85 90
Agriculture, mining, utilities, construction % 81 86 84 83 Distribution & consumer services % 90 94 88 87
Finance & business services % 92 90 86 89 Transport, public administration and
other services
% 90 95 92 96
Government Office Region
North East % 93 91 93 89
North West % 91 94 86 93
Yorkshire and the Humber % 88 94 87 91
East Midlands % 89 93 88 94
West Midlands % 86 94 90 88
Eastern % 90 90 93 90
London % 86 91 85 88
South East % 89 88 87 88
South West % 91 93 91 95
TOTAL % 89 92 88 90
Coverage: all employers (3,434)
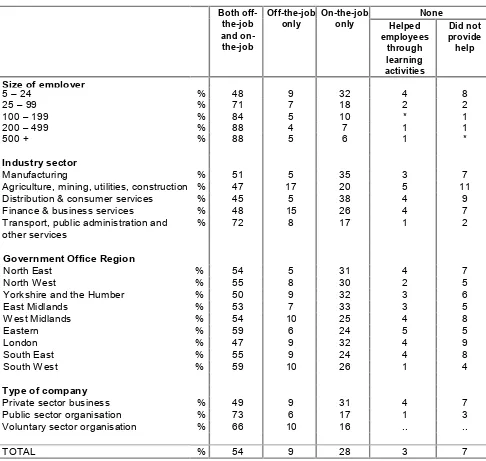
Table 2 Type of training provided
None Both
off-the-job and on-the-job
Off-the-job
only On-the-job only Helped employees
through learning activities
Did not provide help
Size of employer
5 – 24 % 48 9 32 4 8
25 – 99 % 71 7 18 2 2
100 – 199 % 84 5 10 * 1
200 – 499 % 88 4 7 1 1
500 + % 88 5 6 1 *
Industry sector
Manufacturing % 51 5 35 3 7
Agriculture, mining, utilities, construction % 47 17 20 5 11 Distribution & consumer services % 45 5 38 4 9 Finance & business services % 48 15 26 4 7 Transport, public administration and
other services
% 72 8 17 1 2
Government Office Region
North East % 54 5 31 4 7
North West % 55 8 30 2 5
Yorkshire and the Humber % 50 9 32 3 6
East Midlands % 53 7 33 3 5
West Midlands % 54 10 25 4 8
Eastern % 59 6 24 5 5
London % 47 9 32 4 9
South East % 55 9 24 4 8
South West % 59 10 26 1 4
Type of company
Private sector business % 49 9 31 4 7 Public sector organisation % 73 6 17 1 3 Voluntary sector organisation % 66 10 16 .. ..
TOTAL % 54 9 28 3 7
8
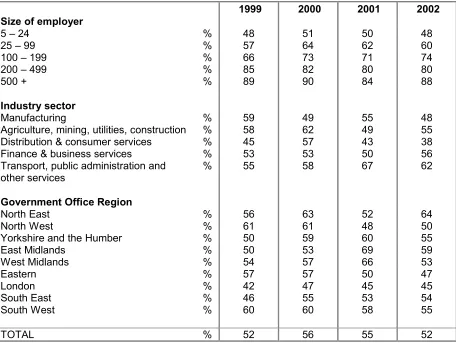
Table 3 Proportion of employers providing off-the-job training
Size of employer
1999 2000 2001 2002
5 – 24 % 47 54 49 57
25 – 99 % 72 78 75 79
100 – 199 % 82 92 87 89
200 – 499 % 89 96 85 92
500 + % 91 98 93 93
Industry sector
Manufacturing % 48 55 50 56
Agriculture, mining, utilities, construction % 57 62 60 63 Distribution & consumer services % 42 46 41 49 Finance & business services % 56 66 61 63 Transport, public administration and
other services
% 64 74 70 80
Government Office Region
North East % 54 55 59 58
North West % 52 63 51 63
Yorkshire and the Humber % 53 63 60 59
East Midlands % 56 55 51 60
West Midlands % 57 56 59 63
Eastern % 43 54 58 66
London % 46 56 57 56
South East % 54 63 53 64
South West % 63 64 54 69
TOTAL % 52 59 55 62
Table 4 Proportion of employees receiving off-the-job training
Size of employer
1999 2000 2001 2002
5 – 24 % 23 27 25 29
25 – 99 % 29 33 30 33
100 – 199 % 25 36 31 36
200 – 499 % 25 35 31 35
500 + % 20 17 31 35
Industry sector
Manufacturing % 18 22 23 23
Agriculture, mining, utilities, construction % 23 30 30 33 Distribution & consumer services % 19 26 20 24 Finance & business services % 23 30 30 32 Transport, public administration and
other services
% 28 29 33 39
Government Office Region
North East % 26 26 29 33
North West % 23 29 28 32
Yorkshire and the Humber % 21 27 31 29
East Midlands % 20 26 25 32
West Midlands % 19 26 28 32
Eastern % 20 29 28 32
London % 23 28 28 30
South East % 26 26 25 29
South West % 29 28 26 38
TOTAL % 23 27 28 31
10
Table 5 Average number of off-the-job training days per employee trained and per employee
Per employee trained Per employee
1999 2000 2001 2002 1999 2000 2001 2002 Size of employer
5 – 24 7.8 6.7 9.5 7.1 1.8 1.8 2.4 2.1 25 – 99 7.3 6.9 10.4 6.0 2.1 2.3 3.1 2.0 100 – 199 7.2 6.2 7.3 5.6 1.8 2.2 2.2 2.0 200 – 499 7.0 5.2 7.3 5.7 1.7 1.8 2.2 2.0 500 + 6.2 4.9 5.5 4.8 1.3 0.8 1.7 1.7
Industry sector
Manufacturing 7.3 5.6 7.4 5.8 1.3 1.2 1.7 1.3 Agriculture, mining, utilities, construction 7.2 7.1 8.7 6.3 1.7 2.1 2.6 2.1 Distribution & consumer services 7.4 5.5 8.3 6.8 1.4 1.5 1.7 1.7 Finance & business services 7.2 6.3 7.4 5.8 1.7 1.9 2.2 1.9 Transport, public administration and
other services
6.9 6.4 8.9 5.4 1.9 1.8 2.9 2.1
Government Office Region
North East 6.4 6.1 12.3 6.3 1.7 1.6 3.6 2.0 North West 8.3 6.5 7.3 5.2 1.9 1.9 2.0 1.7 Yorkshire and the Humber 7.4 6.2 6.3 7.0 1.6 1.7 2.0 2.0 East Midlands 8.3 6.9 7.2 5.6 1.7 1.8 1.8 1.8 West Midlands 6.4 6.7 9.7 5.3 1.2 1.8 2.7 1.7 Eastern 6.3 5.1 8.2 7.5 1.3 1.5 2.3 2.4 London 5.7 6.5 8.3 6.0 1.3 1.8 2.3 1.8 South East 7.2 5.7 7.8 4.9 1.9 1.5 1.9 1.4 South West 7.9 5.5 9.4 5.5 2.3 1.5 2.5 2.1
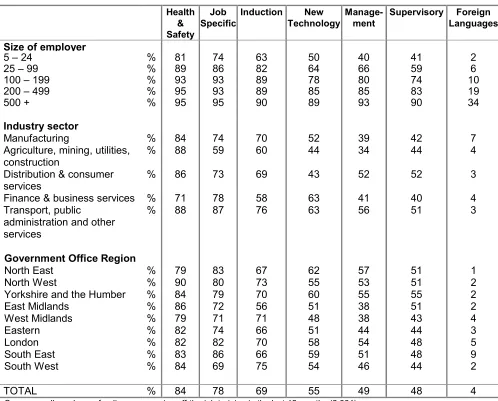
Table 6 Types of off-the-job training provided by employers
Health & Safety
Job
Specific Induction TechnologyNew Manage-ment Supervisory LanguagesForeign
Size of employer
5 – 24 % 81 74 63 50 40 41 2
25 – 99 % 89 86 82 64 66 59 6
100 – 199 % 93 93 89 78 80 74 10 200 – 499 % 95 93 89 85 85 83 19
500 + % 95 95 90 89 93 90 34
Industry sector
Manufacturing % 84 74 70 52 39 42 7 Agriculture, mining, utilities,
construction
% 88 59 60 44 34 44 4
Distribution & consumer services
% 86 73 69 43 52 52 3
Finance & business services % 71 78 58 63 41 40 4 Transport, public
administration and other services
% 88 87 76 63 56 51 3
Government Office Region
North East % 79 83 67 62 57 51 1 North West % 90 80 73 55 53 51 2 Yorkshire and the Humber % 84 79 70 60 55 55 2 East Midlands % 86 72 56 51 38 51 2 West Midlands % 79 71 71 48 38 43 4
Eastern % 82 74 66 51 44 44 3
London % 82 82 70 58 54 48 5
South East % 83 86 66 59 51 48 9 South West % 84 69 75 54 46 44 2
TOTAL % 84 78 69 55 49 48 4
12
Table 7 Proportion of employers offering off-the-job training leading to a formal qualification
Size of employer
1999 2000 2001 2002
5 – 24 % 48 51 50 48
25 – 99 % 57 64 62 60
100 – 199 % 66 73 71 74
200 – 499 % 85 82 80 80
500 + % 89 90 84 88
Industry sector
Manufacturing % 59 49 55 48
Agriculture, mining, utilities, construction % 58 62 49 55 Distribution & consumer services % 45 57 43 38 Finance & business services % 53 53 50 56 Transport, public administration and
other services
% 55 58 67 62
Government Office Region
North East % 56 63 52 64
North West % 61 61 48 50
Yorkshire and the Humber % 50 59 60 55
East Midlands % 50 53 69 59
West Midlands % 54 57 66 53
Eastern % 57 57 50 47
London % 42 47 45 45
South East % 46 55 53 54
South West % 60 60 58 55
TOTAL % 52 56 55 52
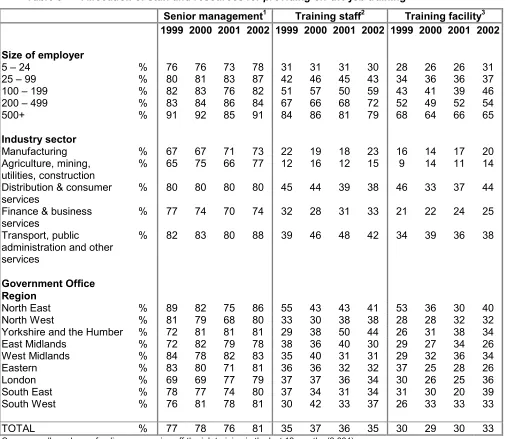
Table 8 Allocation of staff and resources for providing off-the-job training
Senior management1 Training staff2 Training facility3 1999 2000 2001 2002 1999 2000 2001 2002 1999 2000 2001 2002
Size of employer
5 – 24 % 76 76 73 78 31 31 31 30 28 26 26 31 25 – 99 % 80 81 83 87 42 46 45 43 34 36 36 37 100 – 199 % 82 83 76 82 51 57 50 59 43 41 39 46 200 – 499 % 83 84 86 84 67 66 68 72 52 49 52 54 500+ % 91 92 85 91 84 86 81 79 68 64 66 65
Industry sector
Manufacturing % 67 67 71 73 22 19 18 23 16 14 17 20 Agriculture, mining,
utilities, construction
% 65 75 66 77 12 16 12 15 9 14 11 14
Distribution & consumer services
% 80 80 80 80 45 44 39 38 46 33 37 44
Finance & business services
% 77 74 70 74 32 28 31 33 21 22 24 25
Transport, public
administration and other services
% 82 83 80 88 39 46 48 42 34 39 36 38
Government Office Region
North East % 89 82 75 86 55 43 43 41 53 36 30 40 North West % 81 79 68 80 33 30 38 38 28 28 32 32 Yorkshire and the Humber % 72 81 81 81 29 38 50 44 26 31 38 34 East Midlands % 72 82 79 78 38 36 40 30 29 27 34 26 West Midlands % 84 78 82 83 35 40 31 31 29 32 36 34 Eastern % 83 80 71 81 36 36 32 32 37 25 28 26 London % 69 69 77 79 37 37 36 34 30 26 25 36 South East % 78 77 74 80 37 34 31 34 31 30 20 39 South West % 76 81 78 81 30 42 33 37 26 33 33 33
TOTAL % 77 78 76 81 35 37 36 35 30 29 30 33 Coverage: all employers funding or arranging off-the-job training in the last 12 months (2,664)
Note: (1) Have someone at senior management level responsible for training (2) Employ staff to design and teach training courses
14
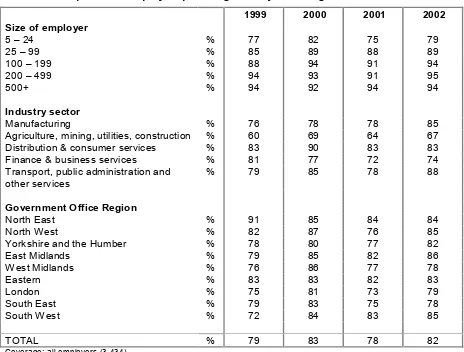
Table 9 Proportion of employers providing on-the-job training
Size of employer
1999 2000 2001 2002
5 – 24 % 77 82 75 79
25 – 99 % 85 89 88 89
100 – 199 % 88 94 91 94
200 – 499 % 94 93 91 95
500+ % 94 92 94 94
Industry sector
Manufacturing % 76 78 78 85
Agriculture, mining, utilities, construction % 60 69 64 67 Distribution & consumer services % 83 90 83 83 Finance & business services % 81 77 72 74 Transport, public administration and
other services
% 79 85 78 88
Government Office Region
North East % 91 85 84 84
North West % 82 87 76 85
Yorkshire and the Humber % 78 80 77 82 East Midlands % 79 85 82 86 West Midlands % 76 86 77 78
Eastern % 83 83 82 83
London % 75 81 73 79
South East % 79 83 75 78
South West % 72 84 83 85
TOTAL % 79 83 78 82
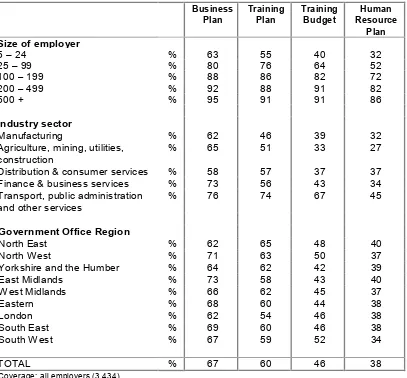
Table 10 Existence of Business, Training, Human Resource Plans and Budgets
Business
Plan Training Plan Training Budget Resource Human Plan
Size of employer
5 – 24 % 63 55 40 32
25 – 99 % 80 76 64 52
100 – 199 % 88 86 82 72
200 – 499 % 92 88 91 82
500 + % 95 91 91 86
Industry sector
Manufacturing % 62 46 39 32
Agriculture, mining, utilities, construction
% 65 51 33 27
Distribution & consumer services % 58 57 37 37 Finance & business services % 73 56 43 34 Transport, public administration
and other services
% 76 74 67 45
Government Office Region
North East % 62 65 48 40 North West % 71 63 50 37 Yorkshire and the Humber % 64 62 42 39 East Midlands % 73 58 43 40 West Midlands % 66 62 45 37
Eastern % 68 60 44 38
London % 62 54 46 38
South East % 69 60 46 38 South West % 67 59 52 34
TOTAL % 67 60 46 38
Coverage: all employers (3,434)
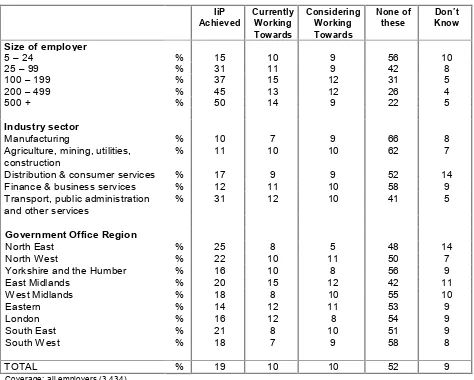
[image:15.612.82.489.76.454.2]16 Table 11 Investor in People Recognition
IiP
Achieved CurrentlyWorking Towards
Considering Working Towards
None of
these Know Don’t
Size of employer
5 – 24 % 15 10 9 56 10
25 – 99 % 31 11 9 42 8
100 – 199 % 37 15 12 31 5
200 – 499 % 45 13 12 26 4
500 + % 50 14 9 22 5
Industry sector
Manufacturing % 10 7 9 66 8
Agriculture, mining, utilities, construction
% 11 10 10 62 7
Distribution & consumer services % 17 9 9 52 14 Finance & business services % 12 11 10 58 9 Transport, public administration
and other services
% 31 12 10 41 5
Government Office Region
North East % 25 8 5 48 14
North West % 22 10 11 50 7
Yorkshire and the Humber % 16 10 8 56 9
East Midlands % 20 15 12 42 11
West Midlands % 18 8 10 55 10
Eastern % 14 12 11 53 9
London % 16 12 8 54 9
South East % 21 8 10 51 9
South West % 18 7 9 58 8
TOTAL % 19 10 10 52 9
[image:16.612.75.549.73.453.2]Table 12 Awareness of training initiatives
NVQs/ SVQs
FMAs AMAs Progress
File / NRA
New Deal New Deal for Young People
New Deal for Long Term Unemployed
Time off for Study or Training Learning Partner-ships Other gov’t supported training for young people Union Learning Fund
Size of employer
5 – 24 % 94 42 55 33 55 46 40 38 52 25 7
25 – 99 % 98 51 64 41 68 56 49 49 64 29 12
100 – 199 % 100 63 71 47 79 69 63 61 77 36 14
200 – 499 % 99 71 82 49 83 72 71 67 75 35 23
500+ % 99 76 83 50 87 75 70 71 82 32 32
Industry sector
Manufacturing % 95 42 60 30 58 46 43 34 53 21 9
Agriculture, mining, utilities, construction
% 96 45 61 29 52 43 39 36 44 22 7
Distribution & consumer services
% 93 43 56 37 52 42 37 34 49 21 8
Finance & business services % 95 40 53 30 59 48 43 46 50 28 7
Transport, public administration & other services
% 97 50 60 41 68 62 50 52 71 31 11
Government Office Region
North East % 97 56 67 33 70 68 61 47 52 28 9
North West % 97 47 70 43 65 53 49 46 59 25 8
Yorkshire and the Humber % 93 53 56 38 62 50 44 40 58 27 13
East Midlands % 100** 50 63 45 55 49 43 44 64 26 9
West Midlands % 96 46 57 30 62 50 41 40 58 28 8
Eastern % 98 40 63 36 53 44 42 40 49 26 6
London % 86 37 39 30 50 42 34 37 49 21 6
South East % 99 39 54 28 57 47 38 44 58 22 11
South West % 96 48 63 43 65 55 49 35 52 32 9
TOTAL % 95 45 57 35 58 49 43 41 55 25 9
Coverage: all employers (3,434)
[image:17.612.42.773.93.516.2]Table 13 Proportion of employers offering NVQs/SVQs
Size of employer 1999 2000 2001 2002
5 – 24 % 27 27 30 34
25 – 99 % 42 39 48 50
100 – 199 % 51 53 53 56
200 – 499 % 65 63 57 62
500+ % 76 69 69 71
Industry Sector
Manufacturing % 24 26 28 31
Agriculture, mining, utilities, construction % 34 30 36 43 Distribution & consumer services % 29 28 33 37 Finance & business services % 22 20 21 21 Transport, public admin and other
services
% 39 42 46 53
Government Office Region
North East % 37 39 44 54
North West % 34 30 34 41
Yorkshire and the Humber % 28 31 51 43
East Midlands % 36 30 39 43
West Midlands % 33 36 39 46
Eastern % 34 30 33 36
London % 12 19 20 23
South East % 29 30 23 35
South West % 43 30 44 41
TOTAL % 30 31 34 38
[image:18.612.82.539.74.423.2]Table 14 Organisations links built with in order to offer employees training and development opportunities
Universities / Other HE
establish-ments
Further Education
establish-ments
Schools NTOs Learning
Partner-ships
Sector Skills Councils
LSCs / TECs
UfI1 Trade
Unions
Any of those listed
Size of employer % % % % % % % % % %
5 – 24 % 19 25 17 20 15 5 8 4 4 50
25 – 99 % 36 42 34 37 26 11 19 8 10 73
100 – 199 % 53 58 45 45 33 19 33 17 22 87
200 – 499 % 66 66 46 46 38 27 41 21 30 90
500+ % 77 77 59 58 52 37 52 35 43 95
Industry Sector
Manufacturing % 25 31 21 23 12 6 10 5 5 57
Agriculture, mining, utilities & construction
% 16 32 19 33 10 9 12 3 6 63
Distribution & consumer services
% 12 17 14 15 11 3 4 1 3 41
Finance & business services % 25 21 16 22 11 5 8 5 3 54
Transport, public admin & other services
% 39 49 35 35 35 11 23 11 12 74
Government Office Region
North East % 36 41 23 37 28 13 16 9 11 61
North West % 28 34 21 27 19 5 10 3 7 62
Yorkshire and the Humber % 26 33 21 23 18 8 12 6 12 61
East Midlands % 20 33 24 30 24 10 14 6 5 57
West Midlands % 17 27 20 25 16 7 14 5 8 53
Eastern % 22 26 27 23 18 9 9 6 4 57
London % 22 22 11 21 17 6 10 5 4 48
South East % 23 25 25 17 12 5 11 5 5 51
South West % 24 37 25 29 18 2 11 6 4 66
TOTAL % 24 29 21 24 18 7 11 5 6 56
Coverage: all employers (3,434)
[image:19.612.48.751.102.511.2]Table 15a Perceived impact of training on labour productivity
Large
increase increase Small difference No decrease Small decrease Large Don’t know
Size of employer
5 – 24 % 22 42 28 2 - 6
25 – 99 % 26 45 21 1 - 7
100 – 199 % 26 45 16 1 - 12
200 – 499 % 31 46 13 1 - 9
500 + % 28 46 10 * * 15
Industry sector
Manufacturing % 19 45 29 1 - 6
Agriculture, mining, utilities, construction
% 13 42 38 4 - 4
Distribution & consumer services
% 24 43 26 2 - 4
Finance & business services % 22 42 26 2 - 8 Transport, public
administration and other services
% 26 41 23 1 * 8
Government Office Region
North East % 30 41 21 2 - 6 North West % 23 42 27 1 * 7 Yorkshire and the Humber % 24 44 26 * - 5 East Midlands % 21 37 31 2 - 9 West Midlands % 19 45 29 1 - 6
Eastern % 20 46 24 3 - 6
London % 21 47 25 1 - 6
South East % 27 38 28 2 - 6 South West % 26 41 24 4 - 5
TOTAL % 23 42 26 2 * 6
Coverage: all employers funding or arranging any training in last 12 months (3,249)
Table 15b Perceived impact of training on various performance measures: summary
Large increase Small increase No difference Small decrease Large decrease Don’t know Performance measure
Turnover % 13 29 43 4 1 10
Employment % 9 20 62 3 1 6
Labour productivity % 23 42 26 2 * 6 Profit margin on sales or
services (private sector only)
% 15 32 38 2 * 13
[image:20.612.82.567.92.478.2] [image:20.612.83.571.582.682.2]Table 16 Proportion of existing staff who are fully proficient at their current job: summary
All Nearly all half or Over
fewer
Don’t know
Occupation
Table 17 Changes introduced by employers in the last year
Production or service technology
Working time arrangements
Organisation of work
Work techniques
or procedures
Initiatives to involve employees
Introduced new products or
services
Any of these
Size of employer
5 – 24 % 23 20 36 47 45 47 76
25 – 99 % 25 24 41 52 55 46 80
100 – 199 % 31 28 41 51 57 51 86
200 – 499 % 40 32 45 58 67 60 88
500 + % 43 38 49 58 66 63 89
Industry sector
Manufacturing % 32 22 37 44 40 51 74
Agriculture, mining, utilities, construction % 17 13 27 40 32 24 57
Distribution & consumer services % 22 24 32 44 49 62 83
Finance & business services % 24 18 37 48 43 36 70
Transport, public administration and other services
% 24 20 46 56 55 43 82
Government Office Region
North East % 25 23 38 51 47 51 76
North West % 23 20 35 48 43 47 77
Yorkshire and the Humber % 25 18 34 46 41 49 76
East Midlands % 30 19 41 53 51 41 78
West Midlands % 26 22 36 45 51 51 79
Eastern % 21 20 38 45 47 48 79
London % 26 28 41 48 49 51 78
South East % 21 18 36 48 48 48 76
South West % 17 18 36 48 46 40 75
TOTAL % 23 21 37 48 47 48 77
[image:22.612.58.753.113.493.2]