Britain: findings from the
2006 Families and Children
Study (FACS)
Anne Conolly and Jane Kerr
ISBN 978 1 84712 365 7
Contents
Acknowledgements ... xv
The Authors ...xvi
Glossary ...xvii
Summary ...1
1 The 2006 Families and Children Study ...7
1.1 The Families and Children Study ...7
1.1.1 Objectives of the study ...8
1.1.2 Sample design ...8
1.1.3 Defining families with children – units of interest ...9
1.1.4 Data collection ...10
1.1.5 Response rates in 2006 ...12
1.1.6 Non-response and weighting ...13
1.2 The content of the report ...14
1.3 Guide to methods used in the tables ...16
2 The characteristics of families with children ...17
2.1 Family type ...17
2.2 Marital status ...18
2.3 Work status ...18
2.4 Age of youngest child ...19
2.5 Ethnicity ...19
3.2 Longstanding illness ...39
3.3 Smoking ...40
3.4 Drinking ...41
3.5 Social capital ...41
4 Education and training ...69
4.1 Qualifications achieved ...69
4.2 Training ...70
5 Work ...99
5.1 Employment status ...99
5.2 Hours ...99
5.3 Standard Occupational Classification ...100
5.4 Travel to work ...100
5.5 Duration ...101
5.6 Leaving work ...101
5.7 Reasons for (not) working ...101
6 Total family income ...147
6.1 Income ...147
6.2 Equivalised income ...148
6.2.1 Chapter notes – defining total family income in the Families and Children Study ...148
6.2.2 The equivalisation process ...149
7 Benefits and tax credits ...161
7.1 Receipt of benefits and tax credits ...161
7.2 Amount of income received from benefits and tax credits ...162
7.3 Applications for WTC and CTC ...162
8.2 Savings ...199
8.3 Borrowing and debt ...200
8.4 Other assistance ...201
8.5 Managing family income ...201
9 Housing ...233
9.1 Tenure and housing costs ...233
9.2 Type of housing ...234
9.3 Housing conditions ...234
10 Material deprivation ...253
10.1 Leisure activities families were unable to afford ...253
10.2 Deprivation items or activities families were unable to afford ...254
11 Child characteristics ...261
12 Child health ...271
12.1 Health status of children ...271
12.2 Child’s longstanding illness ...271
12.3 Visits to Accident and Emergency ...272
13 Schooling ...283
13.1 Travel to school ...283
13.2 School performance ...284
13.3 Homework ...285
13.4 School behaviour ...286
13.5 Special Educational Need ...286
13.6 Absences from school ...286
13.7 Post-school aspirations ...287
13.8 Importance of good marks ...287
13.9 Homework ...288
14 Children’s activities and leisure time ...331
14.1 Time spent active ...331
14.2 Watching TV ...331
14.3 Technology ...331
14.4 Parental control ...332
14.5 Police contact ...333
14.6 Smoking, drinking alcohol and taking drugs ...334
14.7 Work and money ...334
14.8 Money received ...335
14.9 Handling money ...335
14.10 Happiness ...335
15 Child maintenance ...375
15.1 Child support receipt and type of agreement ...375
15.2 Amount of child support received ...375
15.3 Reliability ...376
15.4 Contact ...376
16 Childcare ...401
16.1 Usage and arrangements for working mothers ...401
16.2 Types of childcare for working mothers ...401
16.3 Usage by mothers not in work ...402
16.4 Term-time arrangements by working mothers ...402
16.5 Term-time arrangements by mothers not in work ...402
16.6 Use of formal and informal childcare by working mothers ...403
16.7 Use of formal and informal childcare by mothers not in work...403
16.8 Childcare payment by working mothers ...403
16.9 Childcare payment by mothers not in work ...404
16.13 Information ...405
16.14 Affordability ...405
16.15 Information sources ...405
Appendix A Weighting the FACS analysis ...451
Appendix B Standard error analysis ...459
References ...491
List of tables
Table 1.1 Productive interviews for families used in the FACS 2006 annual report ...13Table 2.1 Family characteristics by family type ...21
Table 2.2 Family characteristics by marital status ...25
Table 2.3 Family characteristics by family unit work status ...29
Table 2.4 Family characteristics by age of youngest child ...32
Table 2.5 Family characteristics by ethnic group of mother ...34
Table 2.6 Family characteristics by total family income ...36
Table 3.1 Mother’s self-reported health status by family characteristics ...42
Table 3.2 Mother’s longstanding limiting illness or disability by family characteristics ...44
Table 3.3 Impact of mother’s limiting longstanding illness or disability on work by family characteristics ...46
Table 3.4 Mother’s smoking behaviour by family characteristics ...48
Table 3.5 Mother’s smoking behaviour during pregnancy by family characteristics ...51
Table 3.6 Mother’s drinking behaviour by family characteristics ...53
Table 3.7 Contact with friends and family by family characteristics ...55
Table 3.8 Type of unpaid help given to any groups, clubs or organisations during the last 12 months by family characteristics ...61
Table 4.1 Whether family has any qualifications (academic or vocational) by family characteristics ...71
Table 4.2 Highest academic qualification in family by family characteristics ...74
Table 4.3 Highest academic qualification of mother by family characteristics ...77
Table 4.6 Highest vocational qualification of partner by family
characteristics ...84
Table 4.7 Highest vocational qualification in the family by family characteristics ...86
Table 4.8 Whether mother attended a training course in the last year by family characteristics ...89
Table 4.9 Whether partner attended a training course in the last year by family characteristics ...90
Table 4.10 Whether mothers’ most recent training course was designed to lead to a qualification by family characteristics ...91
Table 4.11 Whether partners’ most recent training course was designed to lead to a qualification by family characteristics ...94
Table 4.12 Whether mother has taken part in any in-work training in last 12 months by family characteristics ...95
Table 4.13 Whether partner has taken part in any in-work training in last 12 months by family characteristics ...96
Table 4.14 Amount of in-work training mother has taken part in during last 12 months by family characteristics ...97
Table 5.1 Family unit work status by family characteristics ...103
Table 5.2 Work status of mother by family characteristics ...106
Table 5.3 Work status of partner by family characteristics ...110
Table 5.4 Hours of work of mother by family characteristics ...113
Table 5.5 Hours of work of partner by family characteristics ...115
Table 5.6 SOC-2000 major group of mother by family characteristics ...117
Table 5.7 SOC-2000 major group of partner by family characteristics ...121
Table 5.8 Method of travel to work of mother by family characteristics ....125
Table 5.9 Travel to work costs of mother by family characteristics ...129
Table 5.10 Duration since mother was last in paid employment by family characteristics ...131
Table 5.11 Main reason for mother leaving her last job by family characteristics ...133
Table 5.12 Reasons mother does not work 16 or more hours per week by family characteristics (mother working 1-15 hours a week) ...139
Table 6.1 Equivalence scale values...149
Table 6.2 Banded total unequivalised weekly family income (BHC) by family characteristics ...150
Table 6.3 Average total unequivalised weekly family income (BHC) by family characteristics ...153
Table 7.1 Main respondent benefit receipt by family characteristics ...164
Table 7.2 Banded amount of total benefit/tax credit (per week) receipt of main respondent by family characteristics ...172
Table 7.3 Total benefit/tax credit receipt (median £ per week) of main respondent by family characteristics ...174
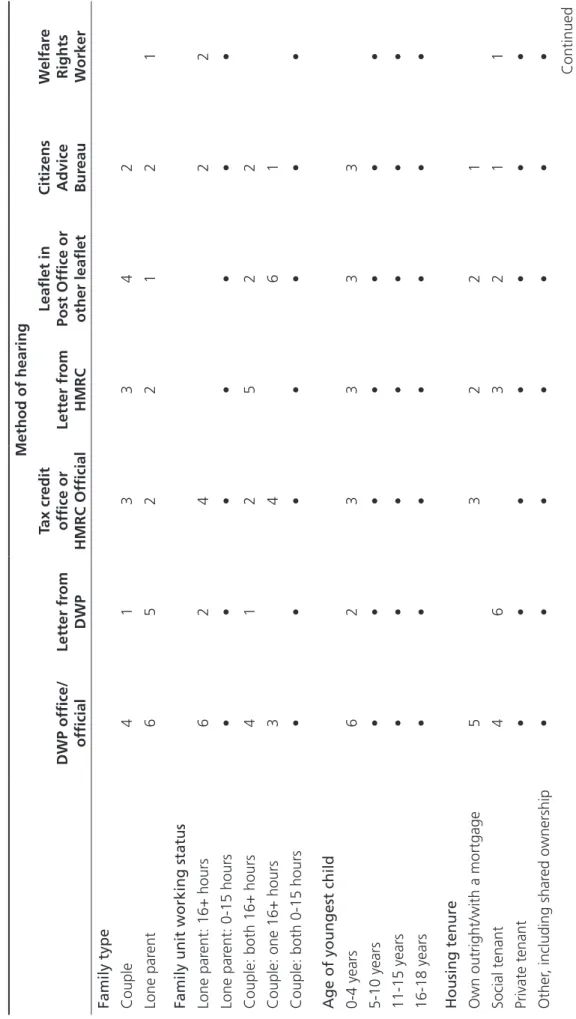
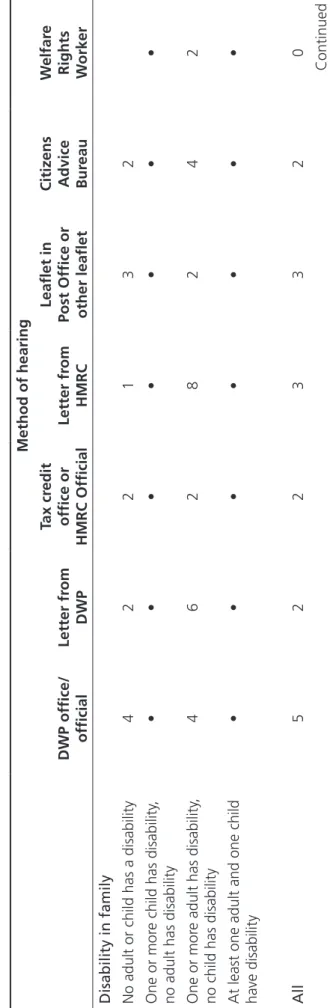
Table 7.4 Method of hearing about WTC or CTC by family characteristics ...175
Table 7.5 Applications for Tax Credits (WTC and CTC) by family characteristics ...181
Table 7.6 Awareness of rules among those families who have received or are receiving Tax Credits ...182
Table 7.7 Awareness of the maximum that can be earned (in a year) and still receive some Child Tax Credit ...188
Table 7.8 Changes in circumstances that may have affected Tax Credits (WTC and CTC) award by family characteristics ...190
Table 8.1 Whether family holds current or savings accounts by family characteristics ...203
Table 8.2 Whether save regularly and why by family characteristics ...205
Table 8.3 Borrowing in the last 12 months by family characteristics ...208
Table 8.4 Whether currently behind with bills by family characteristics ...212
Table 8.5 Number of debts by family characteristics ...216
Table 8.6 Mean number of debts by family characteristics ...219
Table 8.7 Financial help received from family by family characteristics ...221
Table 8.8 Whether money runs out before the end of the week/month ...223
Table 8.9 Worry about money by family characteristics ...226
Table 8.10 How well families are managing financially by family characteristics ...228
Table 8.11 Organisation of family finances by family characteristics ...230
Table 9.1 Housing tenure by family characteristics ...236
Table 9.2 Weekly housing costs (gross) by family characteristics ...238
Table 9.3 Mean and median housing costs (gross) by family characteristics ...241
Table 9.4 Weekly housing costs (net) by family characteristics ...243
Table 9.5 Mean and median housing costs (net) by family characteristics ...246
Table 9.6 Type of housing by family characteristics ...248
Table 9.7 Property’s state of repair by family characteristics ...251
Table 10.1 Number of leisure activities a family is unable to afford by family characteristics ...255
Table 12.1 Child’s health status by family characteristics ...273
Table 12.2 Child’s longstanding illness or disability by family characteristics ...275
Table 12.3 Child’s visits to Accident and Emergency department in the previous 12 months by family characteristics ...277
Table 12.4 Child’s limiting longstanding illness or disability and school by family characteristics ...279
Table 12.5 Impact of child’s longstanding illness or disability on mother’s ability to work by family characteristics ...281
Table 13.1 Distance travelled to school by family characteristics ...289
Table 13.2 Journey to school (method of transport) by family characteristics ...291
Table 13.3 Journey to school by distance travelled ...294
Table 13.4 School performance in maths by family characteristics ...295
Table 13.5 School performance in English by family characteristics ...297
Table 13.6 School performance in science by family characteristics ...299
Table 13.7 School performance in core subjects by family characteristics ....301
Table 13.8 Amount of homework child completes by family characteristics ...303
Table 13.9 Help with homework by family characteristics ...305
Table 13.10 School behaviour by family characteristics ...307
Table 13.11 Problems at school: Sources of advice ...309
Table 13.12 Whether child has Special Educational Need (SEN) by family characteristics ...310
Table 13.13 Type of Special Educational Need (SEN) ...311
Table 13.14 Reasons child had been away from school for at least half a day in the previous 12 months ...312
Table 13.15 Mothers’ post-school aspirations by family characteristics ...313
Table 13.16 Mothers’ post-school aspirations for child/ren at 20 years of age by family characteristics ...315
Table 13.17 Self-reported importance of getting good marks by family characteristics ...318
Table 13.18 Self-reported completion of homework by family characteristics ...320
Table 13.19 Self-reported number of times punished at school in the last year by family characteristics ...322
Table 13.20 Self-reported number of times skipped school in the last year by family characteristics ...324
Table 14.1 Amount of time child spent active in last week by family
characteristics ...337
Table 14.2 Self-reported hours spent watching television on a normal
school day by family characteristics ...339
Table 14.3 Self-reported access to and use of technology by family
characteristics ...341
Table 14.4 Self-reported parental control by family characteristics ...344
Table 14.5 Number of times child was in contact with the police in last
12 months by family characteristics ...347
Table 14.6 Self-reported child’s smoking, drinking alcohol and drugs by
family characteristics ...350
Table 14.7 Problems with child’s smoking, drinking or taking drugs in
last 12 months by family characteristics ...353 Table 14.8a Self-reported child’s work by family characteristics ...356 Table 14.8b Self-reported child’s work by family characteristics continued –
number of hours worked ...358
Table 14.9 Self-reported money received by child in last week by family
characteristics ...360 Table 14.10 Table 14.10 Self-reported what usually done with money by
family characteristics ...363 Table 14.11 Self-reported feelings about school work and appearance by
family characteristics ...366 Table 14.12 Self-reported feelings about health and family by family
characteristics ...369 Table 14.13 Self-reported feelings about life as a whole by family
characteristics ...372
Table 15.1 Child support receipt by family characteristics ...377
Table 15.2 Receipt of child support by family characteristics ...379
Table 15.3 Type of agreement to receive child support by family
characteristics ...380 Table 15.4a Total amount of weekly child support received per family by
family characteristics ...382 Table 15.4b Mean and median amount of weekly child support received
per family by family characteristics ...384 Table 15.5a Total amount of weekly child support received per dependent
child by family characteristics ...385 Table 15.5b Mean and median amount of weekly child support received
per dependent child by family characteristics ...387 Table 15.6a Reliability of child maintenance payments (all agreements)
Table 15.6c Reliability of child maintenance payments (voluntary
agreement) by family characteristics ...392 Table 15.6d Reliability of child maintenance payments (Child Support
Agency assessment) by family characteristics ...394
Table 15.7 Frequency of contact between child and non-resident parent
by family characteristics ...396
Table 15.8 Frequency of contact between resident parent and
non-resident parent by family characteristics ...398
Table 16.1 Childcare arrangements for children with working mothers
by family characteristics ...407
Table 16.2 Childcare arrangements for children with non-working
mothers by family characteristics ...413
Table 16.3 Whether childcare arrangements are the same during
term-time and holidays by family characteristics ...419
Table 16.4 Whether childcare arrangements are the same during
term-time and holidays for children with non-working mother by family characteristics ...420
Table 16.5 Childcare arrangements for children with working mothers
by family characteristics ...421
Table 16.6 Childcare arrangements for children with non-working
mothers by family characteristics ...424
Table 16.7 Whether pay for childcare (school term-time or school
holidays) for children with working mother by family
characteristics ...427
Table 16.8 Whether pay for childcare (school term-time or school
holidays) for children with non-working mother by family
characteristics ...429
Table 16.9 Total weekly childcare costs (school term-time) for children
with working mothers by family characteristics ...431 Table 16.10 Total weekly childcare costs (school term-time) for children
with non-working mothers by family characteristics ...433 Table 16.11 Total weekly childcare costs (school holidays) for children
with working mothers by family characteristics ...434 Table 16.12 Total weekly childcare costs (school holidays) for children
with non-working mothers by family characteristics ...436 Table 16.13 Quality of childcare (at any time) in local area by family
characteristics ...437 Table 16.14 Availability of childcare places (at any time) in local area by
family characteristics ...439 Table 16.15 Level of information available about childcare (at any time)
Table 16.17 Sources of information about childcare in local area by family
characteristics ...445
Table A.1 Proportions derived from the totals provided by HMRC ...452
Table A.2 Control totals for hgrossp ...454
Table A.3 Effects of cross-sectional and grossing weights 2006 ...454
Table A.4 Descriptive statistics for ggrossw and hgrossw ...456
Table B.1 True standard errors and 95 per cent confidence intervals for family type by family characteristics ...460
Table B.2 True standard errors and 95 per cent confidence intervals for mother’s self-reported health status by family characteristics ...462
Table B.3 True standard errors and 95 per cent confidence intervals for highest academic qualification in family by family characteristics ...464
Table B.4 True standard errors and 95 per cent confidence intervals for family unit work status in family by family characteristics ...466
Table B.5 True standard errors and 95 per cent confidence intervals for total weekly family income by family characteristics ...468
Table B.6 True standard errors and 95 per cent confidence intervals for benefit receipt (Tax Credits) by family characteristics ...470
Table B.7 True standard errors and 95 per cent confidence intervals for holding a current or savings account by family characteristics ...472
Table B.8 True standard errors and 95 per cent confidence intervals for housing tenure by family characteristics ...474
Table B.9 True standard errors and 95 per cent confidence intervals for number of leisure activities a family is unable to afford by family characteristics ...476
Table B.10 True standard errors and 95 per cent confidence intervals for child’s family type by family characteristics ...478
Table B.11 True standard errors and 95 per cent confidence intervals for child’s health status by family characteristics ...481
Table B.12 True standard errors and 95 per cent confidence intervals for distance travelled to school by family characteristics ...483
Table B.13 True standard errors and 95 per cent confidence intervals for amount of time spent active by family characteristics ...485
Table B.14 True standard errors and 95 per cent confidence intervals for child support receipt by family characteristics ...487
Table B.15 True standard errors and 95 per cent confidence intervals for childcare arrangements by family characteristics ...488
Acknowledgements
This report was undertaken by the National Centre for Social Research (NatCen), with contributions from researchers at the Department for Work and Pensions (DWP). The authors take responsibility for any errors or omissions in this report. The Families and Children Study (FACS) is commissioned by the DWP, and sponsored by HM Revenue & Customs (HMRC), Department for Children, Schools
and Families (DCSF)1, Department for Communities and Local Government (DCLG)
and Department for Transport (DfT). We would like to thank these organisations for their continuing support of the study.
We would like to thank those at DWP and HMRC who have co-ordinated different aspects of the research programme at various times: at DWP, Robert Lilly, Figen Deviren and Daniel Sweiry. At the NatCen, Matt Barnes and Clare Tait have ensured that the survey continues to run smoothly. We would also like to thank Stephen McKay for his advice on the design and analysis of the FACS survey.
We would like to thank various people at the NatCen for their contribution to the report. For his work on producing the standard error calculations we would like to thank Shaun Scholes. We would also like to thank John D’Souza for his help and guidance.
We give particular thanks to all the families who have given their time to be interviewed at some point during the study.
The Authors
Anne Conolly, is a Researcher at the National Centre for Social Research.
Glossary
Couple family A family with a dependent child(ren) that was headed by one natural or adoptive parent, and a partner.
Dependent children Children aged 16 years or younger, or 17 or 18 years and in full-time education.
Dual earners A couple family where the mother and her partner both worked for 16 or more hours per week.
Equivalised income The equivalisation of income is the process by which total income is adjusted for family size (number of family members) and composition (number of parents and number and age of children).
FACS The acronym used to describe the Families
and Children Study.
Family (unit) Comprises two generations of people; at least one dependent child and at least one adult who is responsible for this child.
Full-time work Paid work of 30 or more hours per week.
Lone father A male lone parent.
Lone mother A female lone parent.
usually the family’s ‘mother figure’ – an adult with the main responsibility for looking after the children in the family. In the vast majority of couple families this person was female. In lone-parent families this person was either the lone mother or the lone father.
Not working No work (i.e. working zero hours)
Not working 16 or Work of one to 15 hours or no work
more hours per week (i.e. working zero hours)
Parent The adult responsible for the child. This can
be the child’s natural or adoptive parent, or the legal guardian(s) to whom Child Benefit is paid. In couple families both adults are referred to collectively as the parents.
Partner The person with whom the mother shares
Summary
Characteristics of families (Chapter 2)
In 2006, a quarter of families with children were lone parent families. Lone parent families were more than three times as likely to live in social housing than couple families, and nearly seven times as likely to have a total family income in the lowest income quintile.
Families that contained no one working 16 or more hours per week were more likely to be in the lowest income quintile than those that contained at least one parent who worked for 16 or more hours per week. Nearly half of families in the lowest income quintile were lone parent families where the parent did not work 16 hours or more per week. The majority of couple families had two or more dependent children whereas the majority of lone parent families had one dependent child.
Health, lifestyles and participation (Chapter 3)
One in ten mothers described their health over the last 12 months as ‘not good’. Lone mothers were twice as likely to describe their health as ‘not good’ compared to mothers in couple families. Mothers who lived in families where no one worked were more likely to describe their health as ‘not good’ than mothers living in families where at least one parent worked.
Eight out of ten mothers reported having no long-term illness or disability. One- quarter of lone parents had a longstanding illness or disability, compared to one-fifth of mothers in couple families. Of those mothers with a long-term illness or disability, around two-thirds of lone parents and over half of mothers in couples said it affected the kind of work they could do, or the place where they could work.
Most families contained at least one parent with an academic or vocational qualification. Nearly all families whose total family income was in the highest income quintile had at least one qualification, while four-fifths of families in the lowest income quintile had at least one qualification. In general, lone parents were less qualified than those in couple families. Families with one or more disabled member were more likely to have no qualifications than families with no disabled members. Mothers who were social tenants were more likely to have no qualifications than mothers who lived in owned or mortgaged accommodation. Of all mothers, regardless of family unit work status, three in ten had taken part in a training course in the previous year.
Work (Chapter 5)
As in previous years, four out of five families in 2006 had at least one parent working 16 or more hours per week. However, over two-fifths of lone mothers worked no hours compared to over one-quarter of couple mothers. Mothers in couple families who worked were more likely to be in highly skilled jobs than working lone parents. Working mothers in couple families were more likely to travel to work by car or van than lone mothers, whereas lone mothers were more likely than couple mothers to travel to work by public transport.
Total family income (Chapter 6)
Lone parent families were more than three times as likely as couple families to belong to the lowest income quintile (36 per cent and 11 per cent, respectively) based on equivalised income before housing costs. The working status of the family was seen to have a strong association with the probability of having a low income, with families with no parent in work or working less than 16 hours per week particularly likely to be in the lowest income quintile.
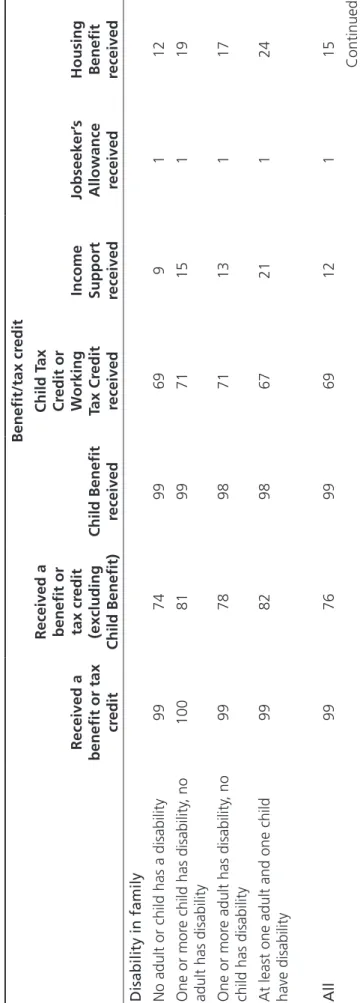
Benefits and tax credits (Chapter 7)
Just over three-quarters of families received either a benefit or a tax credit, other than Child Benefit. Nearly all lone parents received a benefit or tax credit, as did around two-thirds of couple families. The benefits families were most likely to receive (excluding Child Benefit) were Council Tax Benefit (CTB), Housing Benefit (HB) or Income Support (IS).
The majority of families had a current or savings account. Two-fifths of families with children were saving regularly. Couple families were more than twice as likely as lone parents to save regularly. Almost half of all families had borrowed money over the past 12 months, with over a quarter borrowing via a bank overdraft. Low-income families, social tenants and families where no one worked for 16 hours or more a week were less likely to save regularly and more likely to be behind with at least one bill or loan repayment. These families were also more likely to have felt anxious about money and felt less able to manage financially than their counterparts.
Housing (Chapter 9)
Just over two-thirds of families either owned their property outright or were buying it with a mortgage, whereas one-fifth of families were social tenants. Families that owned or were buying their property were more likely to be couple families than lone parent families.
The average (mean), gross, weekly housing cost was £110. Social tenants were less likely to live in a detached property than families who owned or were buying their own home. A smaller proportion of families in London lived in detached houses than families living in other areas in Britain.
The majority of families felt that their housing was in a ‘very good’ or ‘excellent’ state of repair. Those most likely to report having housing in a ‘fairly poor’ state were families (both lone parents or couples) not working 16 or more hours per week.
Material deprivation (Chapter 10)
Lone parent families, families where no one was in work of 16 or more hours per week, families in the lowest and second income quintile, and families who were social tenants were, on average, more likely to be deprived than other families. The most common things families were unable to afford were a one-week holiday away from home, not staying with relatives (28 per cent) and a night out once a month (17 per cent).
Child characteristics (Chapter 11)
more hours per week.
Children living in lone parent families were more likely than those living in couple families to be an only child, to have a mother aged under 25 years, to live in social housing and be in the lowest income quintile. In contrast, children living in couple families were more likely than those living in lone parent families to have at least one sibling, to have a mother aged 40 years or older, to live in a home that was owned or being bought with a mortgage and belong to a family in the highest income quintile.
Child health and well being (Chapter 12)
The vast majority of mothers described their child’s health as good. Those children living in a lone parent family were more likely to have their health described as ‘not good’ and have a longstanding illness compared to those in a couple family. In just over one-third of cases in which a child had a reported longstanding illness or disability, this illness or disability limited the child’s ability to attend school. This was less common amongst those children living in families with at least one parent working 16 or more hours per week.
Schooling (Chapter 13)
Over two-fifths of children walked to school, one-fifth used some form of public transport (including public bus, school/local authority school bus and train), and most of the remaining children travelled to school in a car. Walking was the preferred mode of transport where children lived within one mile of their school. Seven out of ten children aged 11 to 16 years old were thought by their parents to complete ‘all or almost all’ of their homework. Girls were reported to complete ‘all or almost all’ of their homework more often than boys, as were those in families in which one or more parent(s) worked 16 or more hours per week.
Just under half (46 per cent) of children, aged five to 15, from families in the highest income quintile were perceived by their parents to be ‘above average’ in the three core school subjects (Maths, English and Science). Just over three-quarters (76 per cent) of children aged 14 to 16, in the highest income quintile had a parent who hoped they would have attended university at age 20. These proportions are significantly higher than for children in the remaining income quintiles.
Around six in ten children were reported to do three or more hours of physical activity per week, while few (six per cent) were reported to do nothing. Physical activity was more common in boys than girls and also became less common with age. Nearly all children aged 11 to 15 reported that their family had a computer at home. Internet or email usage was related strongly to parental employment status and income with those children from working, and higher income families more likely to have used the internet or email in the previous week. Few parents reported that their children (aged eight to 18) had experienced problems with smoking, drinking or taking drugs. Smoking was most common amongst older children and those in the lowest income quintile.
Child maintenance (Chapter 15)
Over half the families where at least one child had a non-resident parent had an order or agreement for child support in place. More than two-thirds of these families had received some child maintenance payments. The median weekly amount of maintenance was £48; families with a voluntary maintenance agreement were more likely to receive all their payment on time compared to those with a Child Support Agency (CSA) assessment. Contact between children and their non-resident parent varied between two extremes. One-quarter of children had no contact with their resident parent, while over two-fifths saw their non-resident parent at least once a week.
Childcare (Chapter 16)
Over half of children with working mothers and less than a third of children with non-working mothers used childcare. Lone working mothers were more likely to use childcare than couple working mothers. Three-quarters (75 per cent) of children aged zero to two years old with working mothers and 83 per cent of children aged three to four years old with working mothers used childcare. Usage then declined as children got older. Informal types of childcare (such as care provided by family, friends or neighbours) predominated for all types of family circumstances. Formal types of childcare were used principally for pre-school, and to a lesser extent young school-aged children. Childcare arrangements during school term-time and school holidays were not the same for just under a third of children with working mothers and one-quarter of children in families where the mother was not at work.
1 The 2006 Families and
Children Study
The 2006 Families and Children Study (FACS) is the eighth in a series of annual surveys to investigate the circumstances of British families with dependent children. The study began in 1999 with a survey of all lone parent families and
low/moderate-income couples2. In 2001 the third annual study was enlarged to
be representative of all families with dependent children.
This report presents statistics, based on a representative snapshot of the circumstances of all families with dependent children in 2006. The report is divided into two parts. Chapters 2 to 10 look at a distinct feature of family life. Some of the chapters focus on the circumstances of the family unit – such as housing, income, and material wellbeing – some on the circumstances of the adults in
the family (the ‘mother figure’3 mainly, but also her partner if relevant) – such as
work and health. Chapters 11 to 16 look at a distinct feature of children’s lives – such as health and schooling, childcare, child maintenance and some on the circumstances of the children in the family. At the end of this chapter there is a guide to using the tables, a glossary and acknowledgements to the people who contributed to the 2006 FACS research programme.
1.1
The Families and Children Study
This section provides some background to FACS, including the main aims of the study and detail of the survey methods – sample design, data collection and cross sectional and longitudinal response rates.
2 Low/moderate income couple families were defined as eligible if neither
adult was working or the family income was less than £275 a week for a family with one child, with this threshold increasing to a weekly income of less than £425 for a family with four or more children.
3 Definitions relating to the family unit, the ‘mother figure’ and her partner
income; childcare; child maintenance; housing; transport; and labour market activity. FACS is commissioned and managed by the Department for Work and Pensions
(DWP) and is co-sponsored by HM Revenue and Customs (HMRC)4, Department
for Children, Schools and Families (DCSF)5, Department for Communities and
Local Government (DCLG) and Department for Transport (DfT). Within DWP, FACS is primarily used to generate evidence in relation to child poverty and welfare to work policies for families, and in relation to childcare and child support.
The main objectives of the FACS surveys are to provide information on:
• the effects of work incentive measures;
• the effects of policy on families’ living standards; and • changes in family circumstances over time;
Specifically to look at:
• the impact of benefits and tax credits in supporting families with young children;
and
• barriers to work, particularly for low income families, and measures to overcome
such barriers.
Throughout the study, the focus of the surveys has widened to take into account new or modified government policies. These new policies include the long-term targets to eradicate child poverty by 2020 and to reduce child poverty by half by 2010, as well as objectives to increase the proportion of households (particularly lone parents) in paid work. The study provides data on employment-related behaviour of parents and also on outcomes for children – such as educational attainment, health and behaviour.
1.1.2 Sample design
FACS began in 1999 and the last wave of FACS will take place in 2008/09. The dual objectives of the initial sample design were to provide a representative sample of Britain’s low-income families, while at the same time generating a sample of
sufficient size for a longitudinal study6. Child Benefit records were used as the
sampling frame for the initial sample.
Sampling procedures for later years of the study were based on the previous year’s outcomes. Generally, interviews are sought at each wave with cases which were productive at the previous wave, and with those respondents that had given
4 2006 was the final year HMRC acted as a co-sponsor on FACS.
5 Formerly known as the Department for Education and Skills (DfES).
6 A longitudinal study conducts interviews with the same people year on
booster sample is made up of ‘new’ families due to the birth of a baby, and ‘in-movers’ – families new to the sample areas.
In 2001, the sample was expanded to include all families with children, regardless of income level. FACS, therefore, is now a survey of all families with dependent children. Full details of the sampling procedures can be found in the series of FACS technical reports (Woodland and Collins, 2001; Woodland and Woodward, 2002; Woodward et al., 2003, Phillips et al., 2003, Lyon et al., 2005, Lyon et al., 2006, Lyon et al., 2007, Kerr et al., 2008).
1.1.3 Defining families with children – units of interest
The FACS sample is a named respondent sample with names and addresses selected at random from Child Benefit records. As the aim of FACS is to collect information on families with children, the named respondent acts as the main means of making contact with the family and for collecting information on the various aspects of family life. To ensure the circumstances of families with children are fully captured, the study is designed to collect various types of information on the family as a whole, and separately for the main respondent (usually the family’s ‘mother figure’ – the person with the main responsibility for looking after the children in the family), the partner (if present) and any dependent children. A definition of each of these units of interest is provided below.
The family unit
In FACS, the family unit must comprise at least one dependent child (see definition of dependent child below) and at least one adult who is responsible for this child. The definition of family unit is consistent with the definition of benefit unit. The adult responsible for the child can be the child’s natural or adoptive parent, or the legal guardian(s) to whom Child Benefit is paid. The definitions used in FACS means that families cannot span more than two generations, so, for example, grandparents and grandchildren living together are not considered to belong to the same family. However, the exception to this is where the grandparents are responsible for looking after the grandchildren; where the parents are not part of the family unit.
The main respondent/‘mother figure’
therefore, refers to lone fathers in lone parent families headed by a male (unless otherwise specifically stated).
The partner respondent
The partner respondent is the main respondent’s resident husband (or wife) or cohabitee. Reflecting legislative changes that took place in December 2005, this wave (FACS8), was the first time in the survey series that same sex couples were counted as one family. In previous years they had been treated as two separate families (because they were treated as two ‘benefit units’ in the social security system prior to December 2005).
Dependent children
A dependent child is defined as any resident child aged 16 years or under, or aged 17 or 18 and in full-time education. The definition of ‘in full time education’ used in FACS is made with reference to the end of the academic year (ending the first Tuesday in September). Thus, a 17 or 18-year-old child who had been in full-time education during the ‘current academic year’ was counted as being a dependent child, even if, at the time of interview, they had finished their course of study.
1.1.4 Data collection
The FACS surveys were carried out via a face-to-face interview with the mother and the partner (where available). The interview for 2006 was broadly similar to previous waves. The main changes to the questionnaire consisted of two new sections which aimed to explore barriers to work. These included a set of attitude questions in computer-based self-completion (also known as Computer Assisted Self Interviewing or CASI) and a card sort exercise. The self-completion questionnaire, which was completed by any dependent children aged 11 to 15 in 2003 and 2004, but not administered in 2005, was included once again in 2006. The interview for 2006 had a reduced number of questions in the expenditure section compared to previous waves.
The structure of the interview was as follows:
• a one hour Computer Assisted Personal Interview (CAPI) with the mother; • for couple families – a 15-minute CAPI interview with the partner face-to-face or
over the telephone (if the partner is not present, a short, proxy partner interview with the mother is carried out);
• a self-completion questionnaire to be completed by any dependent children
Information about the family unit • family composition;
• relationship histories;
• contact with non-resident parents; • social capital;
• housing;
• receipt of other social security benefits;
• receipt and the renewal process of Tax Credits (Working Tax Credit (WTC) and
Child Tax Credit (CTC));
• other income and savings; and • expenditure and hardship.
Information about the main respondent herself • education and training;
• health;
• caring responsibilities;
• employment and self-employment; • work history;
• unemployment and job search (including attitudes self-completion and card
sort exercise)7.
Information about each specific dependent child • health;
• school and education;
• problems and use of local services; • parental aspirations for children; and • childcare arrangements.
Partner’s interview
For couple families, a short interview was carried out with the partner. The partner interview included information on:
7 Findings from this section are due to be published in a separate report in
• employment and self-employment; • earnings;
• unemployment and job search; and • caring responsibilities.
In cases where the partner interview was not completed with the partner, a proxy interview was carried out with the mother. This was to minimise the risk of having no data about the partner. The proxy partner interview collected information on:
• current or recent work status; • earnings;
• industrial and occupational classification data; and • qualifications.
Having collected this proxy information the intention, where possible, was for the interviewer to return to the family at a later date to conduct an interview with the partner.
Child self-completion questionnaire
All children, aged 11 to 15 in the family were invited to complete a short self-completion questionnaire. The age band was chosen to ensure the widest possible age group for whom the questions would be appropriate. The survey covered issues of activities in spare time, school life, and opinions about the local neighbourhood and the family.
1.1.5 Response rates in 2006
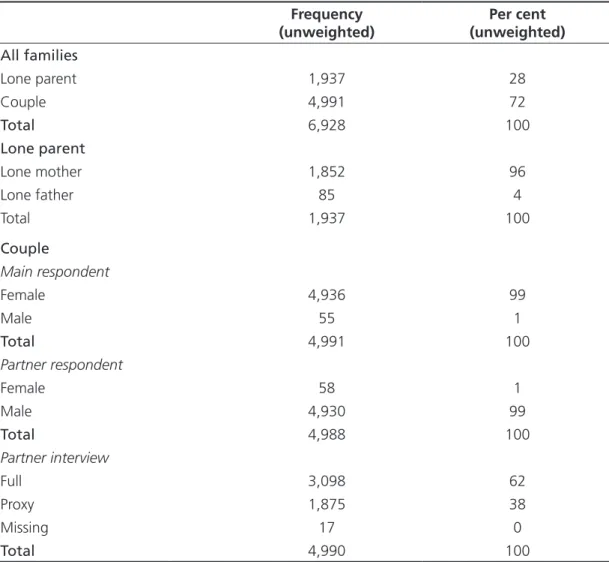
The initial sample selected for the 2006 wave of FACS consisted of 8,939 families. The overall yield of interviews from these eligible addresses was 7,464 – giving a response rate of 84 per cent. The analysis in this report does not use all 7,464 families who provided a productive interview in the 2006 wave of the FACS survey. The information from the interview revealed that some of the sample was no longer a family eligible to be included in this report – the family no longer contained dependent children because the child(ren) had aged or moved out of the family between sampling and fieldwork. Consequently, 6,928 respondents satisfied the definition of a ‘family with dependent children’ to be used in the cross-sectional analysis for this report (Table 1.1). From these families, 12,483 dependent children were identified and used in the analysis for this report.
38 per cent of couple families interviewed, which meant that only 17 couple families (less than one per cent) failed to provide any information about the partner (other than that collected in the household grid) (Table 1.1). Although the majority of analysis in this report relates to the family, because the proxy partner interview was substantially shorter than the main interview, most of the information about parents focuses on the mother. For further information on response rates in FACS 2006, see Kerr et al., (2008).
Table 1.1 Productive interviews for families used in the FACS 2006 annual report
Frequency
(unweighted) (unweighted)Per cent
All families
Lone parent 1,937 28
Couple 4,991 72
Total 6,928 100
Lone parent
Lone mother 1,852 96
Lone father 85 4
Total 1,937 100
Couple
Main respondent
Female 4,936 99
Male 55 1
Total 4,991 100
Partner respondent
Female 58 1
Male 4,930 99
Total 4,988 100
Partner interview
Full 3,098 62
Proxy 1,875 38
Missing 17 0
Total 4,990 100
1.1.6 Non-response and weighting
section, has characteristics very close to those of the population of all families with children. In FACS 2006, five separate pieces of information were used in the weighting procedure:
• age distribution of Child Benefit recipients; • number of dependent children;
• region;
• proportion of lone parents;
• number/proportion of Tax Credit recipients.
As recommended in the documentation supplied with the FACS data, this weight
is used for conducting the cross-sectional analysis presented in this report8.
1.2
The content of the report
The report comprises of 15 substantive chapters of tables, nine chapters contain tables about a wide range of family circumstances; including health, income, childcare and work, while a further six contain tables on a different theme about children; including schooling, health, child activities and childcare. Each chapter summarises the key findings from core descriptive analysis of the 2006 FACS survey. All the key findings are largely consistent with FACS 2005 findings. All the findings reported in each chapter are significant at the 95 per cent level, unless otherwise stated. Some of the differences appear to be statistically non-significant because of small bases, however, the relevant small bases are acknowledged throughout. The list of chapters is as follows:
Chapters about family life
• Chapter 2 provides a description of the key socio-demographic and economic characteristics of families with children in 2006. This chapter also introduces the various groups used throughout the report to demonstrate how circumstances can differ according to family characteristics. The purpose of this chapter is to provide the context within which the more detailed findings discussed in subsequent chapters can be placed.
• Chapter 3 looks at the health and wellbeing of adults and children in the family, including both long-term and limiting illnesses and disabilities. In addition this chapter also looks at the social capital.
• Chapter 4 reports on educational qualifications and in-work or work-related training undertaken by adults in the family.
8 For further information on the weighting procedure applied to analysis in
work for those without a job.
• Chapter 6 uses a measure of total family income to report income across family groups and differences in amounts and types of income received.
• Chapter 7 looks at receipt and awareness benefits and tax credits, namely the WTC and CTC. This chapter also considers the range of benefits that families can claim, with a particular focus on Income Support (IS).
• Chapter 8 looks at whether families save and in what manner, both amount and type of savings account held, as well as their financial management.
• Chapter 9 provides a description of the type of housing families live in, and also looks at housing costs and state of repair.
• Chapter 10 explores material deprivation in terms of the family’s ability to afford a range of items such as a car or van, night out once a month and a one week holiday.
Chapters about children in the family
• Chapter 11 provides a description of the key socio-demographic and economic characteristics of children in 2006. This chapter also introduces the various groups used throughout the report to demonstrate how circumstances can differ according to child and family characteristics. The purpose of this chapter is to provide the context within which the more detailed findings discussed in subsequent chapters can be placed.
• Chapter 12 looks at the health and wellbeing of children, including both long-term and limiting illnesses and disabilities.
• Chapter 13 is the first of two consecutive chapters that consider child outcomes. This chapter focuses on schooling in particular, including academic performance, problems at school and parental aspirations.
• Chapter 14 reports on child behaviour outside school. The analysis looks at the leisure activities and social life of children as well as problems with the police and experience of drugs, smoking and alcohol.
• Chapter 15 looks at child maintenance, reporting frequency and amount of payments, and explores contact between the non-resident partner and both the mother figure and her children.
The tables reproduced in this report share a general pattern and their presentation follows a number of general, often widely-shared conventions. The majority of tables use row percentages, presenting the percentage of a child or family characteristic, by a particular, mutually exclusive response – for example, the percentage of children who had friends to visit according to the number of visits in the last week. In these tables the percentages sum to 100. Some tables present multiple responses (the respondent could choose a number of responses rather than just one) and hence percentages will not sum to 100, for example, the percentage of families who received certain benefits (where the family could receive more than one type of benefit). Some tables present the profile of a particular outcome according to child characteristics – for example the percentage of children from lone-parent families according to child or family characteristics – so use column rather than row percentages. Tables do not necessarily contain just percentages; sometimes they contain a measure of the average – for example, the median weekly costs of childcare. These statistics are made clear in the appropriate tables.
Please note that data improvement work is currently being carried out and that the improved data are likely to differ slightly from the data used in this report. In the tables the following conventions are used:
Base The unweighted count of the base is presented in all tables, usually the
number of respondents in the relevant family characteristic sub-group.
Weighting All analysis is weighted using the grossing cross-sectional weight
provided with the FACS dataset. This weight provides estimates for the survey that match the population’s known profile on a range of different characteristics. For further information see Appendix A.
0 Percentage value is greater than 0, but less than 0.5, which is
rounded down.
• Figures are based on less than 50 cases and are not robust, therefore
the results are not presented in this report.
“ “ A blank space in a table where a per cent figure is expected indicates
2 The characteristics of
families with children
2.1
Family type
In the 2006 Families and Children Study (FACS), three-quarters (75 per cent) of families were couple families and the remaining quarter were lone parent families. Nearly all lone parents were female (95 per cent) (Table 2.1).
Lone parent families were more likely than couple families to:
• contain only one dependent child (56 per cent compared to 42 per cent); • have a ‘mother figure’ aged under 30 years old (24 per cent compared to
14 per cent);
• live in social housing (43 per cent compared to 12 per cent), or in privately
rented accommodation (18 per cent compared to seven per cent);
• be in the lowest income quintile (47 per cent compared to seven per cent);
and
• have a child with a disability9 (25 per cent compared to 20 per cent) (Table 2.1).
Couple families, in contrast, were more likely than lone parent families to:
• contain a pre-school aged child, under five years, (45 per cent compared to 35
per cent);
• have two or more dependent children (58 per cent compared to 44 per cent);
9 This group includes those families where one or more child had a disability,
• be in the top two-fifths of the income distribution (43 per cent compared to five
per cent) (Table 2.1).
2.2
Marital status
Over two-fifths (43 per cent) of those who were single, never married, were under 30 years of age compared to only ten per cent of those who were married and living with a husband (Table 2.2).
Around three-fifths (61 per cent) of mothers, whose legal marital status was single, never married, had children under five years of age compared to just over two-fifths (42 per cent) of married couples (Table 2.2).
Married couples were more likely to own their own home (84 per cent) than those who were single, never married (35 per cent) (Table 2.2).
Those mothers who were single, never married were also more likely to have a lower level of total family income, with almost two-thirds (65 per cent) in the lowest two income quintiles compared to only 16 per cent of married couples (Table 2.2).
2.3
Work status
Around two-fifths (42 per cent) of all families were couples where both the mother and her partner were in work for 16 or more hours per week and 28 per cent were couple families where one parent worked 16 or more hours per week. The divide between working 16 or more hours per week and not was more evenly balanced for lone parent families (13 per cent and 12 per cent of all families, respectively). The remaining four per cent of families were couple families where neither the mother nor her partner worked for 16 or more hours per week (Table 2.1).
families where parents (and partners) worked 16 or more hours per week (see Table 2.3).
2.4
Age of youngest child
Over two-fifths (43 per cent) of all families had a youngest child under five years of age (pre-school age). Half (50 per cent) of families had a youngest child at school (five to 15 years of age) and eight per cent had a youngest child above school age (16 to 18 years), but still in full-time education (Table 2.1).
The proportion of lone parents working 16 or more hours per week increased as the age of the youngest child in the family increased. Eight per cent of lone parents with a youngest child aged under five years were working 16 or more hours per week, compared to 18 per cent of lone parents with a youngest child aged 11 to 15 years. A similar pattern is observed for couple families where both parents worked 16 hours or more. However, the proportion of couple families with only one partner in work of 16 hours declined as the age of youngest child increased (Table 2.4).
2.5
Ethnicity
Nine per cent of mothers were from an ethnic minority group – two per cent were Black (African, Caribbean or Black British), four per cent were Asian (Indian, Pakistani, Bangladeshi or Asian British) and a further three per cent were from another ethnic group (Table 2.1).
Families with a black mother were more likely than families with a white mother to:
• be lone parents (51 per cent compared to 25 per cent); • live in social housing (45 compared to 19 per cent); and
• be in the lowest income quintile (32 per cent compared to 16 per cent)
Virtually all (98 per cent) families in the highest income quintile were couple families. In contrast, over two-thirds (69 per cent) of families in the lowest income quintile were lone parents (Table 2.6).
A relationship between low income and family unit work status was apparent:
• nearly half (48 per cent) of families in the lowest income quintile were lone
parents not working 16 or more hours per week;
• just over a fifth (21 per cent) were lone parents working 16 or more hours per
week;
• 15 per cent were couple families where one partner worked 16 or more hours
per week;
• 12 per cent were couple families where neither partner worked more than 16
hours per week; and
• four per cent were couple families where both parents worked 16 or more
hours per week (Table 2.6).
10 See Chapter 6 ‘Total family income’ for a detailed explanation of how a
Table 2.1
Family characteristics by family type
Column per cent
Family type Lone par ent Lone mother Lone father Couple All % Unweighted count % Unweighted count % Unweighted count % Unweighted count % Unweighted count
Family unit working status Lone par
ent: 16+ hours
54 954 53 902 64 52 13 954 Lone par
ent: 0-15 hours
46 983 47 950 36 33 12 983
Couple: both 16+ hours
56
2,822
42
2,822
Couple: one 16+ hours
38
1,850
28
1,850
Couple: both 0-15 hours
6
319
4
319
Age of youngest child 0-4 years
35 733 36 724 10 9 45 2,431 43 3,164 5-10 years 32 634 32 607 31 27 25 1,293 27 1,927 11-15 years 24 420 23 382 47 38 22 966 23 1,386 16-18 years 9 150 9 139 13 11 7 301 8 451
Number of dependent children 1
56 1,066 56 1,014 60 52 42 2,031 46 3,097 2 30 601 30 577 28 24 41 2,157 39 2,758 3 10 196 10 188 11 8 12 606 12 802
4 or mor
e 4 74 4 73 1 1 4 197 4 271
Gender of mother figure Male
Table 2.1
Continued
Column per cent
Family type Lone par ent Lone mother Lone father Couple All % Unweighted count % Unweighted count % Unweighted count % Unweighted count % Unweighted count
Age group of mother Under 25 years
13 313 14 310 3 3 4 253 6 566 25-29 years 11 263 12 262 1 1 10 574 10 837 30-34 years 15 305 16 301 4 4 17 923 17 1,228 35-39 years 20 370 20 353 19 17 25 1,271 24 1,641 40-44 years 20 341 20 323 21 18 24 1,090 23 1,431
45 years and over
20 345 19 303 52 42 20 880 20 1,225
Ethnic group of mother White
90 1,771 90 1,693 91 78 91 4,569 91 6,340 Black 5 81 5 77 4 4 2 74 2 155 Asian 2 33 2 32 1 1 5 217 4 250 Other 3 51 3 49 3 2 3 127 3 178
Housing tenure Own outright/with a mortgage
35 609 34 561 57 48 79 3,926 68 4,535 Social tenant 43 902 44 878 29 24 12 618 20 1,520 Private tenant 18 350 18 341 10 9 7 353 9 703 Other
, including shar
Table 2.1
Continued
Column per cent
Family type Lone par ent Lone mother Lone father Couple All % Unweighted count % Unweighted count % Unweighted count % Unweighted count % Unweighted count
Total family income: quintiles Lowest income quintile
47 989 48 959 34 30 7 361 17 1,350 Second quintile 34 617 34 590 33 27 11 572 17 1,189 Thir d quintile 10 180 10 170 12 10 19 962 17 1,142 Fourth quintile 4 61 3 56 6 5 21 1,048 17 1,109
Highest income quintile
1 23 1 22 1 1 22 1,125 17 1,148 Self-employed 4 67 3 55 13 12 19 923 15 990
Government office region North East
7 155 7 151 4 4 4 259 5 414 North W est 10 186 10 178 10 8 12 571 12 757 Yorkshir
e and Humber
Table 2.1
Continued
Column per cent
Family type
Lone par
ent
Lone mother
Lone father
Couple
All
%
Unweighted
count
%
Unweighted
count
%
Unweighted
count
%
Unweighted
count
%
Unweighted
count
Disability in family No adult or child has disability
60
1,168
61
1,119
57
49
57
2,920
58
4,088
One or mor
e child has disability
,
no adult has disability
15
293
15
287
7
6
10
492
11
785
One or mor
e adult has disability
,
no child has disability
15
285
15
264
25
21
23
1,094
21
1,379
At least one adult and one child have disability
10
191
10
182
10
9
10
482
10
673
All
100
1,937
100
1,852
100
85
100
4,991
100
6,928
Table 2.2
Family characteristics by marital status
Column per cent
Marital status
Single, that is, never married Married and living with husband/wife
Married and separated fr om husband/wife Divor ced Widowed % Unweighted count % Unweighted count % Unweighted count % Unweighted count % Unweighted count
Family type Couple
44 739 100 4,014 13 42 27 188 12 7 Lone par ent 56 1049 0 18 87 273 73 544 88 53
Family unit working status Lone par
ent: 16+ hours
24 415 0 8 53 159 49 346 45 26 Lone par
ent: 0-15 hours
31 634 0 10 34 114 24 198 44 27
Couple: both 16+ hours
21 355 57 2,315 7 23 18 126 5 3
Couple: one 16+ hours
17 269 38 1,514 5 13 7 52 3 2
Couple: both 0-15 hours
6 115 5 185 2 6 1 10 4 2
Age of youngest child 0-4 years
61 1,102 42 1,811 31 106 18 134 16 10 5-10 years 24 457 26 1,086 35 112 34 262 16 10 11-15 years 12 178 24 857 26 76 35 244 52 31 16-18 years 3 51 8 278 8 21 13 92 16 9
Number of dependent children 1
58 1,010 41 1,575 39 122 51 354 61 35 2 30 550 43 1,797 40 129 34 266 23 16 3 9 167 13 501 15 47 11 79 14 8
4 or mor
Table 2.2
Continued
Column per cent
Marital status
Single, that is, never married Married and living with husband/wife
Married and separated fr om husband/wife Divor ced Widowed % Unweighted count % Unweighted count % Unweighted count % Unweighted count % Unweighted count
Gender of mother figure Male
1 21 1 46 7 19 6 43 16 10 Female 99 1,767 99 3,986 93 296 94 689 84 50
Age group of mother Under 25 years
22 455 2 95 3 12 0 3 1 1 25-29 years 21 405 8 373 7 30 3 28 2 1 30-34 years 21 361 17 726 17 57 11 81 5 3 35-39 years 20 328 26 1,066 20 65 23 173 13 8 40-44 years 11 157 26 963 26 77 32 224 16 10
45 years and over
6 82 22 809 27 74 31 223 63 37
Ethnic group of mother White
93 1,676 89 3,637 89 282 94 692 87 53 Black 4 59 2 63 5 14 2 14 8 4 Asian 1 11 6 214 4 13 2 12 Other 3 42 3 114 2 5 2 14 5 3
Housing tenure Own outright/with a mortgage
35 562 84 3,391 54 161 53 382 65 39 Social tenant 43 825 9 352 27 92 31 236 24 14 Private tenant 18 323 5 221 16 55 14 98 10 6 Other
, including shar
Table 2.2
Continued
Column per cent
Marital status
Single, that is, never married Married and living with husband/wife
Married and separated fr om husband/wife Divor ced Widowed % Unweighted count % Unweighted count % Unweighted count % Unweighted count % Unweighted count
Total family income: quintiles Lowest income quintile
40 780 6 251 29 99 24 193 43 26 Second quintile 25 431 10 392 37 114 33 237 27 15 Thir d quintile 13 227 19 748 14 45 17 115 12 7 Fourth quintile 8 121 22 889 10 25 9 68 9 6
Highest income quintile
6 103 24 981 5 15 7 47 3 2 Self-employed 8 126 19 771 5 17 10 72 6 4
Government office region North East
7 150 4 191 5 19 6 53 2 1 North W est 12 197 12 461 10 31 9 59 16 9 Yorkshir
e and Humber
Table 2.2
Continued
Column per cent
Marital status
Single, that is, never married Married and living with husband/wife
Married and
separated fr
om
husband/wife
Divor
ced
Widowed
%
Unweighted
count
%
Unweighted
count
%
Unweighted
count
<