UNIVERSITY OF SOUTHERN QUEENSLAND
Calibration Analysis Within the Cognitive and Personality Domains: Individual Differences in Confidence, Accuracy, and Bias
A Dissertation submitted by Sandra Florentina Baker, BSc (Hons)
For the award of Doctor of Philosophy
Abstract
Calibration research is concerned with the accuracy of confidence judgments made by individuals when responding to various cognitive tasks. Individuals are scored as accurate or inaccurate based on the objective criterion of whether their responses are correct. Within the personality domain, judging the accuracy of trait self-ratings is more complicated than in the cognitive area as there are no perfect criteria for evaluating the accuracy of these types of judgements (Colvin & Funder, 1991).
Because cognitive calibration research findings formed the anchor for the current studies, the decision was made to initially scrutinize the cognitive domain for mis-calibration, and whether individual differences in gender, age, personality, and ability, influenced cognitive confidence and bias scores. In order to achieve the aims, of this dissertation, three studies were conducted with a total of 831 individuals being tested. To determine accuracy within the personality domain, the current studies constructed a situation wherein Big Five personality assessments could be scored as accurate or inaccurate. Results showed that when consistency measures were used, accuracy scores for each Big Five trait were reasonably high across Studies 1, 2, and 3. Prior to the studies conducted in this dissertation, no techniques using calibration procedures had been established to assess Big Five confidence or bias.
benchmark for peoples‟ confidence in Big Five judgments was around 80%. Data from Studies 1, 2, and 3 also demonstrated a one-factor solution when confidence scores for each Big Five trait were factor analysed. In studies 1 and 3 the factorial structure of cognitive and Big Five confidence scores was examined and both studies produced a two-factor solution.
The calibration paradigm also uses bias scores as a measure of how well calibrated individuals are when self-monitoring their performance on various cognitive tasks. Whether people are well-calibrated within the Big Five domain has not been investigated by previous researchers. The current studies examined whether people were mis-calibrated when making Big Five judgments about themselves. The data from two studies indicate that people were well-calibrated for each of the Big Five traits. Factor analyses of Big Five bias scores revealed a one-factor solution. When study 3 examined the factorial structure of cognitive and Big Five bias scores, the analyses showed that bias across these domains were separate but correlated processes. Across all three studies, individual differences in gender and age did not influence Big Five confidence, Big Five accuracy or Big Five bias scores.
One of the most significant implications of this dissertation, for calibration researchers, who are striving to understand the mis-calibration phenomenon, was that the structural analyses of cognitive and Big Five bias scores yielded a two-factor solution (i.e., Personality and Cognitive Bias), that was moderately correlated. Also, in the current studies, simple methods were used to obtain Big Five confidence ratings. These procedures could now be used to investigate the factorial structure of
Certification of Thesis
I certify that the ideas, experimental work, results, analyses, software, and conclusions reported in this dissertation are entirely my own effort, except where otherwise acknowledged. I also certify that the work is original and has not been previously submitted for any other award, except where otherwise acknowledged.
___________________________ _______________
Sandra F Baker Date
ENDORSEMENT
___________________________ _______________
Acknowledgements
To my supervisor Professor Gerard Fogarty thank you for your eternal faith in my ability to complete this document despite many difficulties. Your guidance has been invaluable and very much appreciated. This journey has been a challenge. However, the learning has been remarkable!
Thanks to all of the participants who made this journey possible. Thanks to the Psychology Technical Team who were always available for the technical aspects of data collection. Many thanks to Audrey, the nurse unit manager who has supported me all of the way, and who has been so gracious with allowing me to take time off. To my colleague Sheree who has taken over group therapy for me so that I could finish this project.
To my beautiful children Andrew, Brendon, Sarah, Katherine, Anna and Raleigh thanks for your constant support and love. To Peter, thank you for being there during the difficult journey of the PhD.
To my friends Sandra, Richard, Kerry, Lorna, Mel, and Nancey who have always been there for me. Thanks to Maxine, Liam, and Jen, for their continued support.
Table of Contents
Abstract ... i
Certification of Thesis ... iii
Acknowledgements ... iv
Table of Contents ... v
List of Tables... xiv
List of Figures ... xviii
List of Appendices ... xx
Chapter 1 – Introduction ... 1
1.1 Structure of the Dissertation... 1
1.2 Statement of the Problem ... 1
1.3 Brief Rationale for Including Personality Judgments ... 4
1.4 Broad Aims and Overview of Current Studies ... 5
Chapter 2 – Literature Review ... 7
2.1 Introduction ... 7
2.2 Confidence and Meta-cognition ... 7
2.3 Calibration Research ... 9
2.3.1 The Experimental Paradigm ... 9
2.3.2 Numerical Measures of Calibration ... 9
2.3.2.1 Item-by-Item Confidence Scores (Self-Monitoring) ... 9
2.3.2.2 Self Evaluation Scores (Mis-calibration at the Global Level) ... 10
2.3.3 Graphical Measures of Calibration ... 10
2.3.3.1 Calibration Curves ... 10
2.3.3.2 Item-Specific Scatterplots ... 11
2.4.1 Heuristics and Biases Approach ... 11
2.4.2 Error Explanations of Mis-calibration ... 14
2.4.3 Differing Modes of Uncertainty ... 14
2.4.4 Ecological Approach... 15
2.4.5 Summary ... 18
2.5 Empirical Findings in Calibration Research ... 19
2.5.1 The Hard-Easy Effect ... 19
2.5.2 Good Calibration... 19
2.5.3 Underconfidence ... 21
2.5.4 Overconfidence ... 22
2.5.5 Self-Confidence and the Study of Individual Differences ... 23
2.5.5.1 Gender Differences in Accuracy, Confidence and Mis-calibration ... 24
2.5.5.1.1 Gender Differences and Task Accuracy ... 24
2.5.5.1.2 Gender Differences and Confidence ... 25
2.5.5.1.3 Gender Differences and Mis-Calibration ... 26
2.5.5.2 Age Differences in Accuracy, Confidence and Mis-Calibration ... 27
2.5.5.2.1 Age Differences in Accuracy ... 27
2.5.5.2.2 Age differences in Confidence and Mis-calibration ... 28
2.5.5.3 Ability and Confidence ... 29
2.5.5.4 Personality Correlates of Confidence and Mis-Calibration ... 31
2.5.5.5 A Trait of Self-Confidence within the Cognitive Domain ... 34
2.5.5.5.1 Gf-Gc Theory and the Calibration Paradigm ... 35
2.8 Confidence Judgments Across Cognitive and Personality Measures: One Trait
or Two? ... 42
2.8.1 Summary ... 44
2.9 Measurement Issues and Empirical Findings of Personality Judgements ... 45
2.9.1 Interpersonal Perception ... 46
2.9.2 Intrapersonal Perception ... 46
2.9.2.1.1 Reflected Appraisals ... 47
2.9.2.1.2 Direct Appraisals ... 47
2.9.2.1.3 Biases That Can Affect the Accuracy of Self-Perception ... 48
2.9.2.1.4 Self-Enhancement ... 49
2.9.2.1.5 Above-Average Effect ... 49
2.9.2.1.6 Social Desirability ... 50
2.9.2.1.7 Are Personality Judgements Error-Prone or Error-Free? ... 51
2.10 Chapter Summary... 53
Chapter 3 - Study 1 ... 55
3.1 Introduction ... 55
3.2 Mis-calibration for Gf, Gc, & Gv Tasks ... 56
3.3 Individual Differences in Cognitive Confidence and Mis-calibration ... 57
3.3.1 Gender ... 57
3.3.2 Age ... 58
3.3.3 Ability ... 59
3.3.4 Personality ... 59
3.4.1 Gender Differences in Big Five Personality Confidence, Accuracy and
Bias ... 60
3.4.2 Age Differences in Big Five Confidence, Accuracy and Bias ... 62
3.5 The Factorial Structure of Cognitive and Personality Confidence Judgments 63 3.6 Factorial Structure of Cognitive Bias Scores ... 65
3.6.1 Correlations between the Personality Bias Score and Cognitive Bias Scores ... 65
3.7 Restatement of Hypotheses ... 66
3.8 Method ... 68
3.8.1 Participants... 68
3.8.2 Materials ... 69
3.8.2.1 Cognitive Tests ... 69
3.8.2.2 Self-report Measures ... 70
3.8.3 Procedure ... 75
3.9 Results ... 76
3.9.1 Data Screening ... 76
3.9.1.1 Reliability Analysis ... 77
3.9.1.2 Descriptive Statistics... 78
3.9.2 Calibration Results for the Cognitive Tasks ... 79
3.9.2.1 Reasoning Tasks (Gf) ... 79
3.9.2.2 Acculturated Knowledge Tasks (Gc) ... 80
3.9.2.3 Visual Perceptual Task (Gv) ... 83
3.10 Individual Differences in Cognitive Confidence and Mis-calibration... 84
3.10.1 Gender Differences in Cognitive Confidence ... 84
3.10.3 Mis-calibration and Ability ... 86
3.10.4 Personality Correlates of Cognitive Confidence Judgments ... 86
3.11 Individual Differences in Big Five Accuracy, Confidence and Mis-calibration ... 88
3.11.1 Gender Differences in Big Five Confidence and Accuracy ... 91
3.11.2 Age Differences in Big Five Confidence and Accuracy ... 92
3.12 The Factorial Structure of Cognitive and Big Five Confidence ... 93
3.13 Factor Structure of Cognitive Bias Scores ... 95
3.13.1 Correlations between the Personality Bias Score and Cognitive Bias Scores ... 96
3.14 Discussion ... 96
Chapter 4 - Study 2 ... 107
4.1 Introduction ... 107
4.2 Item-by-Item and Block Personality Confidence Judgments... 107
4.3 Accuracy Scores for the Big Five Block Judgments ... 113
4.4 Bias and Accuracy Scores for the Item-By-Item Big Five Judgments ... 114
4.5 Gender and Age Differences in Personality Confidence, Accuracy, and Bias ... 117
4.6 Factorial Structure of Big Five Confidence and Big Five Subscale Scores ... 118
4.7 Hypotheses ... 118
4.8 Participants ... 120
4.9 Materials ... 120
4.10 Procedure... 125
4.10.1 Scoring ... 126
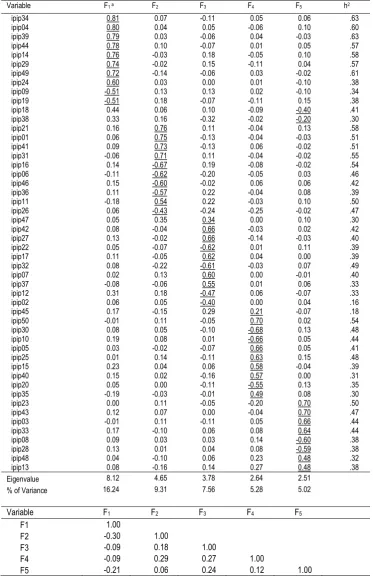
4.11.1 Factorial Structure of the IPIP ... 127
4.11.2 Factorial Structure of the IPIP Form B ... 129
4.11.3 Descriptive Statistics and Factorial Structure of Item-level Accuracy Scores ... 131
4.11.4 Reliability Analysis ... 132
4.11.4.1 Descriptive Statistics... 132
4.12 The Factorial Structure of Confidence... 134
4.13 Gender and Age Differences in Personality Confidence ... 135
4.14 Big Five Accuracy and Bias Scores ... 137
4.14.1 Item-by-item Big Five Accuracy and Bias ... 139
4.14.2 Gender and Age Differences in Accuracy and Bias ... 139
4.14.3 Factorial Structure of Big Five Bias ... 140
4.15 Factorial Structure of Big Five Confidence and Big Five Subscale Scores 142 4.16 Discussion ... 143
Chapter 5 - Study 3 ... 150
5.1 Introduction ... 150
5.2 Cognitive Calibration and Confidence on Gf Tasks ... 150
5.2.1 Bias in Relation to Gf Tasks ... 150
5.2.2 Factorial Structure of Item-Level Cognitive Confidence Ratings and Confidence Ratings Obtained in Relation to PTPEs ... 151
5.3 Other Individual Differences in Cognition ... 153
5.3.1 Need for Cognition in Cognition: Gf Tasks ... 153
5.3.2 Negative Affect in Cognition: Gf Tasks ... 154
5.4 Replication Analyses in Relation to Personality... 155
5.5.1 Self-Focussed Attention in Relation to Personality ... 155
5.5.2 Negative Affect in Relation to Personality ... 156
5.5.3 Positive Affect in Relation to Personality ... 156
5.5.4 Need for Cognition in Relation to Personality ... 156
5.6 Factorial Structure of Personality and Gf Confidence Scores ... 157
5.7 Self-report Intelligence/Abilities Confidence and Personality Confidence Ratings ... 159
5.8 Factorial Structure of Cognitive and Personality Bias Scores ... 160
5.9 Hypotheses in Relation to Cognition ... 160
5.10 Replication Hypotheses in Relation to Personality ... 162
5.11 New Hypotheses: Study 3 in Relation to Personality ... 163
5.12 New Hypotheses Study 3 in Cognition and Personality ... 164
5.13 Method ... 165
5.13.1 Participants ... 165
5.13.2 Materials ... 165
5.13.3 Procedure... 169
5.13.4 Scoring ... 170
5.14 Results ... 171
5.14.1 Normality and Outliers ... 171
5.15 Results for Cognitive Tasks ... 172
5.15.1 Bias in Relation to Gf Tasks ... 172
5.15.2 Individual Differences for Gf Tasks ... 176
5.15.2.1 Ability Differences in Relation to Gf Bias Scores ... 177
5.15.2.2 Personality in Relation to Gf Confidence and Bias ... 178
5.15.2.4 Negative Affect in Relation to Gf Tasks ... 179
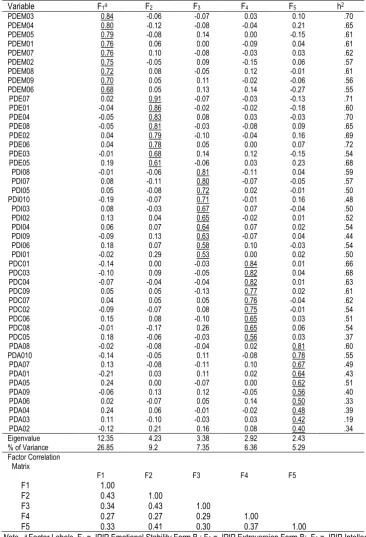
5.15.3 Factorial Structure of the IPIP ... 179
5.15.4 Factorial Structure of the IPIP Form B ... 181
5.15.5 Descriptive Statistics and Factorial Structure of Item-level Accuracy Scores ... 183
5.15.6 Reliability Analysis for Self-Report Measures ... 184
5.15.7 Descriptive Statistics Self-Report Measures... 185
5.16 The Factorial Structure of Big Five Confidence ... 186
5.16.1 Gender and Age Differences in Big Five Confidence, Accuracy and Bias ... 187
5.16.1.1 Big Five Accuracy and Bias Scores ... 190
5.17 Validity Checks in Personality ... 193
5.17.1 Self-Focussed Attention in Relation to Personality ... 193
5.17.2 Negative Affect in Relation to Personality ... 194
5.17.3 Positive Affect in Relation to Personality... 194
5.17.4 Need for Cognition in Relation to Personality ... 194
5.18 Factorial Structure of Big Five, Gf, and Self-Report Intelligence Confidence Scores ... 195
5.19 Factorial Structure of Cognitive and Big Five Bias Scores ... 198
5.20 Discussion ... 200
Chapter 6 General Discussion... 212
6.1 Factorial Structure of Big Five Confidence ... 217
6.2 Gender and Age Differences in Big Five Confidence, Accuracy and Bias Scores ... 218
6.4 Big Five Bias ... 221
6.5 Factorial Structure of Cognitive and Big Five Bias Scores ... 222
6.6 Practical and Other Research Implications ... 223
6.6.1 Clinical and Counselling Psychology ... 224
6.7 Other Limitations ... 225
6.8 Conclusions ... 226
List of Tables
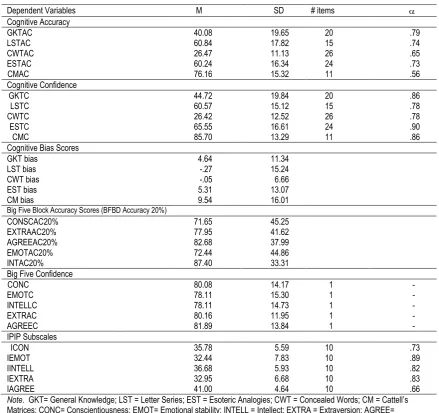
Table 1.1 Brief Overview of Studies ... 6 Table 3.1 Descriptive Statistics for all Dependent Variables (N = 127) ... 78 Table 3.2 Means of Confidence and Bias Scores for Males (N = 40) and Females (N
= 87) on Cognitive Tasks in Study 1. ... 85 Table 3.3 Correlations between Age and Bias Scores ... 86 Table 3.4 Mean Bias Scores for First and Fourth Quartiles on Cognitive Tasks ... 86 Table 3.5 Correlations Among IPIP Subscale Scores and Accuracy, Confidence and
Bias and Partial Correlations Between Big Five Scores and Accuracy,
Confidence and Bias (N = 127) ... 88 Table 3.6 Descriptive Statistics for Big Five Accuracy Scores (N= 127) ... 90 Table 3.7 Correlations among Big Five Accuracy Scores and Cognitive Confidence,
Accuracy and Bias Scores ( N = 127). ... 92 Table 3.8 Mean Big Five Confidence Scores for Males (n = 40) and Females (n = 87)
... 92 Table 3.9 Mean Big Five Accuracy Scores for Males (n = 40) and Females (n = 87) 92 Table 3.10 Correlation Matrix of Cognitive and Personality Confidence Variables
(N= 127) ... 93 Table 3.11 Summary of Exploratory Structural Analysis Results for Cognitive
Confidence and Big Five Personality Confidence Scores, Using Principal Axis
Factoring with Oblique Rotation (N = 127) ... 94 Table 3.12 Correlations between Cognitive Bias Scores (N = 127) ... 95 Table 3.13 Principal Axis Factoring of Cognitive Bias Scores (N = 127) ... 95 Table 4.1 Pattern Matrix of IPIP Items using Principal Components Analysis with
Table 4.2 Correlations Among the IPIP Subscales ... 129 Table 4.3 Pattern Matrix of IPIP Form B Items using Principal Components Analysis
with Promax Rotation and Kaiser Normalisation (N = 405). ... 130 Table 4.4 Descriptive Statistics for Accuracy Scores Derived from Methods 1, 2, and
3 (N=405) ... 131 Table 4.5 Descriptive Statistics for all Dependent Variables (N = 405) ... 133 Table 4.6 Correlations among Block and Item-by-Item Confidence Ratings (N = 405)
... 134 Table 4.7 Principal Axis Factoring of the Item-by-Item and Block Confidence Rating
Scores (N = 405) ... 135 Table 4.8 Means for Block and Item-by-Item Big Five Confidence Ratings for Males
(N = 85) and Females (N = 318) in Study 2. ... 136 Table 4.9 Correlations among Big Five Block Accuracy Scores (N = 405). ... 138 Table 4.10 Correlations among Big Five Item-Level Accuracy Scores (N = 405). ... 138 Table 4.11 Correlations among Big Five Block and Item-Level Accuracy Scores (N =
405) ... 139 Table 4.12 Means for Global Block and Item-by-Item Big Five Accuracy Scores for
Males (N = 85) and Females (N = 318) in Study 2. ... 140 Table 4.13 Correlations among Personality Bias Scores (N = 405). ... 141 Table 4.14 Summary of Exploratory Structural Analysis Results for Big Five
Personality Bias Scores, Using Principal Axis Factoring (N = 405) ... 141 Table 4.15 Correlations among IPIP and IPIP Form B Subscale Scores ... 142 Table 4.16 Pattern Matrix for all IPIP and IPIP Form B Subscale Scores, Using
Table 5.2 Means of Confidence and Bias Scores for Males (n = 61) and Females (n = 182) for Cognitive Tasks in Study 3. ... 177 Table 5.3 Mean Bias Scores for First and Fourth Quartiles on Cognitive Tasks (N =
243) ... 178 Table 5.4 Correlations among IPIP subscale scores and GF Confidence and Gf Bias
and Partial Correlations between Big Five Scores and Confidence and Bias (N =
243) ... 179 Table 5.5 Pattern Matrix of IPIP using Principal Components Analysis with
Promax rotation and Kaiser Normalisation (N = 243) ... 180 Table 5.6 Pattern Matrix of IPIP Form B using Principal Components Analysis with
Promax rotation and Kaiser Normalisation (N = 243) ... 182 Table 5.7 Descriptive Statistics for Accuracy Scores Derived from Methods 1, 2, and
3 (N=243) ... 184 Table 5.8 Descriptive Statistics for Self-Report Dependent Variables (N = 243) ... 185 Table 5.9 Correlations among Block and Item-by-Item Confidence Ratings (N = 243)
... 187 Table 5.10 Principal Axis Factoring of Big Five Item-by-Item and Block Confidence
Rating Scores (N = 243) ... 187 Table 5.11 Means for Block and Item-by-Item Big Five Accuracy Scores for Males (n
= 61) and Females (n = 182) in Study 3. ... 188 Table 5.12 Means for Block and Item-by-Item Big Five Confidence Ratings for Males
(N = 61) and Females (N =182) in Study 3. ... 188 Table 5.13 Means for Item-by-Item Big Five Bias Scores for Males (N = 61) and
Table 5.15 Correlations among Big Five Item-Level Accuracy Scores (N = 243). ... 191
Table 5.16 Correlations among IPIP and IPIP Form B Subscale Scores ... 192
Table 5.17 Pattern Matrix for all IPIP and IPIP Form B Subscale Scores, Using Principal Components Analysis with Oblique Rotation (N = 243) ... 193
Table 5.18 Correlations between Positive Affect and Personality Confidence Scores (N = 243) ... 194
Table 5.19 Correlations Among all Confidence Variables in Study 3 (N = 243). ... 196
Table 5.20 Principal Axis Factoring with Oblique Rotation all Big Five and all Gf Confidence Scores (N = 243) ... 198
Table 5.21 Correlations among Cognitive and Big Five Bias Scores ... 199
Table 5.22 Principal Axis Factorings of Cognitive and Big Five Bias Scores (N = 243). ... 199
Table 6.1 Accuracy Scores for the BFBD and the IPIP-Form B ... 214
Table 6.2 Confidence Scores for the BFBD and the IPIP-Form B ... 216
List of Figures
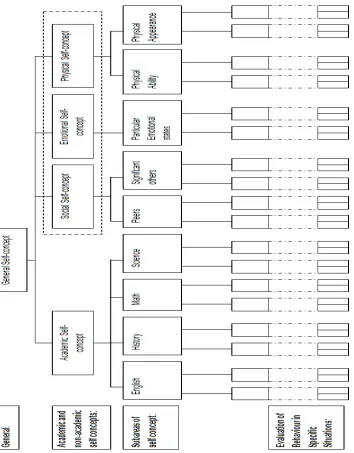
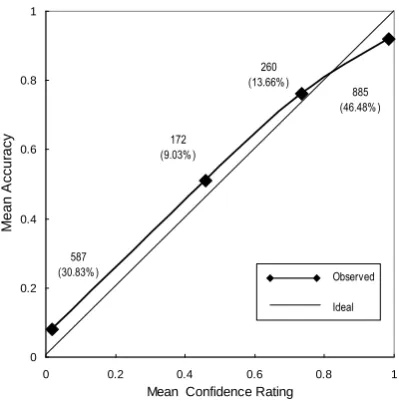
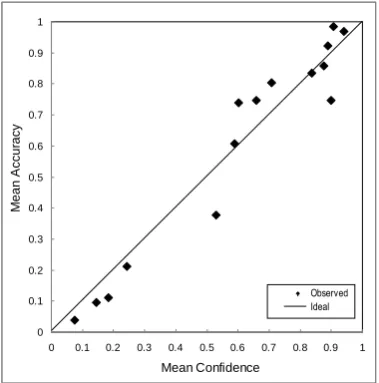
Figure 2.1: Diagrammatic representation of the multidimensional, hierarchical model of self-concept... 44 Figure 3.1. Calibration curve for the Letter Series Task. ... 79 Figure 3.2. Scatterplot of mean confidence rating and mean accuracy scores for the
Letter Series Task. ... 80 Figure 3.3. Calibration curve for the Cattell‟s Matrices Task. ... 80 Figure 3.4. Scatterplot of mean confidence rating and mean accuracy scores for the
Cattell‟s Matrices Task. ... 81 Figure 3.5. Calibration curve for the General Knowledge Task. ... 81 Figure 3.6. Scatterplot of mean confidence rating and mean accuracy scores for the
General Knowledge Task... 82 Figure 3.7. Calibration curve for the Esoteric Analogies Task. ... 82 Figure 3.8. Scatterplot of mean confidence rating and mean accuracy scores for the
Esoteric Analogies Task. ... 83 Figure 3.9. Calibration Curve of mean confidence rating and mean accuracy scores for the general Concealed Words Task. ... 83 Figure 3.10. Scatterplot of mean confidence rating and mean accuracy scores for the
general Concealed Words Task. ... 84 Figure 5.1. Calibration Curve of mean confidence rating and mean accuracy scores for the Letter Series Task. ... 173 Figure 5.2. Scatterplot of mean confidence rating and mean accuracy scores for the
Figure 5.4. Scatterplot of mean confidence rating and mean accuracy scores for the Esoteric Analogies Task. ... 175 Figure 5.5. Calibration curve for the Word Association task. ... 175 Figure 5.6. Scatterplot of mean confidence rating and mean accuracy scores for the
List of Appendices
Chapter 1 – Introduction
1.1 Structure of the Dissertation
This dissertation comprises six chapters. This chapter briefly sets the scene for the next five chapters, provides the reader with an overview of the broad aims 39of this PhD research, and concludes with a tabular overview of the three studies carried out in this dissertation. The research literature is reviewed in Chapter 2. Studies 1, 2, and 3 are covered in Chapters 3, 4, and 5 respectively. Chapter 6 forms the general discussion.
1.2 Statement of the Problem
Accurate self-insight into one‟s cognitive abilities and personality traits is fundamental to navigating daily life. Realistic self-views of personal strengths and weaknesses in both these areas, for example, allows individuals to make appropriate academic, career, and even relationship decisions, that capitalise on talents and at the same time consider areas of difficulty. Because individuals receive extensive feedback from each other and from their natural environments, accurate self-knowledge should be a relatively easy task for most people. Empirical evidence, however, suggests that people lack self-knowledge in some situations, and that there is considerable variation across individuals (e.g., Ackerman, Beier, & Bowen, 2002; Alicke, 1985; Dunning, 2005; Ehrlinger & Dunning, 2003; Hansford & Hattie, 1982; Kleitman, 2008; Kleitman & Stankov, 2001; Pallier et al., 2002; Stankov, 1998, 1999a, 2000a, 2000b; Stankov & Crawford, 1996a, 1996b, 1997).
scores on tests or tasks of these intellectual abilities. Participants‟ self-perceptions of abilities are regarded as being accurate if they are highly correlated with performance measures. Earlier research showed that average correlations between these variables ranged between .20 and .30 suggesting that peoples‟ perceptions of their abilities are not closely tied to actual performance (for reviews see Hansford & Hattie, 1982; Mabe & West, 1982). Later research paints a slightly more flattering portrait with correlations between self-estimated and tested abilities ranging from .35 to .58 (e.g., Ackerman, 1997; Ackerman et al., 2002; Ackerman, Kanfer, & Goff, 1995; Borkenau & Liebler, 1993b; Paulhus & Morgan, 1997).
Correlational techniques have also been used when examining the accuracy of trait self-reports when making personality judgments. Within the personality domain, judging the accuracy of trait self-ratings is more complicated than in the cognitive area as there are no perfect criteria for evaluating the accuracy of these types of judgements (Colvin & Funder, 1991). Inter-judge agreement (consensus) and self-other agreement are the most commonly used criteria for determining the accuracy of trait self-reports. In both types of studies, low to moderate levels of agreement (i.e., self-peer or peer-peer ratings of personality) have been obtained, with mean correlation co-efficients being in the order of .30 (e.g., Funder, 1999; Funder & Colvin, 1997; Funder, Kolar, &
Blackman, 1995; John & Robins, 1993; Meyer et al., 2001). Importantly, however, consensus does not necessarily imply accuracy (Blackman & Funder, 1998; Swan & Gill, 1997).
preceded the emergence of the emotional intelligence (EI) construct where researchers grappled for almost a century with the problem of objectively estimating people‟s awareness of their emotional states. In the end, progress was made when researchers showed a willingness to experiment with innovative measurement methods and to tolerate vigorous challenges to the reliability and validity of their instruments. A major aim of this dissertation was to develop and test various accuracy methods for use with personality judgments within Goldberg‟s (1997) Five-Factor taxonomic framework of personality structure.
The second body of psychological enquiry encompasses those studies that have investigated the above-average effect, also coined comparative ability mis-calibration. In these studies, participants have typically compared their own abilities with those of their peers. For example, university students may be asked to compare their own
academic performance relative to their classmates by endorsing a percentile rank from 0 (I’m at the very bottom) to 50 (I’m exactly average) to 99 (I’m at the very top). Within the cognitive domain, the general findings indicate that individuals in the bottom
quartile for various cognitive tasks overestimate themselves as being above average, and those in the top quartile underestimate their performance (e.g., Dunning, Johnson, Ehrlinger, & Kruger, 2003; Kruger, 1999; Kruger & Dunning, 1999).
The third area of empirical enquiry that investigates the accuracy of self-insight encompasses the overconfidence studies wherein individuals provide or select answers to various cognitive test items and then indicate how confident they are that each answer is correct. In general, the research findings suggest that people are overconfident
Stankov & Crawford, 1996a, 1996b, 1997; Stankov & Lee, 2008; Tomassini, Solomon, Romney, & Krostad, 1982; Winman, Juslin, & Bjorkman, 1998). There are also
instances where underconfidence has been displayed. However, the evidence for the tendency of people to be overconfident regarding their abilities and skills, is quite substantial (e.g., Allwood & Granhag, 1996; Juslin, 1994; Kleitman & Stankov, 2001; Stankov, 1998; Stankov & Crawford, 1996a, 1996b, 1997; Stankov & Lee, 2008). When individuals are either underconfident or overconfident regarding their skills and abilities, their insight is regarded as being inaccurate (or mis-calibrated). The main overall aim of this dissertation was to contribute to this body of knowledge by extending calibration research into the domain of personality judgments.
1.3 Brief Rationale for Including Personality Judgments
Although investigation of the confidence-accuracy relationship regarding
accurate self-monitoring of cognitive performance is an important area of psychological inquiry, Koehler, Brenner, Liberman and Tversky (1996) assert that investigation of intuitive personality judgments is equally important to personality, clinical,
organizational, and social psychologists (John & Robins, 1994). For example, within clinical psychology, inaccurate self-insight underlies various psychological disorders such as depression and personality dysfunction (e.g., Dimaggio et al., 2005; Dimaggio, Semerari, Carcione, Procacci, & Nicolo, 2006). On a practical level, accurate
personality judgements are vital because they impact on daily life (e.g., do my
mis-calibration is a complex process that is difficult to operationalise. Nevertheless, as noted earlier, one of the major aims of this dissertation was to develop various accuracy protocols (see Chapters 3 and 4) and use them to examine personality mis-calibration (see Chapters 4 and 5). The calibration paradigm (see Chapter 2) was used to assess the confidence-accuracy relationship (i.e., self-monitoring) within both the cognitive and personality arenas.
1.4 Broad Aims and Overview of Current Studies
This dissertation has several broad aims:
1. To investigate mis-calibration within the cognitive realm.
2. To investigate self-confidence and mis-calibration within personality judgments.
3. To investigate the impact of individual differences (e.g., age, need for cognition) variables on cognitive confidence and mis-calibration. 4. To investigate the impact of individual difference variables (e.g., age,
private self consciousness, affect) on personality confidence judgments. 5. To investigate the factorial structure of both Big Five Confidence and
Big rating Scales.
6. To investigate the factorial structure of both cognitive and personality confidence judgments.
7. To investigate the factorial structure of both cognitive and personality bias judgments.
theory of Fluid and Crystallised Intelligence. In Study 2, only personality measures were used. In Studies 1, 2 and 3, personality judgments were made within the Five-Factor taxonomic framework of personality structure (Goldberg, 1997).
Table 1.1
Brief Overview of Studies
Study 1 Study 2 Study 3
Cognitive and Big Five confidence and bias judgments
Big Five confidence and bias judgments only
Cognitive and Big Five confidence and bias judgments
Face-to-face testing (N = 127)
Web based testing (N= 452)
Web based testing (N= 252) Examine mis-calibration across Gf, Gc,
& Gv tasks Examine mis-calibration with Gf tasks Investigate whether individual
differences in gender, age, personality and ability impacts on cognitive confidence and mis-calibration
Investigate whether individual differences in gender, age, personality, ability, need for cognition (NFC), and affect impacts on cognitive confidence
Trial method 1 for determining Big Five accuracy
Investigate whether individual differences in gender and age impacts on Big Five accuracy, and confidence
Trial various methods of assessing Big Five accuracy. Obtained Big Five confidence judgments
Investigate whether individual differences in gender and age impacts on Big Five accuracy, confidence, and mis-calibration
Investigate whether individual differences in gender, age, private self-consciousness, affect, and NFC impacts on Big Five confidence.
Investigate the factorial structure of item-by-item and Block Big Five confidence judgments
Investigate the factorial structure of item-by-item and block Big Five confidence judgments
Investigate the factorial structure of cognitive and personality confidence judgments
Investigate factorial structure of Big Five confidence and Big Five rating
scales
Investigate factorial structure of Big Five confidence and Big Five rating scales Investigate the factorial structure of cognitive, personality, and self-report ability confidence judgments
Investigate the factorial structure of
Chapter 2 – Literature Review
2.1 Introduction
This chapter is divided into six subsections. The first section defines
self-confidence within a meta-cognitive framework. The calibration paradigm and numerical and graphical measures of calibration are discussed in section two. Theoretical
explanations of cognitive mis-calibration follow. Section four reviews the calibration research literature. Justification for extending calibration research into the domain of personality is addressed in section five. Measurement issues and empirical findings in the personality judgment literature follow in section six.
2.2 Confidence and Meta-cognition
Item-by-item confidence judgments which were examined in the current studies are thought to represent the important meta-cognitive process of self-monitoring
(Kleitman & Stankov, 2007; Stankov, 1999b). Meta-cognition refers to cognition about cognition, and is generally considered to have two elements: knowledge about one‟s own cognition, and the regulatory sub-processes of meta-cognitive control (Brown, 1987; Schraw & Dennison, 1994; Schraw & Moshman, 1995). Five regulatory sub-processes have been mentioned in the literature: planning, information management, monitoring, debugging, and evaluation (e.g., Artz & Armour-Thomas, 1992). Schraw and Dennison (1994) operationalised these sub-processes as follows:
1. Planning: planning, goal setting, and allocating resources prior to learning. 2. Information management: skills and strategy sequences used on-line to
3. Monitoring: assessment of one‟s learning or strategy use.
4. Debugging: strategies used to correct comprehensions and performance errors.
5. Evaluation: analysis of performance and strategy effectiveness after a learning episode (pp. 474-475).
It is generally argued that the sub-processes of planning, monitoring, and
evaluation are important variables in explaining effective learning (Flavell, 1977, 1987), and therefore are an important area of psychological enquiry. Within differential
psychology in Australia, researchers have been studying the processes of
self-monitoring and evaluation using confidence judgments obtained from tests of human cognitive abilities (e.g., Kleitman & Stankov, 2001; Pallier, 2003; Pallier et al., 2002; Stankov, 1999a, 1999b; Stankov & Crawford, 1996a, 1996b). The current studies will continue this line of enquiry. This area of research is important not only because accurate self-assessment or self-monitoring of our cognitive performance is a
2.3 Calibration Research
2.3.1 The Experimental Paradigm
Calibration studies evaluate the correctness of individuals‟ subjective probability ratings, or confidence in their judgements and predictions (Keren, 1991).
Self-monitoring is operationalised by self-confidence scores; that is, individuals are asked to express how confident they are in their judgements, answers, or predictions. The
paradigm has been discussed at length in the literature and is therefore not repeated here (see Harvey, 1997; Kleitman, 2008; Stankov & Kleitman, 2008).
2.3.2 Numerical Measures of Calibration
2.3.2.1 Item-by-Item Confidence Scores (Self-Monitoring)
current research. Throughout this dissertation, the terms bias and mis-calibration reflect the discrepancy between confidence and accuracy and were used interchangeably.
2.3.2.2 Self Evaluation Scores (Mis-calibration at the Global Level)
The literature also points to the distinction between the meta-cognitive processes of self-monitoring (i.e., item-by-item confidence judgments) and self-evaluation
(Schraw & Moshman, 1995). This evaluative aspect of meta-cognition has been measured by asking participants to estimate the proportion of items they have solved correctly after finishing the test (i.e., post test performance estimate or PTPE). A bias score that is similar to the one reported earlier can also be obtained using the PTPE score (Stankov & Crawford, 1996b). This bias score requires that the actual mean percentage of correct responses is subtracted from the estimated percentage of correctly solved items. A negative value PTPE bias score represents under-evaluation whereas a positive value indicates over-evaluation. These bias scores will be calculated for the cognitive tasks in Study 3.
2.3.3 Graphical Measures of Calibration
2.3.3.1 Calibration Curves
and overconfidence regions of the graph (Keren, 1991). Frequency-weighted curves are a useful aid, and were inspected for all cognitive tasks used in Studies 1 and 3.
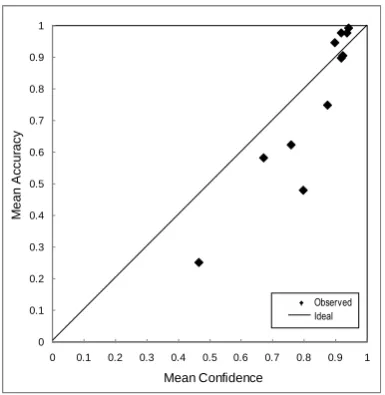
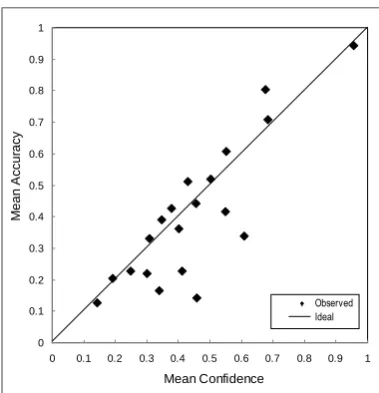
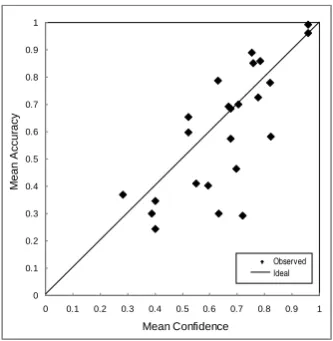
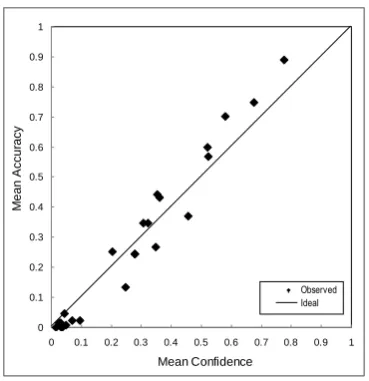
2.3.3.2 Item-Specific Scatterplots
In a further methodological development, Stankov (1999a) argued that calibration curves fail to provide information about individual items that may have contributed to mis-calibration for a particular task. He advocated that item-specific information for each cognitive task be depicted graphically by producing plots of the mean confidence ratings and proportion correct scores (i.e., item difficulties) for each item in a given task. For items that are well calibrated, the proportion correct and mean confidence ratings should be the same. Wide separation of the points indicates mis-calibration for that item. Item-specific plots were produced in addition to the frequency-weighted calibration curves described previously for all the cognitive tasks in the present studies.
2.4 Theories of Cognitive Mis-calibration
Four different theoretical perspectives have sought to explain underconfidence and overconfidence effects in the cognitive domain. They are a) heuristics and biases, b) error, c) differing modes of uncertainty, and d) ecological accounts of mis-calibration respectively.
2.4.1 Heuristics and Biases Approach
represents an example of an irrational decision making process (Stankov & Kleitman, 2008). Gigerenzer and colleagues, however, questioned the appropriateness of applying Bayes rule to confidence judgments and mis-calibration (Gigerenzer, 1991, 1992, 1993, 1996a, 1996b, 2000; Gigerenzer, Hoffrage, & Kleinbolting, 1991; Gigerenzer & Murray, 1994). More recently, within differential psychology, Kleitman (2003) investigated whether participants in her studies violated the additivity rule of probability theory. That is, where the sum of probability judgments made about mutually exclusive events (i.e., confidence ratings in her work) should equal one (or 100% on a confidence rating scale). Kleitman defined subadditivity as being when the sum of confidence ratings fell below 100% and superadditivity when the sum of confidence ratings exceeded 100%. Results showed that 60% of her participants deviated from the additivity rule. This finding suggests that a significant number of participants did not use the principles of probability when providing confidence ratings in their answers.
correct response. Overconfidence is predicted if people strongly believe that a response alternative is correct despite being based on a small amount of information.
Underconfidence is predicted if individuals weakly believe that a response alternative is correct, despite being based on a large amount of information (Griffin & Tversky, 1992). An example problem from Kahneman and Tversky (1973) is presented below:
A panel of psychologists have interviewed and administered personality tests to 30 engineers and 70 lawyers, all successful in their respective fields. On the basis of this information, thumbnail descriptions of the 30 engineers and 70 lawyers have been written…For each description, please indicate your
probability that the person described is an engineer on a scale from 0 to 100 (p. 241).
Jack is a 45-year-old man. He is married and has four children. He is generally conservative, careful, and ambitious. He shows no interest in political science and spends most of his free time on his many hobbies which include home carpentry, sailing, and mathematical puzzles.
The probability that this man is one of the 30 engineers in the sample of 100 is _____% (p. 241).
2.4.2 Error Explanations of Mis-calibration
Error explanations of mis-calibration, on the other hand, stress the importance of random error (e.g., attentional lapses, fatigue, memory lapses) as a contributing factor to biased confidence judgments. According to this position, confidence judgments
comprise a true judgment component that is based on cue validities, as well as random error (e.g., Soll, 1996). Soll suggested that random error can affect judgments in multiple ways. Cognitive inconsistency is the first consideration in terms of error. That is, in the absence of practice effects, if an individual made several judgments about the same item over time, the judgments may differ because of idiosyncratic random errors (Soll, 1996). Random error can also occur if an individual has limited ecological
experience with the problem or task presented by experimenter. For example, a doctor is presented with a diagnostic vignette and asked to make a diagnosis, and then provide a confidence rating indicating how confident he or she is that the diagnosis is correct. If the doctor is experienced with the particular disease and draws upon this information, the random error component decreases. The opposite is true if the doctor has limited information. Therefore, if random error is great then under-or-over confidence is the likely result (Budescu, Wallsten, & Au, 1997; Erev, Wallsten, & Budescu, 1994). By contrast, another group of researchers asserted that mis-calibration results when differing types of uncertainty influence the judgment process.
2.4.3 Differing Modes of Uncertainty
tasks that involved paired comparisons. Juslin and Olsson contended that the
uncertainty which underlies confidence judgements is the result of two factors: noise in the nervous system or incomplete states of knowledge. In other words the uncertainty that underlies perceptual tasks differs from that of other cognitive tasks. For example, a participant is required to discriminate between lifted weights to determine which weight is heavier. Mis-calibration in this case can be attributed to Thurstonian uncertainty (i.e., noise in the sensory system). When an individual provides an answer to a general knowledge question such as, “Which city hosted the Winter Olympic Games in the year 2006?” mis-calibration can be attributed to Brunswikian uncertainty (i.e., incomplete states of knowledge).
According to this account, underconfidence is expected with all perceptual tasks because of sensory noise. However, this expectation is not supported in the research literature as Stankov (Stankov, 1999a) provided evidence where overconfidence was apparent for perceptual tasks within the auditory, olfactory, tactile and gustatory modalities. Similarly, in Pallier et al.‟s (2002) research, overconfidence was apparent for the visual perceptual Hidden Figures and Concealed words tasks used in their work.
2.4.4 Ecological Approach
environments. Moreover, encoding of frequency information is both automatic and requires minimal attentional resources or effort.
PMM theory (Gigerenzer et al., 1991) argues that mis-calibration results from researchers selecting general knowledge items that are tricky and unrepresentative of the real world. Gigerenzer et al. (1991) reasoned that if researchers selected a
representative sample of items, then the overconfidence bias that is apparent with general knowledge tasks is likely to disappear, given that individuals are well calibrated to their natural environments. Thus, these theorists have argued that individuals‟
knowledge about their natural environments helps them generate cues, which, in turn, are used to answer general knowledge test items. Therefore, mis-calibration occurs when there is a mismatch between the cue validity on a general knowledge test item and its respective ecological validity. In other words, individuals are accurate self-monitors if the answers to general knowledge questions are already stored in their long-term knowledge structures (i.e., a local mental model), or if they can use inductive inferences to solve general knowledge problems (i.e., a probabilistic mental model). The important qualifier, however, is that response options must be ecologically valid (Gigerenzer et al., 1991).
PMM theory (Gigerenzer et al., 1991) also distinguishes between the item-by-item confidence judgments that are given during a cognitive test and the post-test percentage correct estimates that are given at the end of the test. In the latter case, individuals estimate the percentage of items they think they answered correctly.
may be influenced by base rates of correct performance on previous tests of a similar nature whereas response to a single item about the largest state in Australia would be influenced by ecological validities such as population estimates, geographical size, and so forth. Therefore, it was concluded that item-by-item confidence judgments and global post test percentage correct estimates, are not subserved by the same cognitive processes. Usually, mean post-test estimates are smaller than mean confidence ratings for a test and often display better calibration, or even under-evaluation, compared to confidence bias measures (Gigerenzer et al., 1991; Schneider, 1995; Stankov &
Crawford, 1996a, 1996b). When this occurs, it is called the confidence/frequency effect (Gigerenzer et al., 1991).
selected at random from a representative set of items (Brenner et al., 1996; Griffin & Tversky, 1992; Liberman, 2004; Soll, 1996).
This approach has largely ignored other important factors such as individual differences (cf. Kleitman, 2003, 2008; Stankov & Kleitman, 2008). Moreover, PMM theory (Gigerenzer et al., 1991) predicates that confidence ratings from differing
cognitive domains should not be consistently correlated since their respective ecological and test cue validities are likely to be different. However, there exists a large body of research where consistent correlations have been found between confidence ratings from differing cognitive domains (e.g., Baker, 2001; Kleitman, 2003, 2008; Kleitman & Stankov, 2001; Pallier et al., 2002; Stankov, 1999b, 2000a; Stankov & Kleitman, 2008).
Given the underlying assumption of PMM theory (Gigerenzer et al., 1991) is that ecological validity affects mis-calibration, it is reasonable to investigate whether individuals are well-calibrated with judgments that are made on a daily basis.
Personality judgments are a case in point as they are implicated in many aspects of daily life (see sections 2.6, 2.7 and 2.8 of this chapter for details). In terms of the personality confidence judgments, it could be argued that Gigerenzer‟s model offers insight with regard to personality mis-calibration. Specifically, the foundation of PMM theory (Gigerenzer et al., 1991) is that individuals are well calibrated to their natural
environments and calibration can be expected where ecological validity is high. It will be argued that personality judgments are of high ecological validity in today‟s society and will therefore exhibit the good calibration predicted by PMM theory (Gigerenzer et al., 1991).
2.4.5 Summary
in isolation, however, can explain allcalibration research findings. Moreover,
examination of individual differences has usually been ignored by the theories discussed above. The individual differences approach to the study of confidence and
mis-calibration has not been neglected, however, and accounts for a large proportion of recent calibration research. The next section reviews what we have learned so far, starting with the hard-easy effect.
2.5 Empirical Findings in Calibration Research
2.5.1 The Hard-Easy Effect
The hard-easy effect has been demonstrated with cognitive tasks wherein individuals appear to exhibit higher levels of overconfidence for difficult tasks and underconfidence or good calibration for easy tasks (Baranski & Petrusic, 1994; Harvey, 1997; Juslin & Olsson, 1997; Keren, 1991). The relationship between task difficulty and underconfidence or overconfidence has been coined the calibration difficulty effect (Griffin & Tversky, 1992) or the hard-easy effect (Gigerenzer et al., 1991). This effect has been demonstrated with vocabulary and general knowledge tasks (e.g., Koriat et al., 1980; Lichtenstein & Fischhoff, 1977; Pulford & Colman, 1997; Schraw & DeBacker Roedel, 1994), with visual perceptual tasks such as the Line Length task (Baranski & Petrusic, 1994; Stankov, 1999a), and with discrimination of American and European handwriting (Lichtenstein & Fischhoff, 1977).
2.5.2 Good Calibration
and Allwood (2000) found overconfidence on a task that required hindsight bias, where questions were asked about a filmed kidnapping.
Stankov (1999a) and his collaborators (Kleitman & Stankov, 2001; Pallier et al., 2002, Study 2; Stankov, 1998; Stankov & Crawford, 1996b, 1997) demonstrated that individuals were reasonably well calibrated on the Raven‟s Progressive Matrices Test. This test would be novel to participants and perhaps greater attentional resources were given to this task leading to better calibration. However, the literature contains instances where overconfidence was demonstrated for Ravens Progressive Matrices (Pallier et al., 2002, Study 1; Stankov & Dolph, 2000). Random errors (e.g., motivational factors) could explain this inconsistency in Pallier‟s first study. That is, military participants may have tried to reduce cognitive dissonance (e.g., “I believe I am bright, therefore my answer must be correct”) by elevating their confidence ratings. This explanation makes sense as these participants were overconfident across a diverse range of cognitive tasks.
Good calibration has also been demonstrated on digit span (Baker, 2001; Crawford & Stankov, 1996; Stankov & Crawford, 1996a, 1996b), and visual memory spatial tasks (Baker, 2001). Good calibration for the memory tasks could occur because all of the information required for task solution was within the span of immediate awareness facilitating better self-monitoring.
2.5.3 Underconfidence
Research indicates that people tend to be underconfident when answering questions about future events (Vreugdenhil & Koele, 1988), when responding to sensory discrimination tasks (Bjorkman, Juslin, & Winman, 1993; Juslin, 1994), with visual perceptual tasks such as discriminating between the length of various lines (Crawford & Stankov, 1996; Kleitman & Stankov, 2001; Pallier et al., 2002, Study 2; Petrusic & Baranski, 1997; Stankov & Crawford, 1996a, 1996b, 1997), and with unfamiliar computer-based tasks (Briggs, Burford, & Dracup, 1998). Moreover, Bjorkman et al. (1993) contended that underconfidence is a pervasive phenomenon in tasks of sensory discrimination. Two theories provide possible explanations for these findings. From the ecological stand point, the aforementioned tasks would not be representative of participants‟ natural ecology thereby leading to mis-calibration (i.e., underconfidence in these instances). Additionally for the sensory discrimination tasks, noise in the sensory system may have led to mis-calibration.
Stankov (1999a), however, investigated whether underconfidence generalised to other sensory modalities (i.e., auditory, kinaesthetic, gustatory, and olfactory). Another aim of Stankov‟s research was to investigate whether the tendency of participants to be underconfident on the Line Length task also occurred with other visual perceptual tasks, such as the Square Gap task and the Muller-Lyer Illusion. Only a Tactile Texture and a Line Length task displayed underconfidence. Contrary to expectations, participants were well calibrated on the Square Gap task and were overconfident on the Muller-Lyer Illusion. Also, the weight, gustatory, and olfactory tasks displayed overconfidence, whereas a pitch task displayed perfect calibration. Stankov‟s overall conclusion was that the pervasive underconfidence effect found with the Line Length task does not
perceptual tasks used in his study. A similar conclusion was reached by Pallier et al. (2002, Study 2) where participants were presented with a wide range of cognitive and perceptual (both visual and sensory) tasks. Two visualization tasks in Study 1 of Pallier‟s research, however, displayed overconfidence (i.e., the Hidden Figures Task and the Concealed Words Task) when administered to military participants. As noted earlier, this sample may be have been motivated to reduce cognitive dissonance by providing higher confidence ratings thereby resulting in overconfidence. Study 1 investigates whether participants are mis-calibrated on a similar task to that used by Pallier (i.e., a Concealed Words task). Study 1 will contribute further information as to whether underconfidence generalises from the Line Length task to another visual perceptual task.
2.5.4 Overconfidence
In general, research suggests that individuals are often more confident than they are accurate. Overconfidence has been displayed by many different participant groups, including physicians (Christensen-Szalanski & Bushyhead, 1981), medical students (O'Keefe, Wildemuth, & Freidman, 1999), clinical psychologists (Oskamp, 1965), engineers (Kidd, 1970), lawyers (Wagenaar & Keren, 1985), United States Air Force recruits (Pallier et al., 2002), university students (Granhag et al., 2000; Kleitman & Stankov, 2001; Pallier et al., 2002; Pulford & Colman, 1997; Renner & Renner, 2001; Schaefer, Williams, Goodie, & Campbell, 2004; Stankov, 1998, 1999b; Stankov & Crawford, 1997), CIA analysts (Cambridge & Shreckengost, 1978, as cited in Sharp, Cutler, & Penrod, 1988), adolescents (Newman, 1984), children (Allwood, Granhag, & Jonsson, 2006; Newman & Wick, 1987), and tennis players (Fogarty & Ross, 2007).
Else, 2001; Ronis & Yates, 1987), prediction of outcomes of past events (Lichtenstein, Fischhoff, & Phillips, 1982), assessment of reading skills (Glenberg & Epstein, 1987; Lin & Zabrucky, 1998), marketing management predictions (Mahajan, 1992),
categorical judgement tasks (Schneider, 1995), motor task performance (West & Stanovich, 1997), eye witness memory (Bornstein & Zickafoose, 1999), economic forecasts (Braun & Yaniv, 1992), hindsight bias (Granhag et al., 2000), psychology course related quizzes (Renner & Renner, 2001), tennis knowledge (Fogarty & Ross, 2007), tennis rules (Fogarty & Ross, 2007), and with vocabulary and general knowledge tasks (Allwood & Granhag, 1996; Crawford & Stankov, 1996; Juslin, 1994; Kleitman & Stankov, 2001; Schaefer et al., 2004; Stankov, 1998, 1999b; Stankov & Crawford, 1996a, 1996b, 1997; West & Stanovich, 1997). Essentially, the aforementioned research suggests that the overconfidence phenomenon is a robust finding that has demonstrated external validity across numerous participant groups and across a number of different domains. Some researchers have interpreted overconfidence as a pervasive
psychological bias (e.g., Baron, 1994). A general knowledge task has been included in Study 1 and it is expected that participants will be overconfident.
The literature reviewed thus far has focussed on examination of group
differences (i.e., calibration curves and bias scores) as opposed to the examination of individual differences, which are discussed next.
2.5.5 Self-Confidence and the Study of Individual Differences
From the individual differences perspective, confidence judgments represent the important meta-cognitive process of self-monitoring, an appraisal process whereby individuals evaluate the accuracy of their performance whilst working through
consistent inter-individual differences apparent in the confidence literature. For example, researchers have found thatmales tend to be more confident than females on cognitive tasks (e.g., Baker, 2001; Pallier, 2003; Pallier et al., 2002), experts are more confident than novices (Spence, 1996), and older children are more confident than younger children on counting tasks (Newman & Wick, 1987).
The following sections review gender, age and personality differences in terms of accuracy, self-monitoring, and mis-calibration. These are the areas that are explored in this dissertation.
2.5.5.1 Gender Differences in Accuracy, Confidence and
Mis-calibration
2.5.5.1.1 Gender Differences and Task Accuracy
Are females more intelligent than males? Halperin and LaMay (2000) tried to answer this question in their critical review of gender differences in the intelligence literature. They concluded that males did not differ from females in terms of general intelligence. However, gender differences appeared for visualisation tasks and for verbal tasks that required retrieval from long-term memory. Males displayed an advantage for the former, and females for the latter. Gender differences in accuracy are not elaborated on in any further detail as it is not the focus of this dissertation.
2.5.5.1.2 Gender Differences and Confidence
Language Internet-Based Test (TOEFLiBT). Studies 1 and 3 explored gender differences for the cognitive tasks used in those studies.
However, the current research programme differs from other calibration research in a further significant aspect: by examining gender differences in Big Five confidence judgments. A discussion of this investigation, carried out in Studies 1, 2, and 3, is deferred to later chapters.
2.5.5.1.3 Gender Differences and Mis-Calibration
Previous research findings of gender differences in mis-calibration in the cognitive arena have been somewhat mixed (Baker, 2001; Beyer & Bowden, 1997; Crawford & Stankov, 1996; Jonsson & Allwood, 2003; Pallier, 2003; Pulford & Colman, 1997; Stankov, 1998; Stankov & Crawford, 1997; Stankov & Lee, 2008). In Baker‟s study, males were significantly more mis-calibrated than females on only three of the five working memory tasks used in her test battery (i.e., Digits Backward, Visual Memory, and Letter-Number-Sequencing tasks). Pallier, on the other hand, conducted two studies, with Study 1 comprising young adults (mean age = 19.81, N = 185) and Study 2 consisting of older adults (mean age = 22, range 17 to 80, N = 303). Results for Study 1 indicated that males were both significantly more confident and mis-calibrated than their female counterparts on General Knowledge and Line Length tasks. Similarly, Pulford and Colman found that males were more mis-calibrated than females for
In the second study by Pallier (2003), older participants responded to two crystallised intelligence tasks (i.e., General Knowledge and a Synonyms Vocabulary test) and two fluid intelligence tasks (i.e., Letter Series and Cattell‟s Matrices). Again, results indicated significant differences between the genders, with males endorsing higher levels of confidence in the accuracy of their performance across all four of the cognitive tasks. For the Vocabulary and Letter Series tasks, males were also
significantly more calibrated than females. Gender differences in terms of mis-calibration for the General Knowledge task, however, were not significant. Similarly, Jonsson and Allwood (2003) did not find stable gender differences in mis-calibration for either a Word Knowledge task or a Logical Spatial task. More recently, Stankov and Lee (2008) found that males were significantly more mis-calibrated than females on the TOEFLiBT.
To summarise, the literature suggests that on tasks of cognitive abilities, males have been more confident, but not necessarily more calibrated, than females. Gender differences in mis-calibration within the cognitive domain are examined in Studies 1 and 3 of this dissertation. At this point it should be noted that calibration researchers have not previously examined Big Five mis-calibration or gender differences in Big Five mis-calibration, despite these being important topics of empirical investigation. Studies 2 and 3 (Chapters 4 and 5) have examined these gender differences.
2.5.5.2 Age Differences in Accuracy, Confidence and Mis-Calibration
2.5.5.2.1 Age Differences in Accuracy
increases, or stays stable, from age 20 to 65 years (Kaufman & Horn, 1996). As age differences in cognitive accuracy are well established in the literature, it will not be investigated in the current studies. Rather, Studies 1, 2 and 3 examined the hitherto unexplored role of age differences in personality accuracy. See Chapter 3 for further discussion.
2.5.5.2.2 Age differences in Confidence and Mis-calibration
Self-efficacy theory (Bandura, 1977), and cognitive dissonance theory (Festinger, 1957), may provide some insight into what to expect in terms of age
differences in cognitive confidence and mis-calibration. Self-efficacy describes people‟s beliefs and confidence about their own ability to perform in a particular domain
(Bandura, 1997). Domain specific self-efficacy beliefs and confidence increase with personal accomplishments within a domain, with the reverse happening when negative experiences occur. For instance, an elderly woman is invited to join a trivia club. If she wins a number of games her self-confidence in her ability to play the game increases, thereby increasing her motivation to try harder. If she often loses, however, both confidence and motivation decline. Blanton, Pelham, DeHart, and Carvallo (2001) related this decrease in motivation to cognitive dissonance theory (Festinger, 1957). This theory posits that individuals prefer that their cognitions, including those about their own actions, be consistent. Dissonance occurs when these cognitions are
tasks of cognitive abilities. In the test battery she finds one of the tasks quite difficult, and in order to reduce cognitive dissonance (i.e., I should know the answer to this as I am bright) she provides a higher confidence rating than is warranted resulting in overconfidence.
Few studies have examined age differences in cognitive confidence and mis-calibration (Crawford & Stankov, 1996; Pallier, 2003). Crawford and Stankov (1996) found small but significant correlations (from .22 to .23) between age and
overconfidence scores on tests of both Fluid intelligence (i.e., Raven‟s Progressive Matrices, Letter Number Sequencing, and Animals) and Crystallised intelligence (i.e., Vocabulary, Esoteric Analogies, Proverbs) as well as significant positive correlations between age and scores on the visual perceptual Line Length task. Similarly, Pallier (2003) also reported similar correlation coefficients between age and overconfidence scores for the fluid (r = .23) and crystallised (r = .16) tasks used in his study. However, within the sporting domain age did not co-vary with calibration on golf tasks (Fogarty & Else, 2005).
Given the paucity of studies that have examined the impact of age, a further aim of the current dissertation was to investigate whether age was associated with
confidence and mis-calibration for the tasks in Study 1 that spanned various cognitive domains. The current research programme also contributes to the literature by its investigation into age differences in Big Five confidence and mis-calibration.
2.5.5.3 Ability and Confidence
A potential source of individual differences in cognitive confidence and mis-calibration could be ability levels, as research in the area of relative comparisons
2003; Kruger & Dunning, 1999). In these types of studies, participants provide estimates in the form of percentile ranks of how their abilities compare to their peers (i.e., other undergraduate students). University students scoring in the bottom quartile on various cognitive tasks have significantly overestimated their own scores and percentile ranks on tests of Psychology (Dunning et al., 2003), humour (Kruger & Dunning, 1999, Study 1), logical reasoning (Kruger & Dunning, 1999, Study 2), and grammar (Kruger & Dunning, 1999, Study 3) compared with top quartile participants (see also Maki, Jonas, & Kallod, 1994; Moreland, Miller, & Laucka, 1981;
Shaughnessy, 1979). In these studies, researchers employ calibration type procedures in terms of relative comparisons although confidence ratings and bias scores were not calculated. For example, in the Kruger and Dunning studies (1999) participants responded to various cognitive tasks and were then asked to provide percentile
estimates about their own performance relative to peers. The sample was then divided into quartiles according to their actual performance and, for the first and fourth quartile individuals, percentile estimates were evaluated against their respective actual percentile ranks. Results suggested that people of lower ability overestimate their performance whilst the opposite is true for those of higher ability. Kruger and Dunning (1999) attributed these differences to a lack of metacognitive insight of lower ability participants.
Dunning‟s study found that the perceived average percentile rank in their data fell at the 66th percentile thus the division of participants into quartiles guarantees that bottom quartile participants are more mis-calibrated than individuals at top. That is, top quartile participants are closer to the 66th percentile than are individuals in the bottom quartile. Other literature (e.g., Burson et al., 2006; Krueger & Mueller, 2002) indicates that both top and bottom quartile participants can also be wrong about their judgments of relative comparisons. For instance, Burson et al. across three studies demonstrated that top quartile individuals underestimated their relative standing in terms of percentile ranks across 12 cognitive tasks whereas the opposite was true for bottom quartile participants. However, when tasks were moderately difficult, then both top and bottom quartile participants were just as accurate in their judgments of relative comparisons. Moreover for difficult tasks, top quartile participants were less accurate in their judgments than were their low ability counterparts.
The focus of this dissertation is not whether individuals believe that they are better than their average peer. Of interest to the current studies is that confidence judgments are obtained from individuals with regard to the accuracy of their own self-assessment within the cognitive domain, and if those of lower ability believe that they performed better than they actually did (Dunning, 2005), then these individuals should be more overconfident in their own performance than their high ability counterparts. This issue was investigated in Studies 1 and 3, where participants responded to various cognitive tasks.
2.5.5.4 Personality Correlates of Confidence and Mis-Calibration
individuals were less confident than non-anxious individuals on a Line-up Identification task (Nolan & Markham, 1998). Cognitive impulsivity co-varied with confidence and mis-calibration on a Comprehension Monitoring task (Walczyk & Hall, 1989). Clinically depressed people were more overconfident than their non-depressed peers when making judgments about real life events (Dunning & Story, 1991), but individuals with mild depression were better calibrated than their non-depressed counterparts on General Knowledge questions (Stone, Dodrill, & Johnson, 2001). Narcissism was positively correlated with overconfidence on a General Knowledge task (Campbell, Adam, & Joshua, 2004), and self confidence ratings obtained from an Esoteric Analogies task correlated negatively with imposterism (Want & Kleitman, 2006).
The focus of the current studies was to examine the relationships between the Big Five personality dimensions and cognitive confidence and mis-calibration. In terms of previous research using Big Five personality measures, moderately small but
significant positive correlations (r = .30) have been found between the
Openness/Intellect dimension and Working Memory confidence (Baker, 2001) and between Openness and confidence ratings on a Verbal Reasoning test (Kleitman, 2003). However, because Openness correlates with both the accuracy and confidence rating scores from tasks of cognitive abilities, it is important to partial out the variance that is attributable to accuracy when examining the relationship between this trait and
cognitive confidence measures (Schaefer et al., 2004). This practice was adopted in the current research programme.
as measured by NEO PI-R, did not correlate with the overconfidence factor that resulted from principal components analysis of a large battery of intellectual tasks in the Pallier et al. (2002) study. Conversely, Schaefer et al. (2004) found that the Extraversion subscale of the IPIP significantly predicted overconfidence for General Knowledge questions.
It is important to consider interpretative issues when examining whether Big Five personality variables co-vary with confidence and mis-calibration on cognitive tasks. Schaefer and his colleagues (2004) argued that interpretation of only simple zero-order correlations between overconfidence and each of the Big Five personality
dimensions may be misleading because of the shared variance that exists between the five personality factors (i.e., correlations .30 or greater). They advocated the use of partial correlations when examining the relationships between the Big Five dimensions and accuracy and confidence scores (i.e., mean confidence ratings and bias scores) derived from cognitive tasks. After reporting zero-order correlation coefficients between Big Five subscale scores and bias scores, they also calculated partial correlations
between each Big Five trait and accuracy, confidence and overconfidence scores, and partialled out the variance attributable to the other four personality dimensions. This change of analyses provided the clearest conclusions according to these researchers, and some of the significant simple correlations reported in their study failed to reach
significance when partial correlations were used.
Schaefer et al. (2004) found that Intellect/Openness significantly predicted accuracy and confidence scores, but not overconfidence on the General Knowledge task used in their study, indicating that those with higher scores on this dimension were also more confident and accurate in their performance. Extraversion predicted
mis-calibrated