R E S E A R C H A R T I C L E
Open Access
Modulation of hepatic PPAR expression during
Ft
LVS LPS-induced protection from
Francisella
tularensis
LVS infection
Saroj K Mohapatra
1*, Leah E Cole
2, Clive Evans
1, Bruno W Sobral
1, Josep Bassaganya-Riera
1, Raquel Hontecillas
1,
Stefanie N Vogel
2, Oswald R Crasta
1*Abstract
Background:It has been shown previously that administration ofFrancisella tularensis(Ft) Live Vaccine Strain (LVS) lipopolysaccharide (LPS) protects mice against subsequent challenge withFtLVS and blunts the pro-inflammatory cytokine response.
Methods:To further investigate the molecular mechanisms that underlieFtLVS LPS-mediated protection, we profiled global hepatic gene expression followingFtLVS LPS or saline pre-treatment and subsequentFtLVS challenge using Affymetrix arrays.
Results:A large number of genes (> 3,000) were differentially expressed at 48 hours post-infection. The degree of modulation of inflammatory genes by infection was clearly attenuated by pre-treatment withFtLVS LPS in the surviving mice. However,FtLVS LPS alone had a subtle effect on the gene expression profile of the uninfected mice. By employing gene set enrichment analysis, we discovered significant up-regulation of the fatty acid metabolism pathway, which is regulated by peroxisome proliferator activated receptors (PPARs).
Conclusions:We hypothesize that the LPS-induced blunting of pro-inflammatory response in mouse is, in part, mediated by PPARs (aandg).
Background
Tularemia is caused by the Gram-negative, non-motile, intracellular coccobacillus,Francisella tularensis (Ft), so named after Tulare county of California where the dis-ease was initially identified [1]. Rodents, along with rab-bits and hares, are the chief hosts of the bacterium. It is transmitted to humans mostly by insect bites, handling of animal carcasses, and ingestion or inhalation. Symp-toms of tularemia typically appear 3 to 5 days after initial contact with the pathogen and include sudden fever, chills, headaches, diarrhea, muscle aches, joint pain, dry cough and progressive weakness; however, the symptoms and the severity of illness, are highly depen-dent upon the dose and route of inoculation [2]. The number of cases of tularemia has steadily declined in the United States since 1950; between 1990 and 2000,
only 1,368 cases of tularemia were reported to the Cen-ters for Disease Control and Prevention (CDC) with an annual average of approximately 120 cases until 2003 [3]. The CDC has classified Ft as a Category A agent due to its low infectious dose, easy dissemination by the aerosol route, and potential to cause severe morbidity and mortality.Fthas been used previously as a biologi-cal weapon [4]. Furthermore, during the cold war, both the United States and the former Soviet Union stock-piledFtfor use as a potential biological weapon [2,5].
An attenuated“Live Vaccine Strain”(LVS), developed in the former Soviet Union by repeated passage of Ft subspecies holarcticaon agar plates and subsequently through mice [6], has been used to vaccinate humans. While vaccination withFt LVS provides significant pro-tection against more highly virulent strains [7-9], the strain has not been licensed for general public use in the United States due to the fact that the molecular basis for the attenuation is presently unknown [10].
* Correspondence: saroj@vt.edu; ocrasta@vt.edu
1Virginia Bioinformatics Institute, Virginia Polytechnic Institute and State
University, Blacksburg, VA 24061, USA
Nonetheless,FtLVS is virulent in mice by many routes and causes an infection that resembles human tularemia [11].
Infection of mice withFtresults in a marked inflam-matory response that has been suggested to be responsi-ble for most of the tissue damage associated with human tularemia [11,12]. Mice challenged i.p. with Ft LVS display the highest bacterial burden in the liver when compared to spleen and lung [13]. Interaction of Ft with cells of the innate immune system (macro-phages, dendritic cells, neutrophils, NK cells) initiates a cascade of cytokine production including IFN-g, TNF-a leading to production of reactive nitrogen and oxygen species [14]. In the liver, increased bacterial burden is accompanied by increased hepatic mRNA synthesis of the pro-inflammatory genes TNF-a, IFN-g, KC, MCP-1, and iNOS. A later wave of gene expression is associated with the development of“alternatively activated” macro-phages that facilitates increased intracellular replication ofFtand, ultimately, death [15].
LPS, an integral structural component of the outer membrane of all Gram-negative bacteria, is often a pri-mary mediator of host inflammatory sequelae induced by Gram-negative bacterial infection. Unlike enterobac-terial LPS, previous studies have shown that FtLVS LPS is weakly endotoxic and a poor Toll-like receptor (TLR) 4 agonist [16]. Despite its lack of endotoxic properties, mice pre-treated with Ft LVS LPS two days prior to lethal Ft LVS challenge are protected and display decreased bacterial burden as well as a reduced inflam-matory response [13]. This previous work assessed changes in gene expression using real-time PCR and, therefore, a relatively small subset of inflammatory genes was analyzed. To gain insights into the mechan-ism(s) of Ft LPS-mediated protection of mice from death caused by FtLVS, we profiled hepatic transcrip-tome (using Affymetrix expression arrays) ofFt-infected mice with or without LPS-pre-treatment.
Methods
Sample preparation
Female C57BL/6J mice were obtained from Jackson Labs in Bar Harbor, ME. 48 hours prior to FtLVS challenge, mice were injected i.p. with either 100 ng ofFtLVS LPS or an equivalent volume of saline. On the day of chal-lenge, 3 saline- and 3 FtLVS LPS-pre-treated animals were sacrificed (uninfected controls), while all remaining mice were challenged i.p. with ~4-5 × 10⁵ Ft LVS. Ft LVS-challenged mice were sacrificed (in groups of 3) at 24 and 48 hours post-infection. This entire experiment was performed 3 times. Within each individual experi-ment, equal amounts of extracted RNA from biological replicate samples were pooled. Pooled RNA from sepa-rate experiments was used as biological replicates. All
experimental procedures were approved by the Institu-tional Animal Care and Use Committee and met or exceeded requirements of the Public Health Service/ National Institutes of Health and the Animal Welfare Act.
RNA extraction
Whole liver was collected from mice and preserved in RNAlater® (Applied Biosystems/Ambion Foster City, CA). After homogenization, total RNA was extracted and purified using the RNAeasy system according to manufacturer’s instructions (Qiagen Valencia, CA). The QIAGEN RNase-free DNase supplement kit was used to ensure that the RNA was free from DNA contamination. All RNA samples were checked for both quality and quantity as described previously [17,18].
Real Time PCR
Real-time PCR was performed in a Sequence Detector System (ABI Prism 7900 Sequence Detection System and software; Applied Biosystems, Foster City, CA) as described previously [19]. Levels of mRNA for specific murine genes were reported as relative gene expression over background levels detected in control samples. Pri-mers were designed using the Primer Express™Program (Applied Biosystems, Foster City, CA) in conjunction with GenBank with the following sequences.
B-cell leukemia/lymphoma 6 forward: GTCAGAGT ATTCGGATTCTAGCTGTG
B-cell leukemia/lymphoma 6 reverse: GCAGCGT GTGCCTCTTGAG
Traf 2 binding protein (TIFA) forward: GGCCACTG GAAGACTCTCAGG
Traf 2 binding protein (TIFA) reverse: GGATGGTAA ATGGTCATCTGGAG
cytochrome P450, family 2, subfamily b, polypeptide 10 (Cyp2b10) forward: CAGACACCATAAGGGAG GCTCT
cytochrome P450, family 2, subfamily b, polypeptide 10 (Cyp2b10) reverse: GATCACACCATATTCCTTG AAGGTT
Heat shock protein 1B (Hspa1b) forward: GCACG GCGTGTGAGAGG
Heat shock protein 1B (Hspa1b) reverse: TGATG GATGTGTAGAAGTCGATGC.
GeneChip hybridization
RNA was processed and labelled according to the stan-dard target labelling protocols and the samples were hybridized, stained, and scanned per standard Affyme-trix protocols at VBI core laboratory on Mouse 430 2.0 expression arrays (Affymetrix Inc., Santa Clara, CA). This platform consists of 45,101 probe sets representing 21,309 genes of the mouse genome.
Microarray data analysis
environment - Version 2.8.1 [21]. Raw microarray data obtained from CEL files were pre-processed by the gcRMA algorithm (GC Robust Multiarray Average) [22] that performs the three steps: (i) adjustment of the gene expression signal against the background caused by opti-cal noise and non-specific binding, (ii) robust multi-array normalization [23], and (iii) summarization of the probes belonging to each probe set.
The probe sets were further selected in an unbiased manner by removing those associated with a very low degree of variability (inter-quartile range less than 0.5) across all the samples. This reduced the number of probe sets from 45,101 to 19,535. Statistical analysis was performed using the software package “limma” [24] by applying a linear model to the expression mea-surement (log intensities) for each gene. For each com-parison of interest, the genes were assigned p-values after controlling for false discovery rate [25]. For assessment of differential expression, the empirical Bayes method was applied [26]. A cut-off of p < 0.05 and > = 2-fold change was used as the criterion for whether or not a gene was significantly modulated by a treatment. All the significantly modulated genes in any of the pair wise comparison of interest are listed in Additional file 1. The microarray data (both raw and normalized) have been submitted at the Gene Expression Omnibus (GEO, http://www.ncbi.nlm.nih. gov/geo/, Data set: GSE16207).
Gene set enrichment analysis (GSEA)
All pathways listed at KEGG [27-29] were selected for analysis. The degree of differential regulation of a path-way was derived from the collective differential regula-tion of the member genes in that pathway, as described below. Each pathway was assigned a score (ZK) by
com-bining individual t-statistic of the genes in that pathway, using the following formula [30]:
Pathway score Sum of individual gene-level statistics N
t
u
umber of genes in the pathway
where the t-statistic is a measure of the individual differential expression for each gene in the pathway. While each individual t-statistic represents the gene-level difference between two groups (treated versus control), the pathway score represents the pathway-level difference between the two groups. Calculation of the pathway score was performed using the bioconduc-tor package GSEABase [31]. GSEA has earlier been shown to detect differential regulation of pathways when gene-level changes are very small or undetectable [32,33] and hence was considered appropriate for the present context. The pathway observed to be most sig-nificantly modulated was confirmed by permutation testing with the gseattperm function in the package
Category [34]. The pathway scores are listed in Addi-tional file 2.
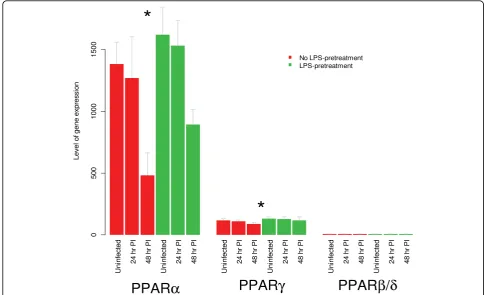
Comparison of differential gene expression due to LPS treatment
In view of the regulatory role of peroxisome prolifera-tor-activated receptors (PPARs) in fatty acid metabolism, the gene expression of three PPAR isoforms (PPARa, PPARg, PPARb/δ) were subjected to further analysis. Our goal was to detect if post-infection gene expression of PPAR was consistently elevated by LPS pre-treatment. Hence a t-test (paired by time-point) between two con-ditions (LPS and No LPS) was performed for each iso-form, as described below. For each time point (uninfected, 24 hr PI and 48 hr PI), differences between the two treatments were calculated as d0, d1 and d2
respectively, using the formulas below.
d LPS NoLPS
d LPS NoLPS
d
Uninfcted Uninfected hrPI hrPI
0
1 24 24
2
LLPS48hrPINoLPS48hrPI
Each of the values d0, d1, and d2 refers to the differ-ence of the average gene expression of 3 samples. The average and variation of these numbers were compared against a normal distribution and tested if the mean was significantly different from zero. For PPARaandg(but notb/δ), the effect was found to be statistically signifi-cant (p < 0.05).
Comparison of differential gene expressions due to LPS treatment and infection on fatty acid metabolism
A similar method as described above was applied to assess the effect of infection and LPS treatment on fatty acid metabolism. In this case, our intention was to com-pare the average direction of change in the expression of a total of 24 genes involved in fatty acid metabolism after challenging the mice with LPS alone (48 hours) or infection alone (24 hours). The time point of 24 hours post-infection was chosen to detect the early changes post-infection. For each gene, differences of gene expression due to LPS (Dp) and due to infection (Di) were calculated as follows:
Dp LPS NoLPS
Di NoLPS NoLPS
Uninfcted Uninfected hrPI Uninfec
24 tted
Results
Alteration in gene expression after infection
We discovered 3,515 genes to be differentially expressed after 48 hours of infection. These include Bcl proteins 3, 6, and 10; heat shock proteins 1, 1A, 1B, and 90; genes induced by interferons; interleukin 1b; and LPS binding protein and tumor necrosis factor. For easier data visua-lization, a shorter list of 79 of these genes (with >40-fold change) is presented in the heat map in Additional file 3 A. Genes with modified expression fell into two categories based on whether they were up or down-regulated by infection. The up-down-regulated genes include interferong(IFN-g) as well as chemokine (C-X-C motif) ligands IP-10 (Cxcl10), KC (Cxcl1), and MCP-1 (Ccl2). This is consistent with our previously published results on up-regulation of pro-inflammatory cytokines by mouse liver uponFtLVS infection [13]. The genes that were down-regulated at 48 hours post-infection include carbonic anhydrase 3 and guanidinoacetate methyltrans-ferase, both of which are known to be down-regulated in response to liver injury [35,36].
The time course for gene expression for up- and down-regulated genes was examined separately. Box plots were drawn for each group of genes across the three time points: uninfected, 24 hours, and 48 hours post-infection (Additional file 3B, C). For each post-infection time point, saline- and LPS-pre-treated mice were juxtaposed. Two trends are visible in these box plots. First, with time, infec-tion progressively alters the level of gene expression (red-colored boxes). This is true for both up- and down-regu-lated genes. Secondly, LPS-pre-treatment (green boxes) opposes the transcriptional changes caused byFtLVS infection at both 24 hours and 48 hours post-infection, thus keeping the gene expression level less deviated from uninfected state. Effect of LPS-pre-treatment was found to be statistically significant (p < 0.01) for both up- and down-regulated genes.
We discovered a total of 34 genes to be differentially expressed compared to uninfected control. These included chemokine ligand IP-10 and genes controlled by pro-inflammatory cytokines TNF-a, IL-1b, IFN-g; namely, interferon regulatory factor 1, Cd274 antigen, metallothionein 2, proteasome subunit (Psmb9), and tumor necrosis factor Tnfsf10 were progressively up-regulated after infection. Similar to the trend seen for the other group, up-regulation of these genes at 24 hours post-infection was lessened by LPS-pre-treatment.
In addition to the effects on the specific genes, LPS-pre-treatment had a substantial influence on the number of genes differentially expressed due to infection. A total of 3,515 genes were found to be differentially expressed in mice without LPS-pre-treatment, but only 1,494 genes with LPS-pre-treatment after 48 hours
post-infection as compared to the uninfected controls (0 hr post-infection). For more than 99% of the latter list of genes (1,483 out of 1,494) the N-fold was in the same direction as that in mice without LPS-pre-treatment. Furthermore, for 1,100 of these 1,483 genes, the magni-tude of change was smaller in the LPS pre-treated mice, suggesting LPS had a general blunting effect on infec-tion-induced gene expression profile.
Validation of select genes
Validation of the data from a selected number of genes was carried out by quantitative real-time RT-PCR (qRTPCR). Relative gene expression of four genes (Bcl6, Traf2 binding protein, heat shock protein 1B, and Cyto-chrome P450) was measured by qRTPCR. These genes were found to have similar trends as seen on the micro-arrays (Fig. 1). Another set of genes (TNF-a, IL-1b, IL-6, IFN-g, IP-10, KC, MCP-1, RANTES) reported earlier to be up-regulated [13] were also examined. Both micro-array and qRTPCR measurements for these genes were consistent with respect to the direction of change at a statistically significant level (Fig. 2).
LPS-induced changes in pathways
While LPS-pre-treatment blunted up-regulation of genes at 24 and 48 hours post-infection, no significant changes in gene expression could be demonstrated in the livers of mice that received LPS and were sacrificed prior to Ft challenge (i.e., 48 hours after LPS injection). This finding suggests that the earliest transcriptional changes were subtle or that the initial modulation of the host response toFtoccurred in an extra-hepatic location. In order to enhance the discriminatory power of the small changes at the level of individual gene expression, we employed a GSEA analytic strategy that relies on coordi-nated expression of functionally related genes. We first compared saline- and LPS-treated mice at time point zero, which is equivalent to measuring the effect on glo-bal gene expression profile after 48 hours of LPS treat-ment. Pathway scores were calculated between the two conditions. The most up-regulated pathway“Fatty acid metabolism”(KEGG ID: 00071) was found to be statisti-cally significant from permutation testing (Fig. 3). Many of the genes in this pathway are transcriptionally regu-lated by PPARs.
PPARs belong to the superfamily of nuclear hormone receptors with three known isoforms,a,b or δ, andg, that differ in their tissue distribution and functional activity [37]. While PPARb/δ is ubiquitous, PPARg is expressed in adipocytes, T- and B-cells, monocytes/ macrophages, dendritic cells, and epithelial cells [38,39].
PPARg(Fig. 4). PPARaforms a heterodimer with reti-noid X receptor (RXRa) that binds to DNA on PPAR response elements and controls the expression of a number of genes participating in metabolism. The gene-products regulated by PPARa participate in a number of metabolic processes including cellular fatty acid uptake, intracellular fatty acid transport, ketogenesis, lipoprotein metabolism, microsomal fatty acidω -oxida-tion, mitochondrial fatty acid b-oxidation, mitochondrial fatty acid uptake, peroxisomal fatty acid b-oxidation, and peroxisomal fatty acid uptake [41]. As shown in the
[image:5.595.59.540.89.287.2]right column of Fig. 5, PPARa,g, and most of the genes participating in fatty acid metabolism are expressed at a higher level (red) after LPS treatment (fold change > 1) as compared to the uninfected and untreated (No LPS) control. On the contrary, most of the same genes expressed at a lower level (green) after infection (fold change < 1) as compared to the uninfected and untreated (No LPS) control. The averages of these fold changes across all the genes in the fatty acid metabolism was significantly (p < 0.01) higher due to LPS treatment and lower due to infection.
[image:5.595.57.286.515.614.2]Figure 1Real-time PCR of 4 genes. Measurement of relative gene expression in infected mice (with respect to uninfected mice without LPS-pre-treatment) of four different genes by two different methods. The top row corresponds to microarray while the bottom row corresponds to quantitative real-time PCR. In each plot, the red line corresponds to the group of mice with LPS-pre-treatment, the black line, without LPS. Horizontal axis corresponds to the days after infection, vertical axis to relative gene expression. Gene expression trends are similar between the two methods of measurement.
Figure 2 Agreement with previously published result. Agreement of microarray data with gene expression changes measured by quantitative real-time PCR (qRTPCR) [13]. In both studies the mice were pre-treated with either 100 ng ofFtLVS LPS or equivalent volume of saline (Untreated) 48 hours before infection and sacrificed at 48 hours post-infection. Each number represents the fold-increase in the mRNA levels after infection. While there was rise in the pro-inflammatory cytokine levels post-infection, LPS caused a reduction in expression of these genes (comparable between qRTPCR and microarray; Spearman correlation at p < 0.001).
[image:5.595.303.540.523.673.2]Discussion
Ft LVS infection of mice is associated with profound changes in the levels of pro-inflammatory cytokines whose expression is decreased by pre-treatment with 100 ng ofFt LVS LPS. After 48 hours post-infection, LPS-treated mice exhibit significantly reduced hepatic gene expression [13] (Fig. 2), circulating cytokine levels [13] and increased survival [13]. We previously postu-lated that pre-treating the mice with LPS accomplishes the following results: (i) dampened bacterial growth, (ii) suppressed pro-inflammatory response, and (iii) induc-tion of a late Ag-specific protective adaptive immune response [13]. It was recently shown that the latter is due to the induction ofFt LVS LPS-specific antibodies by a subset of B1a cells [42]. Upon global profiling of hepatic gene expression, we discovered a number of genes that were differentially expressed, especially at 48 hours post-infection, a time at which many of these changes were counteracted by prior LPS treatment. The effect of LPS treatment was less evident at 24 hours post-infection or at day 0 (without infection). Since it is clear that LPS protects the mice from death byFtLVS,
we made the reasonable assumption that the protective molecular changes were already in motion 48 hours after LPS treatment (day 0) and we sought to discover the gene expression signature of those LPS-induced changes. Using “Gene set enrichment analysis” that explores coordinated changes in functionally related genes, we discovered that the KEGG pathway “Fatty acid metabolism” was up-regulated at 48 hours post-infection. Further investigation pointed to simultaneous up-regulation of PPARa and g by LPS-pre-treatment (Fig. 5).
Many of the genes in the “Fatty acid metabolism” pathway are transcriptionally controlled by peroxisome proliferator-activated receptors (PPARs). PPARs (a,b/δ and g) are master regulators of energy homeostasis. They are nuclear receptors that upon activation by spe-cific ligands bind to spespe-cific response elements near the promoter of their target genes. In this way, PPARs sense the lipid concentration and composition in the cellular environment [43,44]. In fact, PPARs are the receptors for endogenous lipid molecules such as prostaglandins or hydroxy-containing PUFA such as
[image:6.595.54.539.89.384.2]hydroxyeicosatetraenoic (HETE), 13-hydroxyoctadeca-dienoic (HODE), and dietary compounds such as conju-gated linoleic acid. PPARa and g were originally identified as the molecular target for the fibrate class of lipid-lowering drugs or the thiazolidinedione (TZD) class of antidiabetic drugs, respectively. Our results show that the down-regulation of the proinflammatory cytokine and chemokine response induced by LPS pre-treatment is paralleled by increased expression of PPARa andg. In the liver, PPARa is mainly expressed by hepatocytes, where it regulates oxidation of free fatty acids. Its ligands include unsaturated fatty acids and eicosanoids derived from arachidonic and linoleic acids.
We show that LPS-pre-treatment resulted in up-regula-tion of the enzymes involved in fatty acid oxidaup-regula-tion (Fig. 5), which suggests a higher degree of PPARaactivation by endogenous ligands.
[image:7.595.55.539.86.437.2]Both PPARaand g are expressed in Kupffer cells, a specialized subset of macrophages that reside in the hepatic sinusoids [45]. Other immune cells present in the liver such as dendritic cells or T cells also express PPARg[46]. In addition to its role in lipid metabolism, PPARa andghave long been recognized for their influ-ence on inflammatory pathways [47] mostly by repres-sion of pro-inflammatory gene expresrepres-sion. More recently, it has been shown that liver PPARa controls
acute phase response (APR) via a liver-specific attenua-tion of pro-inflammatory cytokine gene expression [48]. In this model, PPARamodulates both TNF-a/IL-1 and IL-6 signaling through a direct action on the pathway or via the down-regulation of IL-1-mediated stimulation of IL-6 expression. This model is consistent with our find-ing of up-regulated PPARa-responsive genes and reduced levels of pro-inflammatory cytokine gene expression and protein levels. Interestingly, while puri-fiedFtLPS causes an up-regulation of PPARs and their responsive genes, infection with the whole bacterium causes down-regulation of the same genes (Fig. 5). These findings are in line with a recent report demon-strating that E. coliLPS up-regulated PPARgexpression in the immune system of pigs by inducing the genera-tion of endogenous PPARgagonists such as 15d PGJ (2) [49]. Thus, while enterobacterial and Ft LPS differ in molecular targets (i.e., TLR4 versus TLR2, respectively) and their ability to induce inflammatory cytokines, both types of LPS may induce the generation of endogenous PPAR agonists as a mechanism of down-regulating inflammation.
PPARghas been recently shown to be a key molecular switch in the induction of alternatively activated macro-phages [50]. Moreover, it has been shown that infection of macrophages withFtLVS induced alternative activation with up-regulation of the signature genes arginase I, FIZZI, and macrophage mannose receptor [15]. Interest-ingly, the cytokines IL-4 and IL-13 drive differentiation into alternatively activated macrophages through IL-4Ra and STAT6 signaling, [51] and in addition, IL-4 treatment of macrophages up-regulates PPARgand PPARg respon-sive genes [52]. While alternatively activated macrophages display an anti-inflammatory phenotype, which might dampenFtLVS-induced inflammation, they are unable to kill intracellular pathogens. In this regard,FtLVS induced alternatively activated macrophages through production of IL-4 and IL-13, which resulted in enhanced intracellular bacterial survival and replication. On the other hand, the inability of macrophages to become alternatively activated in IL-4Raor STAT6-deficient mice leads to a more pro-longed IL-12 response when compared to WT littermates [15]. Thus, the role of PPARgin the immunopathogenesis of tularemia should be interpreted with caution as it might have both beneficial and detrimental effects in the out-come of the disease. The induction of the PPAR-con-trolled pathway in our data is consistent with transcriptional profiling results ofF. tularensisinfection of human peripheral blood mononuclear cells (PBMC) [53].
Conclusions
In summary, we have examined the gene expression of the mouse liver before and after infection withFtLVS, with or without LPS-pre-treatment, and demonstrated
that, in accordance with previous results from our laboratory, LPS causes significant attenuation of gene-expression changes after infection with Ft LVS. Addi-tionally, we demonstrate for the first time that FtLPS causes subtle changes in hepatic gene expression after 48 hours of treatment in uninfected mice. By using gene set enrichment analysis (GSEA) we showed that many genes involved in fatty acid metabolism are up-regulated in a coordinated manner along with up-regulation of the nuclear factor PPARa (and to a lesser extent PPARg). We suggest that LPS-induced attenuation of pro-inflam-matory response toFt LVS is partly mediated through hepatic PPARaandg, possibly through the induction of alternatively activated macrophages. These findings are in line with numerous reports on the anti-inflammatory efficacy of PPARs. Future studies aimed at examining the effect of Ft LVS or type A strains on the hepatic and pulmonary pathology following cell-specific deletion of PPARaorgfrom immune cells are needed to further dissect the role of PPARs in the pathogenesis and pre-vention of tularemia.
Additional file 1: Genes showing significant modulation after 48 hours of infection. All the significantly modulated genes in any of the pair wise comparison of interest (contrasts) are listed. There are seven contrasts: LPS_d0_Vs_Sal_d0, LPS_d1_Vs_Sal_d1 LPS_d2_Vs_Sal_d2 Sal_d1_Vs_Sal_d0, Sal_d2_Vs_Sal_d0, LPS_d1_Vs_LPS_d0
LPS_d2_Vs_LPS_d0. For each, fold change and p-values are provided. Additionally, selection columns include 1 for significant differential expression and 0 for no significant differential expression. Click here for file
[ http://www.biomedcentral.com/content/supplementary/1471-2334-10-10-S1.XLS ]
Additional file 2: Pathway score for the KEGG pathways. Pathway score was calculated from the gene-level fold-change in expression induced after 48 hours of LPS treatment. Fatty acid metabolism appears at the top of the list.
Click here for file
[ http://www.biomedcentral.com/content/supplementary/1471-2334-10-10-S2.XLS ]
Additional file 3: LPS lessens the impact ofFtLVS infection on mouse liver. Gene expression changes induced byFtLVS infection and protection by LPS pre-treatment. (A) Heat map showing gene expression before (Uninfected) and after infection (48 hours PI). Higher degree of gene expression is displayed as a darker cell. This is a set of selected genes showing maximal difference (absolute fold change of 40 or higher) between the two groups of mice. The genes are either up- or down-regulated by infection. Some of the genes associated with inflammation or liver injury have been outlined: up-regulated in red rectangle; down-regulated in green rectangle. The highlighted genes have already been reported to be altered in response toFtinfection or liver injury. (B) Distribution of expression signal of genes up-regulated by infection. Each box plot corresponds to distribution of the up-regulated genes before or after infection (24 hours, 48 hours PI). The red color corresponds to mice without LPS pre-treatment. The green color corresponds to mice with LPS pre-treatment. (C) Same as B, but for down-regulated genes. In both B and C, infection causes progressive alteration of transcription for these genes and LPS pre-treatment opposes this trend.
Click here for file
Acknowledgements
The authors thank Lisa Gunderman for help in proof reading and formatting the manuscript. This project was funded through National Institutes of Health Cooperative Agreement number 1 U54 Al057168-01 to S. Vogel and O. Crasta through subcontract from the University of Maryland, Baltimore, M. Levine, PI and through Collaborative Research Team funding from the Virginia Bioinformatics Institute to O. Crasta.
Author details 1
Virginia Bioinformatics Institute, Virginia Polytechnic Institute and State University, Blacksburg, VA 24061, USA.2Department of Microbiology and
Immunology, University of Maryland School of Medicine, Baltimore, MD 21201, USA.
Authors’contributions
SV, LC, OC designed the experiments; LC, SV did the mouse experiments; CE did the microarray processing of samples; SM, OC performed statistical analysis of microarray data; SM, LC, JB, RH, SV, OC interpreted the results; SM, LC, JB, RH, SV, OC wrote the paper; BS provided helpful comments. All authors reviewed and approved of the manuscript.
Competing interests
The authors declare that they have no competing interests.
Received: 10 April 2009
Accepted: 18 January 2010 Published: 18 January 2010
References
1. Sjostedt A:Tularemia: history, epidemiology, pathogen physiology, and clinical manifestations.Ann N Y Acad Sci2007,1105:1-29.
2. Dennis DT, Inglesby TV, Henderson DA, Bartlett JG, Ascher MS, Eitzen E, Fine AD, Friedlander AM, Hauer J, Layton M,et al:Tularemia as a biological weapon: medical and public health management.JAMA2001,
285(21):2763-2773.
3. Summary of Notifiable Diseases—United States. 2003http://www.cdc. gov/mmwr/preview/mmwrhtml/mm5254a1.htm.
4. Harris S:Japanese biological warfare research on humans: a case study of microbiology and ethics.Ann N Y Acad Sci1992,666:21-52. 5. Vogel G:Infectious diseases. An obscure weapon of the cold war edges
into the limelight.Science2003,302(5643):222-223.
6. Eigelsbach HT, Downs CM:Prophylactic effectiveness of live and killed tularemia vaccines. I. Production of vaccine and evaluation in the white mouse and guinea pig.J Immunol1961,87:415-425.
7. Saslaw S, Eigelsbach HT, Prior JA, Wilson HE, Carhart S:Tularemia vaccine study. II. Respiratory challenge.Arch Intern Med1961,107:702-714. 8. Hornick R:Tularemia revisited.N Engl J Med2001,345(22):1637-1639. 9. Saslaw S, Eigelsbach HT, Wilson HE, Prior JA, Carhart S:Tularemia vaccine
study. I. Intracutaneous challenge.Arch Intern Med1961,107:689-701. 10. Titball RW, Petrosino JF:Francisella tularensis genomics and proteomics.
Ann N Y Acad Sci2007,1105:98-121.
11. Elkins KL, Cowley SC, Bosio CM:Innate and adaptive immune responses to an intracellular bacterium, Francisella tularensis live vaccine strain.
Microbes Infect2003,5(2):135-142.
12. Ellis J, Oyston PC, Green M, Titball RW:Tularemia.Clin Microbiol Rev2002,
15(4):631-646.
13. Cole LE, Elkins KL, Michalek SM, Qureshi N, Eaton LJ, Rallabhandi P, Cuesta N, Vogel SN:Immunologic consequences of Francisella tularensis live vaccine strain infection: role of the innate immune response in infection and immunity.J Immunol2006,176(11):6888-6899. 14. Elkins KL, Cowley SC, Bosio CM:Innate and adaptive immunity to
Francisella.Ann N Y Acad Sci2007,1105:284-324.
15. Shirey KA, Cole LE, Keegan AD, Vogel SN:Francisella tularensis live vaccine strain induces macrophage alternative activation as a survival
mechanism.Journal of Immunology2008,181(6):4159-4167. 16. Gunn JS, Ernst RK:The structure and function of Francisella
lipopolysaccharide.Ann N Y Acad Sci2007,1105:202-218.
17. Djavani MM, Crasta OR, Zapata JC, Fei Z, Folkerts O, Sobral B, Swindells M, Bryant J, Davis H, Pauza CD,et al:Early blood profiles of virus infection in a monkey model for Lassa fever.J Virol2007,81(15):7960-7973. 18. Li XL, Ezelle HJ, Kang TJ, Zhang L, Shirey KA, Harro J, Hasday JD,
Mohapatra SK, Crasta OR, Vogel SN,et al:An essential role for the antiviral
endoribonuclease, RNase-L, in antibacterial immunity.Proc Natl Acad Sci USA2008,105(52):20816-20821.
19. Cuesta N, Salkowski CA, Thomas KE, Vogel SN:Regulation of
lipopolysaccharide sensitivity by IFN regulatory factor-2.J Immunol2003,
170(11):5739-5747.
20. Gautier L, Cope L, Bolstad BM, Irizarry RA:affy–analysis of Affymetrix GeneChip data at the probe level.Bioinformatics2004,20(3):307-315. 21. R_Development_Core_Team:R: A Language and Environment for
Statistical Computing.2008.
22. Wu ZJ, Irizarry RA, Gentleman R, Martinez-Murillo F, Spencer F:A model-based background adjustment for oligonucleotide expression arrays.
Journal of the American Statistical Association2004,99(468):909-917. 23. Irizarry RA, Hobbs B, Collin F, Beazer-Barclay YD, Antonellis KJ, Scherf U,
Speed TP:Exploration, normalization, and summaries of high density oligonucleotide array probe level data.Biostatistics2003,4(2):249-264. 24. Smyth GK:Limma: linear models for microarray data.Bioinformatics and
Computational Biology Solutions using R and BioconductorNew York: SpringerR Gentleman VC, Dudoit S, Irizarry R, Huber W 2005, 397-420. 25. Benjamini Y, Hochberg Y:Controlling the False Discovery Rate - a
Practical and Powerful Approach to Multiple Testing.Journal of the Royal Statistical Society Series B-Methodological1995,57(1):289-300.
26. Smyth GK:Linear models and empirical bayes methods for assessing differential expression in microarray experiments.Stat Appl Genet Mol Biol
2004,3:Article3.
27. Kanehisa M, Araki M, Goto S, Hattori M, Hirakawa M, Itoh M, Katayama T, Kawashima S, Okuda S, Tokimatsu T,et al:KEGG for linking genomes to life and the environment.Nucleic Acids Res2008, ,36 Database:D480-484. 28. Kanehisa M, Goto S:KEGG: kyoto encyclopedia of genes and genomes.
Nucleic Acids Res2000,28(1):27-30.
29. Kanehisa M, Goto S, Hattori M, Aoki-Kinoshita KF, Itoh M, Kawashima S, Katayama T, Araki M, Hirakawa M:From genomics to chemical genomics: new developments in KEGG.Nucleic Acids Res2006, ,34 Database:
D354-357.
30. Gentleman R, Morgan M, Huber W:Gene set enrichment analysis.
Bioconductor Case StudiesNew york: SpringerF Hahne WH, Gentleman R, Falcon S 2008.
31. Morgan M, Falcon S, Gentleman R:GSEABase: Gene set enrichment data structures and methods.R package version 1.2.22008.
32. Mootha VK, Lindgren CM, Eriksson KF, Subramanian A, Sihag S, Lehar J, Puigserver P, Carlsson E, Ridderstrale M, Laurila E,et al: PGC-1alpha-responsive genes involved in oxidative phosphorylation are coordinately downregulated in human diabetes.Nat Genet2003,34(3):267-273. 33. Subramanian A, Tamayo P, Mootha VK, Mukherjee S, Ebert BL, Gillette MA,
Paulovich A, Pomeroy SL, Golub TR, Lander ES,et al:Gene set enrichment analysis: a knowledge-based approach for interpreting genome-wide expression profiles.Proc Natl Acad Sci USA2005,102(43):15545-15550. 34. Gentleman R, Falcon S, Sarkar D:Category: Category Analysis.R package
version 2.8.3 edn2008.
35. Henkel C, Roderfeld M, Weiskirchen R, Berres ML, Hillebrandt S, Lammert F, Meyer HE, Stuhlet K, Graf J, Roeb E:Changes of the hepatic proteome in murine models for toxically induced fibrogenesis and sclerosing cholangitis.Proteomics2006,6(24):6538-6548.
36. Schnackenberg LK, Chen M, Sun J, Holland RD, Dragan Y, Tong W, Welsh W, Beger RD:Evaluations of the trans-sulfuration pathway in multiple liver toxicity studies.Toxicol Appl Pharmacol2009,235(1):25-32. 37. Mangelsdorf DJ, Thummel C, Beato M, Herrlich P, Schutz G, Umesono K,
Blumberg B, Kastner P, Mark M, Chambon P,et al:The nuclear receptor superfamily: the second decade.Cell1995,83(6):835-839.
38. Spiegelman BM:PPARgamma in monocytes: less pain, any gain?.Cell
1998,93(2):153-155.
39. Mansen A, Guardiola-Diaz H, Rafter J, Branting C, Gustafsson JA:Expression of the peroxisome proliferator-activated receptor (PPAR) in the mouse colonic mucosa.Biochem Biophys Res Commun1996,222(3):844-851. 40. Peters JM, Rusyn I, Rose ML, Gonzalez FJ, Thurman RG:Peroxisome
proliferator-activated receptor alpha is restricted to hepatic parenchymal cells, not Kupffer cells: implications for the mechanism of action of peroxisome proliferators in hepatocarcinogenesis.Carcinogenesis2000,
21(4):823-826.
42. Cole LE, Yang Y, Elkins KL, Fernandez ET, Qureshi N, Shlomchik MJ, Herzenberg LA, Vogel SN:Antigen-specific B-1a antibodies induced by Francisella tularensis LPS provide long-term protection against F. tularensis LVS challenge.Proc Natl Acad Sci USA2009,106(11):4343-4348. 43. Evans RM, Barish GD, Wang YX:PPARs and the complex journey to
obesity.Nat Med2004,10(4):355-361.
44. Grimaldi PA:Peroxisome proliferator-activated receptors as sensors of fatty acids and derivatives.Cell Mol Life Sci2007,64(19-20):2459-2464. 45. Crispe IN:The liver as a lymphoid organ.Annu Rev Immunol2009,
27:147-163.
46. Straus DS, Glass CK:Anti-inflammatory actions of PPAR ligands: new insights on cellular and molecular mechanisms.Trends Immunol2007,
28(12):551-558.
47. Devchand PR, Keller H, Peters JM, Vazquez M, Gonzalez FJ, Wahli W:The PPARalpha-leukotriene B4 pathway to inflammation control.Nature1996,
384(6604):39-43.
48. Mansouri RM, Bauge E, Staels B, Gervois P:Systemic and distal
repercussions of liver-specific peroxisome proliferator-activated receptor-alpha control of the acute-phase response.Endocrinology2008,
149(6):3215-3223.
49. Liu Y, Lu J, Shi J, Hou Y, Zhu H, Zhao S, Liu H, Ding B, Yin Y, Yi G:Increased expression of the peroxisome proliferator-activated receptor gamma in the immune system of weaned pigs after Escherichia coli
lipopolysaccharide injection.Vet Immunol Immunopathol2008, 124(1-2):82-92.
50. Odegaard JI, Ricardo-Gonzalez RR, Goforth MH, Morel CR, Subramanian V, Mukundan L, Eagle AR, Vats D, Brombacher F, Ferrante AW,et al:
Macrophage-specific PPARgamma controls alternative activation and improves insulin resistance.Nature2007,447(7148):1116-1120.
51. Martinez FO, Helming L, Gordon S:Alternative Activation of Macrophages: An Immunologic Functional Perspective.Annu Rev Immunol2009,
27:451-83.
52. Huang JT, Welch JS, Ricote M, Binder CJ, Willson TM, Kelly C, Witztum JL, Funk CD, Conrad D, Glass CK:Interleukin-4-dependent production of PPAR-gamma ligands in macrophages by 12/15-lipoxygenase.Nature
1999,400(6742):378-382.
53. Paranavitana C, Pittman PR, Velauthapillai M, Zelazowska E, DaSilva L:
Transcriptional profiling of Francisella tularensis infected peripheral blood mononuclear cells: a predictive tool for tularemia.Fems Immunology and Medical Microbiology2008,54(1):92-103.
Pre-publication history
The pre-publication history for this paper can be accessed here:http://www. biomedcentral.com/1471-2334/10/10/prepub
doi:10.1186/1471-2334-10-10
Cite this article as:Mohapatraet al.:Modulation of hepatic PPAR expression duringFtLVS LPS-induced protection fromFrancisella
tularensisLVS infection.BMC Infectious Diseases201010:10.
Submit your next manuscript to BioMed Central and take full advantage of:
• Convenient online submission
• Thorough peer review
• No space constraints or color figure charges
• Immediate publication on acceptance
• Inclusion in PubMed, CAS, Scopus and Google Scholar
• Research which is freely available for redistribution


![2,8 Bis(3 phenylquinoxalin 2 yl) 5λ6 dibenzo[b,d]thiophene 5,5 dione](data:image/gif;base64,R0lGODlhAQABAIAAAP///wAAACH5BAEAAAAALAAAAAABAAEAAAICRAEAOw==)