1
ADVISORY NOTE
To:
Director of Basic Education Division, Ghana Education
Service
From:
Advisory Unit on Decentralised Education Management,
BED, GES
Document number:
AN002-2011
Date:
28 February 2011
2
1. Advice on the format and working schedule of Annual District/Regional Performance
Report of 2010
After reviewing existing manuals and guidelines, the Advisory Note AN001-2011 dated 28
January 2011 has recommended developing new operational guidelines on the Annual District
Performance Report (ADPR). But it will take time to develop it and give its full orientations to
education staff in districts and regions. Meanwhile, the process of the annual performance
review at districts and regions is expected to be commenced in coming months as the national
performance review is suggested to be done in the second week of May 2011. Although it is
not possible to have full overhaul of the report this year, it must be considered to make some
minimal, easy but critical changes on the reporting format and its process to initiate a good
management cycle in districts and regions. This Advisory Note therefore recommends making
changes on the format of ADPR and its working schedule as below.
2. Suggested contents of ADPR
It is advised to make changes on the format of ADPR as Annex 1. Key points for the changes
are as follows:
1) Review of results of ADEAP
At this moment the management cycle in districts and regions is not well established because
the ADPR is not properly instructed to review results of the Annual District Education
Operation Plan (ADEOP) and Annual District Education Action Plan (ADEAP). Due to this reason,
the reports are just looking over trends of indicators and not critically reflect what have been
done and not done and the reasons for non-actions. It must affect quality of the
ADEOP/ADEAP in the next cycle. It is therefore advised to include the review of results of
ADEAP, which is the action plan that the district offices are responsible to implement in the
year.
2) Introduction/conclusion
Many ADPRs already incorporate its introduction. Conclusion is useful to clearly indicate what
are recommended to the ADEOP/ADEAP in the next cycle. It is therefore advised to put them.
3) Re-organising the list of indicators
Repeating same words in the indicator matrices makes the report redundant. The list is
therefore suggested to be re-organised to reduce repetition of same words as much as
possible.
3
Though availability of classrooms is crucial the current format does not include any
classroom-related indicator. Pupil Classroom Ratio should be therefore included. On the other hand, it
seems it is difficult for many districts to calculate Net Enrolment Rate. It is therefore
recommended to omit it.
5) District levies
Most of ADPRs already reported that district levies are no more imposed. It is therefore
recommended to omit this section.
6) District Education Oversight Committee
In the course of decentralisation roles of the District Education Oversight Committee are
getting more important. But it seems their functions are not very encouraging. In the current
format it is not clearly instructed to report the status of the committee. It is therefore
recommended to include this reporting item in the format.
7) Omitting detailed tables
Almost no ADPR fill in the tables on detailed infrastructure profiles, assessment of furniture
and others. In fact it is not sure whether these detailed information are suitable for the review
of educational performance in the district. It is recommended to omit these detailed tables
form the format.
3. Suggested contents of ARPR
Contents of regional reports seem to vary from region to region. It is therefore advised to send
a unified format for the regional performance report that should be developed on the basis of
the performance reports from their districts. The suggested format is attached as Annex 2.
Since the new ESP has been already finalised, the national performance report will follow the
new structure instead of the previous ACCESS-QUALITY-MANAGEMENT structure. Therefore
the regional reports should also follow the same.
4. Suggested work schedule for the annual performance review process in districts and
regions
Taking into consideration the suggested schedule of the national performance review in the
second week of May 2011, the following work schedule is suggested for preparation of the
district and regional performance reports:
4
30 March 2011:
Deadline for submission of Annual District/Municipality/Metropolitan
Performance Reports to Regional Offices, with sending copies to HQ of GES. Submission should
be by both soft and hard copies.
30 April 2011:
Deadline for submission of Annual Regional Performance Reports to HQ of GES.
Submission should be by both soft and hard copies.
1 Annex 1
Annual District Performance Report (Suggested format)
1. Introduction
1.1. Overview of the district
Describe Socio-economic status of the district in 2010 (size and general population, social background, major economic activities, and the administrative structure related to education)
1.2. Organisation of the report
2. Assessment of key performance indicators 2.1. Kindergarten
Kindergarten: Access 2008/09 2009/10 2010/11 2010/11
Actual Actual Target Actual
Number of pupils in KG1 in total Total
Male
Female
Number of pupils in KG2 in total Total
Male
Female
Number of pupils in public kindergarten Total
Male
Female
Number of pupils in private kindergarten Total
Male
Female
Population aged 4-5 Total
Male
Female
Gross Enrolment Rate (GER) Total
Male
Female
Gender Parity Index (GPI) on GER
Kindergarten: Quality 2008/09 2009/10 2010/11 2010/11
Actual Actual Target Actual
Number of teachers in total
Number of teachers in public KG Total
Trained
Percentage of trained teachers in public KG
Number of teachers in private KG Total
Trained
Comment [DK1]: Introduction is suggested to be put.
2
Percentage of trained teachers in private KG
Pupil Teacher Ratio Public
Private
Kindergarten: Physical Infrastructure 2008/09 2009/10 2010/11 2010/11
Actual Actual Target Actual
Number of kindergartens Total
Public
Private
Number of public KG needing major repair
Number of classrooms in public KG Pupil Classroom Ration in public KG
Write briefly on the Kindergarten performance by answering the following questions on the indicators from 2008/09 - 2010/11.
1) What are the changes in the following? a) Gross Enrolment Rate (GER) b) Female GER
c) Gender Parity Index (GPI) d) Gross Admission Rate (GAR) e) Female GAR
f) Pupil Teacher Ratio (PTR) g) Pupil Textbook Ratio h) Net Enrolment Rate (NER)
2) What are the causes of the changes in each indicator?
3) What would you do to improve the trend in each indicator?
2.2. Primary schools
Primary: Access 2008/09 2009/10 2010/11 2010/11
Actual Actual Target Actual
Number of pupils in all primary schools Total
Male
Female
Number of Primary 1 pupils Total
Male
Female
Number of Primary 6 pupils Total
Male
Female
Comment [DK3]: Classroom related indicators are added.
3
Population aged 6 Total
Male
Female
Population aged 6-11 Total
Male
Female
Gross Enrolment Rate (GER) Total
Male
Female
Gender Parity Index (GPI) on GER
Gross Admission Rate (GAR) Total
Male
Female
Primary: Quality 2008/09 2009/10 2010/11 2010/11
Actual Actual Target Actual
Number of teachers in all schools
Number of teachers in public schools Total
Trained
Percentage of trained teachers in public
schools
Number of teachers in private schools Total
Trained
Percentage of trained teachers in private
schools
Number of newly trained teacher posted in
public schools
Number of new teachers actually at post in
public schools
Pupil Teacher Ratio Public
Private
Highest PTR in public schools
Lowest PTR in public schools
Number of new teachers deployed in public
schools from outside
Number of new teachers deployed in public
schools within the district
Pupil Core Textbook Ratio in public schools
Number of public schools with functioning
School Management Committee (SMC)
Number of public schools with School
Performance Improvement Plans (SPIP)
4
Actual Actual Target Actual
Number of primary schools Total
Public
Private
Number of public schools
with toilet
facilities
with potable
water
Number of classrooms in public schools
Pupil Classroom Ratio in public schools
Number of classrooms needing major repair
Number of new classrooms needed
Write briefly on the primary school performance by answering the following questions on the indicators from 2008/09 - 2010/11.
1) What are the changes in the following? a) Gross Enrolment Rate (GER) b) Female GER
c) Gender Parity Index (GPI) d) Gross Admission Rate (GAR) e) Female GAR
f) Pupil Teacher Ratio (PTR) g) Pupil Textbook Ratio
h) Percentage of trained teachers i) Net Enrolment Rate (NER)
2) What are the causes of the changes in each indicator?
3) What would you do to improve the trend in each indicator?
2.3. Junior Secondary Schools
JSS: Access 2008/09 2009/10 2010/11 2010/11
Actual Actual Target Actual
Number of students in all schools Total
Male
Female
Number of students Public
Private
5
Male
Female
Gross Enrolment Rate (GER) Total
Male
Female
Gender Parity Index (GPI) on GER
Number of JSS 1 students Total
Male
Female
Number of JSS3 students Total
Male
Female
Number of JSS students scholarship
awarded
Number of students in STME clinic Male
Female
Number of days for STME clinic
JSS: Quality 2008/09 2009/10 2010/11 2010/11
Actual Actual Target Actual
Number of teachers in all schools
Number of teacher in public schools Total
Trained
Percentage of trained teacher in public
schools
Number of teacher in private schools Total
Trained
Percentage of trained teacher in private
schools
Number of newly trained teacher posted in
public schools
Number of new teacher actually at post in
public schools
Pupil Teacher Ratio Public
Private
Highest PTR in public schools
Lowest PTR in public schools
Number of new teacher deployed in public
schools from outside
Number of new teacher deployed in public
schools within the district
Pupil Core Textbook Ratio in public schools
Number of public school with functioning
6 Number of public school with School
Performance Improvement Plans (SPIP)
% of students with aggregate 6-30 in BECE Male
Female
JSS: Physical Infrastructure 2008/09 2009/10 2010/11 2010/11
Actual Actual Target Actual
Number of junior secondary schools Total
Public
Private
Number of public JSS
with toilet
facilities
with potable
water
Number of classroom in public schools
Pupil Classroom Ratio in public schools
Number of classrooms needing major repair
Number of JSS with workshops
Number of JSS with tools and equipment
Number of JSS with more than 10
computers
Write briefly on the JSS performance by answering the following questions on the indicators from 2008/09 - 2010/11.
1) What are the changes in the following? a) Gross Enrolment Rate (GER) b) Female GER
c) Gender Parity Index (GPI) d) Gross Admission Rate (GAR) e) Female GAR
f) Pupil Teacher Ratio (PTR) g) Pupil Textbook Ratio
h) Percentage of trained teachers i) Net Enrolment Rate (NER)
2) What are the causes of the changes in each indicator?
3) What would you do to improve the trend in each indicator?
7
SSS 2008/09 2009/10 2010/11 2010/11
Actual Actual Target Actual
Number of senior secondary schools Total
Public
Private
Number of students in all schools Total
Male
Female
Number of students Public
Private
Population aged 15-17 Total
Male
Female
Gross Enrolment Rate (GER) Total
Male
Female
Gender Parity Index (GPI) on GER
Number of public schools with equipped
laboratories
Number of schools with more than 10
computers Total
Public
Number of STME clinics
Number of students in STME clinic Male
Female
Number of days for STME clinic
2.5. TVET
TVET 2008/09 2009/10 2010/11 2010/11
Actual Actual Target Actual
Number of TVET schools Total
Public
Private
Number of students in all TVET schools Total
Male
Female
Number of students in TVET schools Public
Private
8 2.6. Non-Formal Education
Non-Formal Education 2008/09 2009/10 2010/11 2010/11
Actual Actual Target Actual
Number of students Total
Male
Female
Number of programmes run in the district Total
Public
Private
What changes have taken place for the years stated above? List priority areas to improve Non-Formal Education in your district What will your district do to strengthen these areas?
3. Education Management
3.1. Annual District Education Action Plan 2010
State the results of planned activities of ADEAP 2010 below: Serial
No.
Planned activity
Implementing unit/personnel
Budget amount (GH¢)
Funding source
Achieved result
Actual expenditure (GH¢)
9
・ When was the ADEAP produced? By Whom (District planning team?). Who was consulted during its production (District Authorities, local NGOs, Regional education Office, etc.) ?
・ What were the main priorities amongst these activities?
・ How were they prioritized (consultative meeting, response to central MOE/GES priority etc.) what was the reason for their high priority (linked to a priority target) ?
・ What has been the progress in implementing the ADEAP activities? (refer to other parts of the report as required).
・ What are the key achievements? -are there any best practices to share with other district education offices
• What have been the main obstacles to implementation? How has the district education office tried to overcome them?
• What support does the DEO required from MOE/GES or other partners to assist it in implementing activities in future?
3.2. District levies
• Are district levies in operation in your district?
・ List all the levies and the amount to be paid.
・ Are there any exemptions from the levies (e.g. for poor students) -If so how many exemptions were made and how was the decision to exempt a student made?
3.23. School Management Committees (SMC)
・ How many primary and JSS schools in your district have established School Management Committees (as a number and as a percentage of the total)?
・ Are the SMCs established appropriately -with community and parental representatives, regular meetings and so on?
Comment [DK6]: It is already reported in the matrix above.
10
・ How many primary and JSS schools in your district produce School
Performance Improvement Plans (SPIPs)? (as a number and as a percentage of the total)?
・ Are the SPIPs well produced and are they implemented effectively?
・ What areas of SMC management of SPIP production work well and what areas need strengthening?
・ What would you suggest as a means of strengthening SMCs?
・ What would you suggest as a means of strengthening the production of SPIPs?
3.34. School Operating Budgets (Capitation Grants)
• Do schools in your district receive capitation grants?
・ If so, are the amounts per male and per female student received sufficient, for what?
・ Are the guidelines on spending the grants sufficiently clear for head teachers and SMCs to understand?
• Is the financial reporting system sufficient to track the spending? Is it too complex or too simple?
• Do the operating budgets improve the quality of education services in the schools or not (Give number and percentage of schools reporting improvement, no change and worse: District monitoring visits should provide information on this)
3.4. District Education Oversight Committee
• Report dates of the meetings held by the committee.
• List up names of the committee members.
• List up what have been decided by the committee.
• Is there any problem or difficulty on management of the committee?
11
・ How many monitoring visits to schools did your office undertake (give total number of school visits by district circuit supervisors)
・ How many visits did the district circuit supervisors pay to the SMCs?
・ What were the key Issues that district circuit supervisors reported from their visits?
・ What were the key issues that schools and SMCs fed back to the district circuit supervisors?
・ How will the district education office respond to these issues?
5. Capacity strengthening
・ What activities have taken place to improve programme planning, implementation and monitoring processes
・ What are the priority areas for capacity strengthening in your district education office?
o List and prioritize staffing requirements o List and prioritize staff training needs o List and prioritize equipment needs
o List and prioritize recurrent budget needs (e.g. for transport/communication etc.)
・ How do you intend to meet these needs from your existing budget?
6. Punctuality and Absenteeism
Kindly comment on the following issues in your district and provide reasons for their occurrence. Is there any incidence of?
・ Absenteeism on the part of pupils/students?
・ Absenteeism on the part of teachers?
・ Lateness to school on the part of pupils/students?
12 7. Financial Report
7.1 Budget Execution
Provide a short paragraph describing each of the following:
・ Are there any activities for which the district has received significantly less than agreed in the budget? What are the reasons for this?
・ Are there any activities for which the district has received significantly more than agreed in the budget? What are the reasons for this?
・ Are there any activities for which significant under-spending is occurring? Why is this happening?
・ Are there any activities for which significant over-spending is occurring? Why is this happening?
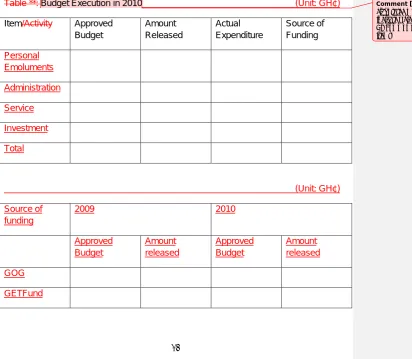
Table **: Budget Execution in 2010 (Unit: GH¢)
Item/Activity Approved
Budget
Amount Released
Actual Expenditure
Source of Funding
Personal Emoluments
Administration
Service
Investment
Total
(Unit: GH¢)
Source of funding
2009 2010
Approved Budget
Amount released
Approved Budget
Amount released
GOG
GETFund
[image:16.595.68.481.375.734.2]13
Social Intervention Programme
Internally Generated Fund
Donors
District Assembly Common Fund
Total
7.2 Qualitative Analysis (Budget Execution)
・ In which area have there been significant increases in budget allocations compared with earlier years? Why has this increase occurred?
・ In which areas have there been significant decreases in budget allocations compared with earlier years? Why has this decrease occurred?
・ Which areas will require increased budgets in future? Why?
・ Which areas can budgets be decreased in future? Why?
・ What are the key priorities for next year?
7.3 Financial Management Issues
・ Are there any areas of financial management that require strengthening?
・ Are reporting formats clear and easy to use? -how would you improve them?
・ Is budget release timely? If not, what problems does this cause?
・ Are there any problems concerned with cash flow?
7.4 Monitoring Finances
14
Inputs-Check source of funding: GOG, IGF & Donor and releases under Administration, Service and Investment. Find out the itemized amount budgeted for and actual
releases given to the district Process:
・ Which amount to be used for what?
・ Plans put in place for the use of the fund
・ How amount is kept (saved)
・ Main signatories to the account
Activity: What activities has been earmarked for item 2-4 Output: Has the releases been used for its purposes Outcomes:
・ Verify the variance between the actual and budgeted figures
・ Check the expenditures in all aspects of the activities
・ Where in doubt of the expenditure find out the source of expenditure
・ Find out the impact the funds have made (Administration, Service and Investment)
・ Find out if the disbursement of funds were done correctly
・ Comment on your findings and follow up with other methods such as Expenditure Tracking Survey
8. Non-Governmental Organizations in Education
8.1. Registration of NGOs
Name of NGO Registration Number
Date of Registration
MDA of Registration
15 8.2. Interventions from NGOs
Level Name of
NGO
Intervention/Contribution Value Number of Beneficiary School
9. Infrastructure profile
9.1. Infrastructure profile in public schools
9.2. What is the number and the state of repair of the following rooms/blocks?
9.3. Project Appraisal Activity Code Approach
10. Assessment of Classroom Furniture
11. Assessment of Teaching and Learning Materals
12. Education Payroll Expenditure
13. Staff Attrition
16
15. Illness/Accident/Suicide of Non-Teachers
16. Students/Pupils Deaths per Year
9. Conclusion
Conclude the report by describing the following points:
1) how the district performance has contributed to the national level sector performance
2) challenges to be overcome
3) recommendations for the next year ADEOP/ADEAP
Comment [DK9]: These should be deleted as these are too detailed for performance reporting.