PAGE NOTES lJ para J
57 Fig 2.13
76 last para
96 first para
97 Fig 4.13
IOI
111 line 3
125 para 2
Pentachlorophenol is a persistent chemical in the environment because of th~ absence of microorganisms in the natural environment able to degrade PCP at the concentrations at which it is present.
Compounds XII - XVIII should not to be listed in the legend because they are not presented in the diagram.
The negative results of the BBL Oxiferm® tube for ETOI were inconclusive and therefore the identification of ETO I by Yu (Pers. Comm., 1997) as Bradyrhizabium sp. was adopted.
The increase in lag period does not accurately reflect the proportional reduction of PCP-degrading ETO I cell numbers for all combinations tested. For example at I SOmg/l initial PCP concentration for the three combinations should theoretically produce a lag period three times that of ETO I in pure culture. The lag period was closer to twice that for ETOI in pure culture. This is one example of the three cultures in combination achieving a better result than was expected or seen with ETO I with only one of the other isolates (lag period would have had to be well below twice that for ETOI in pure culture). For initial PCP concentration of SOmg/l for the three isolates, the lag period was almost four times that of ETO I in pure culture at the same initial PCP concentration. The full inoculation of ETO 1 cells was not tested in combination with ET02 and ET03.
The following legend applies. PCP concentration mg/I (o); Ln Cell numbers(•).
Viable counts were repeatedly attempted and were initially the main aim of the project however due to technical difficulties were never deemed scientifically acceptable. Because ET02 and ET03 contributed minimally to the biomass (as measured by OD) only ETO I was considered for Ki calculations.
This statement reconfirms that ET02 was unlikely to be Sphingomonas spp. and the isolate was tentatively classified as Pseudomonas putida (Hussein et al., 1996). Some Pseudomonas spp. were reclassified as Sphingomonas spp. by Nohynek et al.,. ( 1995) and Haggblom et al., ( 1995).
B.
ERRATA LISTINGPAGE LINE CURRENTLY READS SHOULD READ
10 0 H=ggblom Haggblom
1::; IJ Yu and Shepherd. 1997 Yu and Shepherd, 1997
21 26 KFI T KFI
59 18 16sRNA 16S rRNA
72 2 "incubation temperature" ·'incubation temperatures" 125 4 (Yu. 1998) (Yu, 1997)
C. BIBLIOGRAPHY
PAGE
143 Tehan, Y-T andP. B. New. 1984. Genus I.AzotobacterBeijerinck 1901, 567AL, in Bergey's Manual of Systematic Bacteriology. Editor in Chief - Holt, J.G .. Williams and Wilkins. Baltimore London. Volume I, Pages 220-229.
145 World Health Organization (WHO). 1989. Pentachlorophenol Health and Safety Guide No. 19 0259 - 7268. WHO, Geneva, Switzerland.
A THESIS PRESENTED IN PARTIAL FULFILMENT OF THE
REQUIREMENTS
FOR
THE
DEGREE
OF
MASTER
OF
TECHNOLOGY
IN
ENVIRONMENTAL
ENGINEERING
AT
MASSEY UNIVERSITY, PALMERSTON NORTH
,
NEW ZEALAND.
Three isolates previously isolated from pentachlorophenol (PCP) contaminated soil as a
consortium were tested for their ability to remove PCP from a minimal mineral salts
medium with and without vitamin supplementation. Only one of the isolates, designated
Bradyrhizobium sp. strain ETOl, could utilise PCP as a sole source of carbon and
energy. The other two isolates designated Pseudomonas putida strain ET02 and
formerly Pseudomonas aureofaciens strain ET03 could grow in the presence of PCP but
could not utilise it as a sole source of carbon and energy. The effects of various initial
PCP concentrations and vitamin supplementation on the kinetics of PCP removal and
the cell numbers for ETO 1 and culture combinations was tested.
An increasing initial PCP concentration affected the PCP removal rate, the lag period,
the cell yield, cell numbers and specific growth rate. PCP removal by ETOl ceased at a
concentration of 175mg/l. The PCP removal rate increased for ETOl in pure culture
through the course of the experiments. The rate of removal at 150mg/l initial PCP
concentration improved from 1.48mg/l/hr to l .85mg/l/hr. The rate of removal at
120mg/l initial PCP concentration improved from l.38mg/l/hr to a maximum of
2.1 Omg/l/hr. The shortest lag period was 4 hours for ETO 1 in pure culture on 20mg/I
initial PCP concentration. The lag period for ETOl in pure culture was 0.30 of the initial
PCP concentration. The size of the inoculum of ETOl had an effect on the lag period
and the rate of PCP removal. Cell yield was extremely low for ETO 1 and the culture
combinations at all initial PCP concentrations tested. Measurable PCP removal was
observed when the cell density ofETOl reached approximately lx107 cells/ml. The final number of cells for ETO 1 for initial PCP concentrations over the range of 20mg/l to
150mg/l was approximately 5.5x10⁷ cell per ml (0.09mg/l). The highest specific growth rate for ETOl, 0.06hr-1, occurred in media containing yeast extract and at an initial PCP
concentration of 40mg/l.
Continuous subculturing under the selective pressure of PCP as the sole carbon and
energy source in media containing yeast extract led to an increased PCP removal rate
and a decreased lag period for ETOl. There was a slight increased rate effect of
ACKNOWLEDGEMENT
I would like to sincerely thank Dr. G. J. Manderson for his guidance, supervision and
valuable suggestions during the editing and experimental stages of this project.
I would like to thank Associate Professor Dr. Robert Chong for his assistance m
developing appropriate methodology in the experimental stage of the project and time
and effort in editing the final drafts.
I would like to acknowledge Professor Rao Bhamidimarri for enabling this project to be
undertaken in the Institute of Technology and Engineering (formerly the Department of
Process and Environmental Technology).
Thank you to the Technicians in the Microbiology Suite, Anne-Marie Jackson, John
Sykes, John Palmer, Mike Sayaham and Steve Arnold for essential help, advice and
good humour.
Thank you to Steve Flint for helping me to access materials, assisting with the
fluorescence microscopy and providing information on developing microscopy
techniques.
My father, mother and step-father have supported me morally, financially and
unquestioningly throughout my lengthy university career, I am truly grateful. Thanks to
my friends and brother and sister as well because they desperately wanted a mention
(and are of course very important). I am sorry my Grandfather did not get to see the finished article however Granny more than makes up for his absence with her
enthusiastic encouragement.
I would especially like to thank Dr. Joanna Shepherd who gave me invaluable moral
ABSTRACT
ACKNOWLEDGEMENTS
TABLE OF CONTENTS
LIST OF FIGURES
LIST OF TABLES
1.
2.
2.1
2.2
Introduction
Literature Review
Pentachlorophenol
2.1.1 Toxicity of Pentachlorophenol
2.1.2 Production of Pentachlorophenol
2.1.3 PCP Contamination in New Zealand
Bioremediation of PCP Contaminated Sites
2.2.1 Biological Treatment Technologies
2.2.1.1 Solid Phase Treatment
2.2.1.2 In Situ Bioremediation
2.2.1.3 Slurry-Phase Biotreatment
2.2.2 Bioremediation Case Studies
2.2.3 Phytoremediation and Anaerobic Bioremediation
2.2.4 Feasibility of Bioremediation
Page
1
11
111
Vlll
XVll
1
3
3
3
5
7
9
10
11
11
12
13
15
2.3 2.4 2.5 3. 3.1 3.2
PCP Degrading Microorganisms
2.3.1 Pseudomonadaceae
2.3.2 Sphingomonadaceae
2.3.3 Actinomycetes
2.3.4 Other Aerobic PCP Degrading Strains
2.3.5 Anaerobic PCP Degraders
2.3.6 PCP Degrading Fungi
2.3.7 PCP Degrading Microalgae
Growth Kinetics
2.4.1 Parameters Affecting Growth
2.4.1.1 Initial PCP Concentration
2.4.1.2 Inoculum
2.4.1.3 Carbon Supplementation
2.4.1.4 Temperature
2.4.1.5 pH
2.4.1.5 Plasmids
2.4.2 Growth Rates
Biochemistry of PCP Degradation
2.5.l Aerobic Degradation of PCP
2.5. l. l The Sphingomonas spp. Pathway
2.5. l.2 The Mycobacterium spp. Pathway
2.5.2 Anaerobic Degradation of PCP
2.5.3 Composite PCP Degradation Pathways
2.5.3.1 0-Methylation of PCP
2.5.3.2 Photodegradation of PCP
Materials and Methods
Cultures
Growth and Maintenance of Cultures
3.2.1 Inoculum 60
3.2.2 Culture Growth 61
3.3 HPLC Analysis 62
3.4 Chloride Analysis 63
3.5 Epifluorescence Staining 64
3.5.l Acridine Orange Staining 65
3 .5 .1.1 Reagents 65
3.5.1.2 Staining Procedure and Cell Counts 66
3.5.2 Cell number conversion 68
3.5.3 CTC Staining 68
3.5.3.1 Reagents 68
3.5.3.2 Staining Procedure 70
3.5.3.3 Staining Parameters Investigated 71
3.5.4 Sequential CTC/ AO Staining 72
3.6 Vitamin Experiment 72
3.7 Rate Determination 74
3.8 Calculation of Specific Growth Rate 74
3.9 Calculation of Inhibition Constant 74
3.10 Calculation of 95% Confidence Intervals 75
4. Results 76
4.1 Isolate Growth and Characteristics 76
4.2 Initial PCP Removal 77
4.2.1 Lag Period for Initial PCP Removal 81
4.3 PCP Removal and Chloride Release 82
4.3.1 Theoretical and Actual Chloride Release 87
4.3.2 Lag Period 89
4.4 Synergism Experiments 90
4.4.1 Lag Period for Culture Combinations 94
4.6
5.
5.1
5.2
5.3
5.4 5.5 5.6 5.7 5.8 5.9 6. 7. AS. A8.l A8.2 A8.3 Vitamin Experiment
4.6.1 Lag Period for Vitamin Experiment
Discussion Introduction Isolates PCP Removal Chloride Release Lag Period
Cell Density and Yield
Specific Growth Rate
Culture Combinations
Vitamins
Conclusions
Literature Cited
Appendix
Fluorescence Microscopy Staining Techniques
A8.1. l Direct Epifluorescence Microscopy
A8. l .2 Fluorescent Dyes
A8.l.2.1 Total Bacterial Counts
A8.l.2.2 Metabolically active bacterial counts
CTC Validation Experiment
A8.2.1 CTC Staining
Minerals and Vitamins
A8.3. l Minerals
A8.4 Initial PCP Removal Regression Equations 161
A8.5 PCP Removal and Chloride Release 163
A8.6 PCP Removal Regression Equations 167
A8.7 Chloride Release Regression Equations 168
A8.8 Theoretical versus Actual Chloride Release 169
A8.9 Culture Combination PCP Removal 172
AS.IO Culture Combination PCP Removal Regression Equations 173
A8.ll PCP Removal and Organism Growth 174
A8.12 Specific Growth Rates for ETOl and Culture Combinations 180
A8.13 Yield for ETO 1 and Culture Combinations 181
A8.14 Yield Regression Equations 187
A8.15 Composite Table of PCP Removal, Chloride Release, Yield 188
and Specific Growth Rates
LIST OF FIGURES
Figure number
2.1
2.2
2.3
2.4
2.5
2.6
2.7
2.8
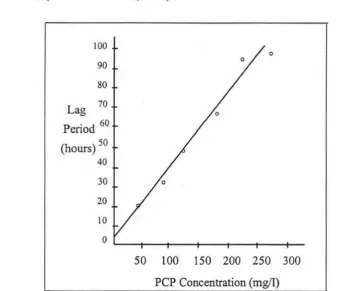
The effect of initial PCP concentration on lag time for
Arthrobacter sp. strain NC in batch culture (Stanlake and Finn,
1982).
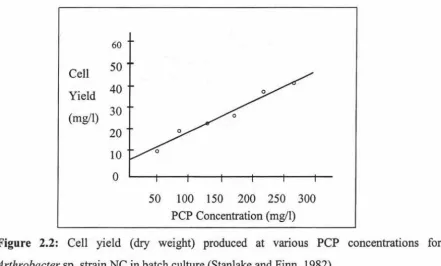
Cell yield (dry weight) produced at various PCP concentrations for
Arthrobacter sp. strain-NC in batch culture (Stanlake and Finn,
1982).
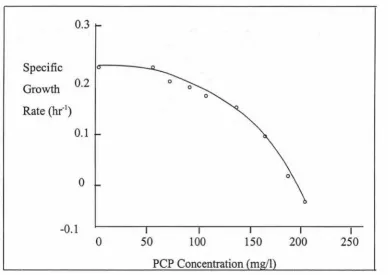
Effect of PCP concentration on specific growth rate (Gu and Korus, 1995).
Specific growth rate of Arthrobacter sp. strain NC (Stanlake and Finn, 1982).
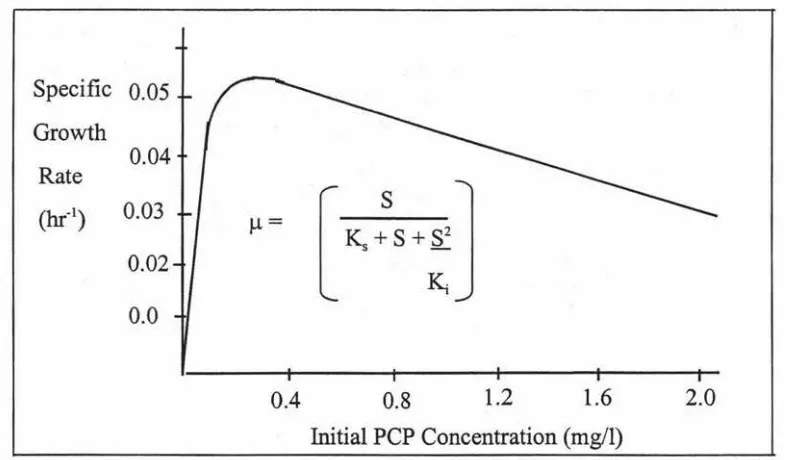
The relationship between initial PCP concentration and specific growth rate calculated by using the Haldane modification of the Monod equation. Values of the parameters used for the calculation were; µmax = 0.074h-1, Ks= 0.060mg/1 and Ki = l.375mg/1 (Klecka and Maier, 1985).
Dehalogenation mechanisms involved in the degradation of PCP (McAllister et al., 1996).
Summary of the aerobic Sphingomonas spp. pathway with steps
from VI on derived from Azotobacter and Streptococcus.
Degradation of tetrachloro-p-hydroquinone (TeCHQ) to trichlorohydroquinone (TCHQ) by tetrachloro-p-hydroquinone reductive halogenase via the S-chloromethyl glutathione conjugate.
Page
31
33
38
39
40
43
45
Figure number
2.9
2.10
2.11
2.12
2.13
4.1
4.2
4.3
4.4
4.5
Reaction sequence of 2-chloromaleylacetate catalysed by
maleylacetate reductase producing 3-oxoadipate (Kaschabek and
Reineke, 1992; Vollmer et al., 1993).
Summary of the Mycobacterium spp. aerobic PCP degradation
pathway.
Summary of the anaerobic pathway of PCP degradation by pure
and mixed cultures.
A composite diagram illustrating the links between the anaerobic
and aerobic PCP degradation pathways.
The products of photodegradation of PCP (Kaufinan, 1978;
McAllister et al., 1996).
PCP removal by ETOl at three initial PCP concentrations (a) with
25mg/l yeast extract; (b) without 25mg/l yeast extract.
PCP removal by ETOl at varying initial PCP concentrations (a)
with 25mg/l yeast extract; (b) without 25mg/l yeast extract.
PCP removal rates by ETO 1 at various initial PCP concentrations
with and without 25mg/l yeast extract.
Lag period versus initial PCP concentrations for ETOl.
Removal of PCP by ETOl at an initial concentration of 20mg/l and
concomitant chloride release in media (a) with 25mg/l yeast
extract; (b) without 25mg/l yeast extract.
Page
48
50
52
55
57
78
79
80
82
Figure number
4.6
4.7
4.8
4.9
4.10
4.11
4.12
4.13
4.14
PCP removal rates for ETOl at various initial PCP concentrations
with and without 25mg/l yeast extract.
Chloride release rates for ETOl at vanous initial PCP
concentrations with and without 25mg/l yeast extract.
Theoretical and actual chloride release for ETO 1 at an approximate
initial PCP concentration of 20mg/l (a) with 25mg/l yeast extract;
(b) without 25mg/l yeast extract.
Lag period versus PCP concentration for ETO 1.
PCP removal from 50mg/1 initial PCP concentration by culture
combinations as indicated (see legend) in a minimal mineral salts
(MMS) medium with 25mg/l yeast extract.
PCP removal rates for the culture combinations at three initial PCP
concentrations as indicated (see legend) in a minimal mineral salts
(MMS) medium with 25mg/l yeast extract.
The effect of initial PCP concentration on the lag period for ETOl
and culture combinations as indicated (see legend) in a minimal
mineral salts (MMS) medium with 25mg/l yeast extract.
Increase in ETOl cell numbers at an initial PCP concentration of
20mg/l.
Yield for ETOl in pure culture and culture combinations (see
legend) in a minimal mineral salts (MMS) medium with 25mg/l
yeast extract.
Page
86
87
88
90
92
94
96
97
Figure number
4.15
4.16
4.17
4.18
4.19
AS.I
A8.2
A8.3
A8.4
A8.5
Specific growth rates for ETOI in pure culture and culture
combinations (see legend) in a minimal mineral salts (MMS)
medium with 25mg/l yeast extract.
Removal of 50mg/l PCP by ETOI in pure culture with different
vitamin supplementation (see legend).
Removal of 50mg/l PCP by ETOI and ET02 with different vitamin
supplementation (see legend).
Removal of 50mg/l PCP by ETOI and ET03 with different vitamin
supplementation (see legend).
Removal of 50mg/l PCP by ETOI, ET02 and ET03 with different vitamin supplementation (see legend).
The structure of acridine orange (Kodak, 1996).
The structure ofDAPI (Haughland, 1996).
CTC reduced to the water-insoluble fluorescence CTC-formazan
(Haughland, 1996).
Removal of PCP at an initial concentration of 40mg/l and
concomitant chloride release (a) with 25mg/l yeast extract; (b)
without 25mg/l yeast extract. Theoretical chloride release from
40mg/l PCP is 26.8mg/l.
Removal of PCP at an initial concentration of 50mg/l and
concomitant chloride release (a) with 25mg/l yeast extract; (b)
without 25mg/l yeast extract. Theoretical chloride release from
50mg/1 PCP is 33.5mg/l.
Page
100
102
103
103
104
151
152
153
163
Figure number
A8.6
A8.7
A8.8
A8.9
A8.10
A8.l 1
A8.12
Removal of PCP at an initial concentration of 60mg/l and
concomitant chloride release (a) with 25mg/l yeast extract; (b)
without 25mg/l yeast extract. Theoretical chloride release from
60mg/l PCP is 40.2mg/l.
Removal of PCP at an initial concentration of 80mg/l and
concomitant chloride release (a) with 25mg/l yeast extract; (b)
without 25mg/l yeast extract. Theoretical chloride release from
80mg/l PCP is 53.6mg/l.
Removal of PCP and concomitant release of chloride at an initial
concentration of lOOmg/l PCP. Theoretical chloride release from
lOOmg/l PCP is 67.7mg/l.
Removal of PCP and concomitant release of chloride at an initial
concentration of 120mg/l PCP. Theoretical chloride release from
120mg/l PCP is 80.4mg/l.
Removal of PCP and concomitant release of chloride at an initial ·
concentration of 150mg/l PCP. Theoretical chloride release from
150mg/l PCP is lOOmg/l.
Removal of PCP and concomitant release of chloride at an initial
concentration of 175mg/1 PCP. Theoretical chloride release from
175mg/1 is 116.7mg/l.
Theoretical and actual chloride release for PCP at an initial
concentration of 40mg/l (a) with 25mg/l yeast extract; (b) without
25mg/1 yeast extract.
Page
164
164
165
165
165
166
Figure number
A8.13
A8.14
A8.15
A8.16
A8.17
A8.18
A8.19
A8.20
A8.21
Theoretical and actual chloride release for PCP at an initial concentration of 50mg/l (a) with 25mg/l yeast extract; (b) without 25mg/l yeast extract.
Theoretical and actual chloride release for PCP at an initial concentration of 60mg/l (a) with 25mg/l yeast extract; (b) without 25mg/l yeast extract.
Theoretical and actual chloride release for PCP at an initial concentration of 80mg/l (a) with 25mg/l yeast extract; (b) without 25mg/l yeast extract.
Theoretical and actual chloride release for PCP at an initial concentration of 1 OOmg/1 with 25mg/1 yeast extract.
Theoretical and actual chloride release for PCP at an initial concentration of 120mg/l with 25mg/l yeast extract.
Theoretical and actual chloride release for PCP at an initial concentration of 150mg/l with 25mg/l yeast extract.
PCP removal from 1 OOmg/l initial PCP concentration by three bacterial cultures in pure culture and in combinations as indicated.
PCP removal from 150mg/l initial PCP concentration by ETOl and culture combinations as indicated.
Increase in ETOl cell numbers as PCP is depleted from an initial PCP concentration of 40mg/l.
Page
169
170
170
170
171
171
172
172
Figure number
A8.22
A8.23
A8.24
A8.25
A8.26
A8.27
A8.28
A8.29
A8.30
A8.31
A8.32
Increase in ETO 1 cell numbers as PCP is depleted from an initial
PCP concentration of 60mg/l.
Increase in ETO 1 cell numbers as PCP is depleted from an initial
PCP concentration of 80mg/l.
Increase in ETOl cell numbers as PCP is depleted from an initial
PCP concentration of 50mg/l.
Increase in ETO 1 and ET02 cell numbers as PCP is depleted from
an initial PCP concentration of 50mg/l.
Increase in ETOl and ET03 cell numbers as PCP is depleted from
an initial PCP concentration of 50mg/l.
Increase in ETO 1, ET02 and ET03 cell numbers as PCP is depleted
from an initial PCP concentration of 50mg/l.
Increase in ETOI cell numbers as PCP is depleted from an initial
PCP concentration of 1 OOmg/l.
Increase in ETOI and ET02 cell numbers as PCP is depleted from
an initial PCP concentration of 1 OOmg/l.
Increase in ETO 1 and ET03 cell numbers as PCP is depleted from
an initial PCP concentration of 1 OOmg/l.
Increase in ETOI, ET02 and ET03 cell numbers as PCP is depleted
from an initial PCP concentration of 1 OOmg/l.
Increase in ETO 1 cell numbers as PCP is depleted from an initial
PCP concentration of 150mg/l.
Page
174
175
175
176
176
176
177
177
177
178
Figure number
A8.33
A8.34
A8.35
A8.36
A8.37
A8.38
A8.39
A8.40
A8.41
A8.42
A8.43
Increase in ETOl and ET02 cell numbers as PCP is depleted from an initial PCP concentration of 150mg/l.
Increase in ETOl and ET03 cell numbers as PCP is depleted from an initial PCP concentration of 150mg/1.
Increase in ETOl, ET02 and ET03 cell numbers as PCP is depleted from an initial PCP concentration of 150mg/l.
Biomass produced for PCP removed for ETOl at 20mg/l initial PCP concentration.
Biomass produced for PCP removed for ETOl at 40mg/l initial PCP concentration.
Biomass produced for PCP removed for ETO 1 at 60mg/l initial PCP concentration.
Biomass produced for PCP removed for ETO 1 at 80mg/l initial PCP concentration.
Biomass produced for PCP removed for ETOl at 50mg/l initial PCP concentration.
Biomass produced for PCP removed for ETOl and ET02 m combination at 50mg/l initial PCP concentration.
Biomass produced for PCP removed for ETOl and ET03 m combination at 50mg/l initial PCP concentration.
Biomass produced for PCP removed for ETO 1, ET02 and ET03 in combination at 50mg/l initial PCP concentration.
Page
178
179
179
181
181
182
182
182
183
183
Figure number
A8.44
A8.45
A8.46
A8.47
A8.48
A8.49
A8.50
A8.51
Biomass produced for PCP removed for ETOl at IOOmg/l initial
PCP concentration.
Biomass produced for PCP removed for ETO 1 and ET02 m
combination at 1 OOmg/l initial PCP concentration.
Biomass produced for PCP removed for ETOI and ET03 m
combination at l OOmg/l initial PCP concentration.
Biomass produced for PCP removed for ETOl, ET02 and ET03 in
combination at 1 OOmg/l initial PCP concentration.
Biomass produced for PCP removed for ETOl at 150mg/l initial
PCP concentration.
Biomass produced for PCP removed for ETOI and ET02 m
combination at l 50mg/I initial PCP concentration.
Biomass produced for PCP removed for ETOl and ET03 m
combination at l 50mg/l initial PCP concentration.
Biomass produced for PCP removed for ETO 1, ET02 and ET03 in
combination at 150mg/l initial PCP concentration.
Page
184
184
184
185
185
185
186
LIST OF TABLES
Table Number Page
2.1 The physical properties of PCP and NaPCP (WHO, 1989). 5
2.2 Degradation rates of PCP by pure cultures of]?acteria. 37
3.1 Summary of staining procedure infonnation as recommended by 65
Kepner and Pratt (1994).
4.1 Line drawing of each isolates' cellular morphology and cell size. 76
4.2 Biochemical characteristics ofETOl, ET02 and ET03. 77
4.3 PCP removal rates at three initial PCP concentrations with and 78
without 25mg/l yeast extract.
4.4 PCP removal rates at various initial PCP concentrations. 79
4.5 Lag periods for a range of initial PCP concentrations for ETO 1 81
with yeast extract.
4.6 PCP removal and chloride release rates for ETOl at various initial 85
PCP concentrations with and without 25mg/l yeast extract.
4.7 Lag periods for an range of initial PCP concentrations for ETO 1. 89
4.8 PCP removal rates for culture combinations at three initial PCP 93
concentrations in a minimal mineral salts (MMS) medium with
25mg/l yeast extract.
4.9 Lag periods for ETOl and culture combinations at three initial PCP 95
concentrations in a minimal mineral salts (MMS) medium with
Table Number
4.10
4.11
4.12
4.13
A8.l
A8.2
A8.3
A8.4
A8.5
A8.6
Yields and specific growth rates for ETO 1 and culture
combinations in MMS broth containing 25mg/l yeast extract.
Ki values for ETO 1 and the culture combinations.
PCP removal rates for culture combinations with different vitamin
supplementation (MMS medium containing an initial PCP
concentration of 50mg/l).
Lag periods for culture combinations with different vitamin
supplementation (MMS medium containing an initial PCP
concentration of 50mg/l).
Regression equations for PCP removal at vanous initial PCP
concentrations with and without 25mg/l added yeast extract.
Regression equations for PCP removal at vanous initial PCP
concentrations with and without 25mg/l added yeast extract.
Regression equations for PCP removal by culture combinations at
50, 100 and 150mg/l PCP.
Regression equations for chloride release at various initial PCP
concentrations with and without 25mg/l added yeast extract.
Regression equations for PCP removal by culture combinations at
50, 100 and 150mg/l PCP.
Regression equations for cell growth, In (cell numbers), of ETOl at various PCP concentrations and culture combinations at 50, 100
and 150mg/l PCP.
Page
98
101
105
107
161
162
167
168
173
Table Number
A8.7
A8.8
A8.9
Biomass yield for ETOl and culture combinations.
PCP removal rate, chloride release rate, yield and specific growth
rate for ETOl in pure culture with yeast extract.
Regression equations for the culture combinations with different
vitamin supplementation.
Page
187
188
1.
INTRODUCTION
Pentachlorophenol (PCP) is a highly toxic and persistent organochlorine compound.
Pentachlorophenol and its sodium salt, sodium pentachlorophenate (NaPCP), have been
utilised in New Zealand for their fungicidal and bactericidal properties since the 1950's
(Bingham, 1992). PCP and its derivatives have a relatively low production cost
compared to other biocides. In addition they offer the advantages of oil solubility, water
solubility (in the sodium salt form), persistence and fairly widespread microbiological
activity. This has meant that historically these materials have been applied not only for
wood preservation and protection but also across a spectrum of manufactured materials
and situations where antimicrobial activity is required (Bingham, 1992).
Freshly sawn green softwood timber which is susceptible to attack by sapstain and
decay-causing fungi and must be protected by chemical treatment. Timber treatment
with PCP has included both surface treatment to provide short-term protection, as an
antisapstain, and less frequently, pressure treatment to afford long-term protection of the
timber (Nadebaum et al., 1992). As a result the soil of a large number of timber
treatment sites around New Zealand are contaminated by PCP and its polychlorinated
dioxin (PCDD) and dibenzofuran (PCDF) impurities (Bingham, 1992; Jackman, 1992;
Szabo, 1993).
The timber industry was made aware of the significance of the environmental and health
problems associated with NaPCP in the period preceding 1988, so that by the middle of
that year the industry had moved substantially to adopt alternative antisapstain
treatments. On 31 December 1991 the Pesticide Board de-registered all sodium
pentachlorophenate timber treatment products (Bingham, 1992).
Pentachlorophenol poses a serious environmental risk because it is acutely toxic and is
relatively resistant to chemical and biological degradation (Knackmuss and Hellwig,
1978). It is important that PCP is removed from the environment as it affects
reproduction, impairs the immune system and poses carcinogenic, foetotoxic and
Because PCP has been present in the environment since early this century
micro-organisms present in the contaminated water and soils have adapted to growth in the
presence of PCP and micro-organisms have been isolated that can utilise PCP as a
growth substrate (Watanabe, 1973; Stanlake and Finn, 1982; Shelton and Tiedje, 1984;
Saber and Crawford, 1985; Utkin et al., 1994; Bouchard et al., 1996; Hussein et al.,
1996). Micro-organisms which are able to degrade pentachlorophenol (PCP) can still be
killed or experience growth inhibition if they are exposed to a sufficiently high PCP
concentrations as it is an uncoupler of oxidative phosphorylation (K.lecka and Maier,
1985; Stanlake and Finn, 1982; Gonzalez and Hu, 1995; Miethling and Karlson, 1996).
The method of choice to remove PCP from the environment is by biological
remediation or bioremediation. Bioremediation combines biology and technology and
the resulting biotechnology has applications to environmental problems (Fetzner and
Lingens, 1994). Bioremediation utilises the ability of certain micro-organisms to
degrade organic compounds to simpler molecules and ultimately to carbon dioxide and
water. This project contributes to the characterisation of PCP utilising micro-organisms
and the biodegradation technology of this recalcitrant compound.
The following literature review will examme aspects of bioremediation of PCP
contaminated sites, the various micro-organisms that can utilise PCP and the kinetic
parameters of PCP degradation. The biochemistry of PCP utilisation by aerobic and
2.
LITERATURE REVIEW
2.1
PENTACHLOROPHENOL (PCP) IN NEW ZEALAND
New Zealand produces approximately 2 million cubic metres of sawn timber per annum
(Jackman, 1992). Traditionally pine was used in the pulp and paper industry, but as
chemical timber preservation techniques developed and mass production became
possible, pine became a widely used construction material in New Zealand and an
important export product. Thus the development of timber preservation techniques
enabled construction material to have an extended life time. Over the past thirty to forty
years various synthetic chemicals have been used to stop fungal and bacterial attack of
freshly sawn timber, to prevent sapstain and for the permanent preservation of timber
from decay caused by attacks from fungi, bacteria, mites and insects. The anti-sapstain
biocides pentachlorophenol (PCP) and sodium pentachlorophenol (NaPCP) are two of
the most widely used industrial timber preservatives (Jackman, 1992).
2.1.1 TOXICITY OF PCP
Pentachlorophenol is a highly toxic, persistent organochlorine chemical used widely as
a timber preservative and pesticide over the past 40 years in New Zealand (Jackman, '
1992). Pentachlorophenol and its sodium salt (NaPCP) are among the most widely
distributed and versatile biocides used in the world and because of their efficiency,
broad spectrum and low cost, they have been utilised as algicides, bactericides,
fungicides, herbicides, insecticides, and molluscicides with a variety of applications in
the industrial, agricultural and domestic fields (WHO, 1989).
The first time attention was drawn to the toxicity of PCP was in 1906 by Bechold and
Ehrlich, but not until 1938 were experiments conducted in the USA that extended into
the 1940s able to show that PCP was toxic to humans and was readily absorbed through
the skin. Associated health and neurological disorders were described by the WHO as
early as 1953 (Jackman, 1992). Thus, the toxicity and lethality, towards humans, of PCP
PCP is an inhibitor of oxidative phosphorylation and is toxic to a variety of organisms
(Mileski et al., 1988). Pentachlorophenol is acutely toxic to fish and a concentration of
0.6mg/1 is lethal for most species (Edgehill and Finn, 1983). Adverse effects on aquatic
organisms have been observed at PCP concentrations >34µg/l (Gifford et al., 1994).
PCP has been shown to bioaccumulate (i.e. an increase in body concentration relative to
the environment) in aquatic biota (Gifford et al., 1994). As PCP was formulated as an
antimicrobial agent, it's recalcitrance in the environment and resistance to microbial
attack is no surprise. The high degree of chlorination and toxicity of PCP make
biodegradation a slow process. Many organisms, however, have been isolated from PCP
contaminated soils, and some degrade and mineralise PCP, albeit slowly.
The main occupational health problems reported among PCP users in New Zealand have
tended to be dermatitis related. However, PCP and its contaminants have been linked to
types of cancer (Jackman, 1992). The USEPA has determined that PCP poses
carcinogenic, foetotoxic and teratogenic risks (Jackman, 1992). Of particular concern is
the growing body of evidence that shows that organochlorines affect reproduction,
impair the immune system and cause cancer (Jackman, 1992). The acute health effects
of exposure to high concentrations of technical grade PCP are generally the result of the
biological action of the PCP molecule itself. In contrast to this the chronic effects and
the effects of long-term exposure to technical grade PCP are most probably related
largely to the biological action of the polychlorodibenzo-p-dioxins (PCDDs) and
polychlorodibenzo-p-furans (PCDFs) (WHO, 1989). Pentachlorophenol is absorbed
through the intact skin and the respiratory and gastrointestinal tracts and is distributed in
tissues (WHO, 1989). Pentachlorophenol does not remain in the human body as long as
many other organochlorines and is mostly removed in the urine with a half-life of 30
hours (Morton, 1997). Median urinary PCP concentrations of approximately 11 mg/I are
typical for workers in contact with PCP, compared with urinary concentrations of
approximately 0.01 mg/l for the general population (WHO, 1989). Exposure of the
general population to low doses of PCP is common. Pentachlorophenol has been found
The exact duration and concentration of exposure to PCP needed to cause adverse
effects in humans are not well known, though 0.09mg/l in air will cause irritation of
eyes and nose and l 4mg/1 is immediately dangerous to life and health in humans. Its
current virtually safe dose (VSD) level is set at 0.006 pg/kg body weight per day (WHO,
1989). In 1977, the US National Academy of Sciences set the Acceptable Daily Intake
(ADI) at 3µg/kg body weight per day (WHO, 1989). In New Zealand, the National Task
Group has adopted a level of 10 pg/kg body weight, a standard which allows the highest
level of contamination and requires the lowest standard for clean-up (Jackman, 1992).
2.1.2 PRODUCTION OF PCP
Pentachlorophenol consists of colourless to light brown flakes or crystals, with a
characteristic phenolic odour (WHO, 1989). It is practically insoluble in water and
decomposes on heating in the presence of water, forming hydrochloric acid. It is
non-corrosive and non-flammable in an unmixed state, however dissolved in oil, PCP causes
deterioration of rubber. The sodium salt of PCP, sodium pentachlorophenate (NaPCP) is
marketed as a tan powder, pellets, or briquettes with a phenolic odour. NaPCP is readily
soluble in water. It decomposes on heating forming toxic fumes, chlorides and sodium
oxide. The physical properties of PCP and NaPCP are noted in Table 2.1.
Table 2.1 The physical properties of PCP and NaPCP (WHO, 1989) (ND= not determined).
PCP NaPCP
Molecular formula C6Cl50H C6Cl50Na
Boiling point 310°C (decomposition) decomposition
Melting point 191°C decomposition Relative density (H20 = 1) 2.0 2.0
(air= 1) 9.2 ND
Vapour pressure (20 °C) 2mPa ND
Relative molecular mass 266.3 288.3
Octanol/ water part. coeff. 3.56 ND (pH 6.5)
Solubility in water 2 g/l (20°C, pH 7) 330 g/l (25°C) Solubility in organic
[image:29.553.66.506.526.764.2]Pentachlorophenol and its derivatives have a relatively low production cost compared to
other biocides. In addition they offer the advantages of oil solubility, water solubility (in
the sodium salt form), persistence and a wide spectrum of anti-microbiological activity.
This has meant that historically these materials have been applied not only for wood
preservation and protection but also across a range of manufactured materials and
applications where antimicrobial activity is required (Bingham, 1992).
Pentachlorophenol is produced by reacting chlorine gas with phenol in the presence of
catalysts such as anhydrous aluminium chloride or ferrous chloride. It is also possible to
manufacture it via the alkaline hydrolysis of hexachlorobenzene (McAllister et al.,
1996). During the manufacture of PCP "a large number" of toxic impurities such as
polychlorodibenzo-dioxins and furans (dioxins and furans) are also produced. They
represent some of the most toxic substances known. Dioxins and furans comprise a
family of over 200 individual compounds and are highly persistent in the environment
and have been shown to accumulate in mammalian tissue (Bingham, 1992). The extent
of contamination of pentachlorophenol by dioxins and furans impurities during it's
production is closely related to the care exercised during manufacture. Over chlorination
of the product can be prevented by minimising the temperature of the reactor system at
it's various chlorination stages reducing the impurities (Bingham, 1992).
Pentachlorophenol has been imported in to New Zealand and distributed by a number of
companies since its introduction in the early 1950's. Pentachlorophenol has not at any
time been manufactured in New Zealand, however a number of companies have been
involved in the production of sodium pentachlorophenate by addition of base to
pentachlorophenol raw material. Where contamination of the pentachlorophenol starting
material is significant, a sludge waste may be generated during the pentachlorophenate
production process which is enriched in PCDDs and PCDFs. A sample from this waste
stream was analysed and contained a concentration of 56mg/l toxic equivalents
Up to 200 tonnes of PCP were used per annum in New Zealand over a period of
approximately 40 years and approximately 5000 tonnes are believed to have been used
in total. In Finland, the estimated total use of PCP since the 1930's was 25, 000 tonnes
(McAllister et al., 1996). Spills, leaks and dumping have resulted in PCP entering the
soil and groundwater around the treatment plants in New Zealand (Szabo, 1993). It has
been estimated that about 70% of all sawmills in New Zealand have used PCP (Szabo,
1993).
2.1.3 PCP CONTAMINATION IN NEW ZEALAND
Prior to 1970 NaPCP was the only prophylactic wood preservative, insecticide and
herbicide used commercially in New Zealand (Gonzalez and Hu, 1995). From the early
1970s concerns were raised about potential wide scale sawmill site contamination with
PCP, dioxins and furans, and their possible effects on the environment and human
health in New Zealand (Gifford et al., 1994). Antisapstain researchers embarked on
trials to secure alternative replacements (Bingham, 1992). The timber industry was
made aware of the significance of the environmental and health problems associated
with PCP and NaPCP in the period preceding 1988. By the middle of 1988, when PCP
was voluntarily withdrawn from use by the timber industry (Jackman, 1992), there had
already been a substantial move to adopt alternative antisapstain treatments.
A major problem only recognised recently is that PCP can form dioxins in the
environment (Jackman, 1992). Over the last few years, researchers have come to suspect
that chlorinated dioxins and furans can be formed from chlorophenols under ambient
conditions as well as at the high temperatures normally associated with their creation in
industrial settings. It was discovered that enzymes could catalyse these reactions in
vitro. A labeling study has indicated that PCP reacts to form highly chlorinated dioxins
and furans in sewage sludge (Jackman, 1992).
In 1990 the New Zealand Government appointed the New Zealand National Task Group
(NTG) to investigate site contamination from the use of timber treatment chemicals
pentachlorophenate timber treatment products (Bingham, 1992). In August 1992 the NTG reported that there are more than 600 contaminated timber treatment sites and PCP dump sites in New Zealand. Of the 600 plus known sites contaminated with PCP and its derivatives, only the Waipa sawmill and Lake Rotorua have been studied by the New Zealand National Task Group to date (Bingham, 1992).
As well as contaminated timber treatment sites throughout the country there are an unknown number of dump sites containing contaminated waste. There is significant contamination of the wider environment by PCP, dioxins and furans and other constituents of the PCP formulations through leaching and movement into groundwater and accumulation in food chains (Bingham, 1992; Jackman, 1992; Nadebaum et al.,
1992; Szabo, 1993). Where large areas of subsurface soils are polluted by PCP, there are limited options for clean up. Studies have shown that biological treatment using microbial biodegradation is a possible means to deal with this type of waste (Radehaus and Schmidt, 1992).
Pentachlorophenol has not apparently been used in New Zealand as a dressing for seeds,
as a preservative in the leather or tanning industries, as a biocide in drilling rigs, as an antimicrobial in wallpaper adhesives or as a protection agent in the wool manufacturing industry, as it has in other countries (Bingham, 1992). PCP has been applied to soil surfaces in flooded paddy fields in the USA and infiltrates into the soil with percolating water (Murthy et al., 1979). It has also been used as a soil and timber sterilant in
2.2
BIOREMEDIATION OF PCP CONTAMINATED SITES
Bioremediation is a biologically-based treatment process used to degrade industrial
based organic compounds and waste materials into simpler molecules and ultimately to
carbon dioxide, water and inorganic salts (Hayes, 1996). Bioremediation combines
biology and technology and the resulting biotechnology has applications to
environmental problems (Fetzner and Lingens, 1994). Bioremediation methods are
extremely advantageous in that they ultimately mineralise a contaminant and involve
little, if any, movement of the contaminated material. Biological treatment of hazardous
wastes has been practiced successfully for many years, and the bioremediation industry
has experienced sustained rapid growth over the past decade. The costs of
bioremediation can vary from very cheap, as in land tilling and composting, to very
expensive in the case of controlled leaching followed by bioreactor treatment of
leachate.
Halophenols pose a senous environmental risk because of their acute toxicity and
relative persistence to chemical and biological degradation (Knackmuss and Hellwig,
1978). It is apparent from the studies on contaminated wood-preserving sites that
polychlorinated phenols and dioxins are persistent in soil and groundwater. A variety of
analytical methods have become available for analytical detection and measurement of
PCP and its related compounds (Crosby, 1981), this means contamination can be
measured and treatment appropriate to the contamination implemented.
Pentachlorophenol is a persistent chemical in the enviroriment because of the absence of
micro-organisms with the capability to degrade it. Factors such as temperature, pH,
salinity and water activity, oxygen availability, permeability of the surface for air and
water and availability of nutrients can affect bioremediation. The concentration of PCP
may be either too high, proving toxic for micro-organisms, or too low because of
incorporation into humic substances or absorption to soil particles thereby failing to
induce the degradative enzymes. Biological remediation aims to optimise the
environmental conditions so that indigenous or inoculated organisms can degrade the
Chlorinated phenolic compounds may be removed from the environment by complete or
partial biodegradation or by biotransformation. Highly halogenated aromatic
compounds such as PCP are particularly resistant to biodegradation (McCarthy et al.,
1996). Biodegradation can be considered complete only when the carbon skeleton of
PCP is converted into intermediary metabolites and the chloride atoms are returned to
the mineral state (Reineke and Knackmuss, 1988). Biotransformation reactions, where
the carbon skeleton of the substrate remains unaltered, are alternative biodegradation
mechanisms (H=ggblom et al., 1988). Many biotransformation products resist aerobic
microbial attack and have a high potential for bioaccumulation. There may, however, be
compounds present in the degrading environment that contribute to the success of PCP
biodegradation, by adsorbing the PCP and it's degradation products, thereby mitigating
their toxic effects. The rate of PCP degradation is more rapid in soils with a high
organic matter content (Crosby, 1981).
Successful bioremediation of PCP is a function of three independent but interrelated
factors; contaminant, microorganisms and environment (Aislabie et al., 1997). The
concentration and distribution of PCP, the physiological and genetic makeup of the
microbial population and the environmental framework in which they are situated
control the success of bioremediation (Aislabie et al., 1997). These three factors are
combined in different ways to maximise the effectiveness of bioremediation for waste
treatment.
2.2.1 BIOLOGICAL TREATMENT TECHNOLOGIES
Biological treatment technologies for hazardous-waste management involve the
development of systems that use biological catalysts to detoxify, degrade, or accumulate
environmental pollutants (Fetzner and Lingens, 1994). Aislabie et al. (1997) have
characterised biological treatment technologies for contaminated soils and groundwater
into three main categories: 1) solid-phase biotreatment (landfarming); 2) in situ
biotreatment; 3) slurry-phase biotreatment (bioreactors). Laboratory evaluation of the
chemical, physical and biological characteristics of representative soils and waters from
other parameters critical to implementation of biological remediation is necessary
(Compeau et al., 1991). Biotechnological approaches which have been applied
successfully so far involve the development of bioreactors to deal with specific
contaminants and bioaugmentation, the addition of 'outside' microorganisms to sites
with the ability to degrade the target contaminant to cope with contaminated landfill
sites, industrial sites, and groundwater (Barnhart and Hyzy, 1993; Fetzner and Lingens,
1994).
2.2.l.l SOLID PHASE TREATMENT
Solid phase treatment involves the excavation of contaminated soil or treatment lagoon
sludge and mounding it either in an enclosure or on top of a liner (Litchfield, 1991).
Landfarming, composting and engineered soil cells also come under the heading of solid
phase treatment (Aislabie et al., 1997). The merits of solid phase treatment methods are
their cost efficiency and low cost, and they can be done on-site. Land farming is a solid
phase treatment where contaminated surface soil is treated on site using conventional
agricultural practices such as tilling, irrigation, and fertilisation. Composting is a
thermophilic treatment process combining contaminated soil with a bulking agent to
stimulate degradation. The static piles, or windrows, are not usually aerated or tilled but
are turned (mixed) at regular intervals but they may be artificially ventilated.
Engineered "soil cells" are a hybrid of landfarming and composting. The "cells" are
constructed as aerated compost piles to control physical losses of the pollutant by
leaching and volatilisation (Aislabie et al., 1997).
2.2.1.2 IN SITUBIOREMEDIATION
The pnmary concept of in situ bioremediation (ISB), or biostimulation, is that
indigenous bacteria in groundwater and subsurface soils can be induced to grow and
degrade the contaminant by augmenting some environmen~al factors that are limiting
growth and degradation. Biostimulation uses only the microbes already present in the
contaminated site (Barnhart and Hyzy, 1993) and is a bioremediation method where
microbial population. Indigenous organisms may be removed from contaminated sites
and returned as inocula, after enrichment and selection of adapted organisms, to the
contaminated site. These microorganisms are assumed to have adapted to the
contaminants and to their physical/chemical environment and these adapted organisms
will degrade the organic contaminants. However, degradation may be retarded when a
nutrient reaches a limiting concentration. In situ bioremediation is a natural, ongoing
process which is simply the stimulation of the indigenous microflora by the external
addition of the limiting nutrients, most often oxygen, to facilitate biodegradation
(Litchfield, 1991). Bioventing and biosparging are two other in situ bioremediation
technologies (Aislabie et al., 1997). The former is the process of supplying oxygen to
indigenous soil microbes in the unsaturated zone to stimulate the biodegradation of
organic contaminants (Aislabie et al., 1997). The latter is the technology of introducing
air (or other gases) beneath the water table to promote localised site remediation.
Organic constituents are removed by a combination of physical air stripping as well as
oxygen-enhanced in situ degradation (Aislabie et al., 1997). Vapourisation is a problem
and the hazardous material(s) needs to be trapped in scrubbers. These treatment
processes are the most cost efficient, relatively passive and treat soil and water
simultaneously, though there are extended treatment times and monitoring difficulties.
2.2.1.3 SLURRY-PHASE BIOTREATMENT
Bioreactors may be utilized to deal with chemical contamination in either the liquid or
solid phase or as a slurry. Bioreactors use suspended microbial growth or growth on an
fixed solid support (Litchfield, 1991). The inoculum can come from the contaminated
materials, an activated sludge treatment plant, pure cultures, or genetically engineered
micro-organisms. The addition of bacterial cultures to a contaminated medium is called
bioaugmentation and is frequently used in bioreactors and ex situ systems. The use of
genetically engineered organisms in the bioreactor is another option, however as there
are concerns about the construction and the environmental release of genetically
engineered micro-organisms, this is still at the laboratory stage in most countries
microorganisms known to be efficient degraders of the target contaminant (Barnhart and Hyzy, 1993).
These above three mam types of bioremediation technology are often applied m combination to suit the waste type, concentration and circumstance.
2.2.2 BIOREMEDIATION CASE STUDIES
Wood treating operations conducted at sites all over the world over a period of 60 years have resulted in soil and groundwater contamination with PCP. Solid phase biological treatment was selected as the technology of choice for the remediation of 30, 000 tonnes of wood treatment site soils from Minnesota. The soil contained PCP at concentrations of up to 3,000mg/l and was to be reduced to 150mg/1 (Compeau et al., 1991). A 3.25
hectare Land Treatment Unit (L TU) was designed and constructed to include all necessary provisions for watering systems and containment of excess water, security systems and equipment utilisation. The remediation was conducted as an aerobic process and based on previous experience and treatability study data. Concentrations of PCP up to approximately 1 OOOmg/1 were considered appropriate to treat in the soils present at this site (Compeau et al., 1991). Evaluations of microbial numbers and activity clearly demonstrated that the indigenous microorganisms in these soils were capable of PCP degradation, although a PCP-degrading inoculum was prepared in case microbial activity was diminished to unacceptable levels during treatment operations. Remediation required 13 weeks, although the calculation from the laboratory treatability work predicted a remediation time of 10-11 weeks in duration. Calculations and evaluation of the buffering capacity of the soil indicated that no application of alkaline material would be required during the bioremediation. A baseline sampling of the LTU soils was conducted and a starting concentration of 41 Omg/l of PCP was detected. In the case of PCP degradation in soil, the rate of degradation was dependent on PCP concentration. Within the range of PCP concentrations encountered in these soils, the rate of degradation increased as the PCP concentration increased to an upper limit of
Landfarming employing fungal cultures has been used to remediate soil contaminated
with PCP at concentrations ranging from 25 to 5000 mg/kg (Glaser and Lamar, 1995).
Excavated soil was mechanically sieved through a 2.5cm screen, mixed, and placed on
plots, 21m by 30m, to a depth of 25cm. The plots were inoculated with Phanerochaete
chrysosporium, and wood chips were added as a nutrient substrate to sustain growth of
the fungi. The plots were regularly tilled and irrigated. A 69% PCP reduction was
achieved for initial PCP concentration of lOOOmg/kg treated with Ph. chrysosporium
and an 89% PCP reduction for initial PCP concentration of 600-700mg/kg was achieved
with Phanerochaete sordida (Glaser and Lamar, 1995). Further studies with Ph. sordida
were conducted with soil contaminated with up to 5200mg/kg PCP. Contaminated soil
was diluted with clean soil to yield a PCP concentration of 1 OOmg/kg. Soils beds, 2 lm
by 30m, were inoculated with 10% (w/w) Ph. sordida and a 64% PCP reduction was
achieved (Glaser and Lamar, 1995).
Composting is another solid phase treatment that has been used for bioremediation of
PCP contaminated soils. Composting is a thermophilic treatment process combining
contaminated soil with a bulking agent e.g., bark and ash, to stimulate degradation. In a
large scale experiment on bacterial degradation of chlorophenols, using Rhodococcus
ch/orophenolicus, 100m3
of soil contaminated with up to 500mg/kg dry weight of
chlorophenols from around dipping basins of sawmills was excavated for composting
(Valo and Salkinoja-Salonen, 1986). There was no forced aeration of the windrows but
they were irrigated weekly. Conditions for the activity of chlorophenol-degrading
microbes were created in the field and these lead to 80% removal of chlorophenols
within 4 months (Valo and Salkinoja-Salonen, 1986). Addition of
chlorophenol-degrading bacteria to sterilised soil sped up degradation in the laboratory. Bark chips
promoted chlorophenol degradation by protecting chlorophenol degraders against the
toxicity of PCP, providing organic matter, maintaining the temperature and promoting
aeration in the compost. The bark chips were also suggested to serve as a source of
chlorophenol-degrading organisms (V alo and Salkinoja-Salonen, 1986). Over 90% of
PCP in soil containing 7-8% organic matter was degraded compared with no
Bioremediation of PCP contaminated soil by soil washing and the feasibility of a
bioremediation programme using a slurry phase bioreactor was tested by bench scale
biotreatability studies. The studies were performed to develop a microbial culture and
biodegradative process which could treat PCP at higher concentrations than previously
reported (Litchfield, 1991). Treatability studies were performed on soil samples for a
contaminated site with PCP concentrations of between 2mg/kg and 9000mg/kg, to
determine the efficacy of a slurry phase bioremediation process for these soils. The first
two weeks of the study showed little if any indigenous microbial degradative potential
in any of the various slurries tested. On day 13 each of the slurries received an inoculum
of the PCP consortium to yield approximately 1 x 10⁸
cells/ml of slurry. Inoculation
with the PCP degrading consortium resulted in the degradation of PCP to below
detectable levels (<l.Omg/l) as measured by HPLC (Litchfield, 1991). Data from
laboratory treatability studies were used to design and implement the full-scale
remediation process. The process involves soil washing to remove PCP from the soils
followed by bioremediation of the pregnant wash solution in a slurry-phase bioreactor.
The resulting wash solution was slurry treated on-site in slurry phase bioreactors which
had been inoculated with the PCP degrading consortium. Bench scale studies performed
before and during remediation supported the use of inoculation in enhancing the
degradation of PCP in slurry reactors (Litchfield, 1991).
2.2.3 PHYTOREMEDIATION AND ANAEROBIC BIOREMEDIATION
PCP not only contaminates the soil around wood treatment plants but also surface water
and wastewater from these sites is also contaminated and depending on the
hydrogeology of the site PCP can leach into groundwater. Many different approaches
have been explored for the removal of PCP from ground and waste-water. These
treatment methods (Tikoo et al., 1997) can be broadly classified as physical (adsorption,
foam flotation), chemical (oxidation, photodecomposition, ultrasound) and biological
(activated sludge process, anaerobic digestion, immobilised bacteria, cornetabolism).
Photolysis was deemed the fastest known PCP degradation mechanism in nature and
could lead to total mineralisation of PCP to C02 and c1· (Valo et al., 1985).
decades. The physical and chemical methods for treatment of waters contaminated with
PCP are expensive to implement and are not always efficient enough for complete
removal of the contaminant (Tikoo et al., 1997). Above ground bioreactors (AGB) have
since been used for groundwater bioremediation of PCP and have been applied
successfully. During a single passage through a bioreactor, 70% of the PCP m
contaminated surface water was removed, and greater than 99% of the PCP m
groundwater was removed over a period of four weeks (Litchfield, 1991).
Combined biotechnologies with chemical or physical treatment (Compeau et al., 1991),
phytoremediation, i.e. the use of green plants and their associated microbial
communities, (Anderson et al., 1993; Aislabie et al., 1997) and anaerobic treatment
processes (Fetzner and Lingens, 1994) are other bioremediation techniques that are not
commonly used.
Plant roots, in conjunction with their associated microbial communities, offer a
potentially important treatment strategy for in situ bioremediation of chemically
contaminated soils. This technique of bioremediation is known as phytoremediation
(Anderson et al., 1993). Under a variety of environmental conditions, vegetation has
been shown to enhance microbial degradation rates of organic chemical residues in soils
(Anderson et al., 1993). These findings are important because vegetation may provide a
low-cost alternative or supplement to expensive, capital-intensive technologies for soil
cleanup. Investigations of the fundamental mechanisms whereby rhizosphere microbial
degradation occurs would provide insights for applications of the plant-microbe system
for in situ remediation. The rhizosphere is a zone of increased microbial activity and
biomass at the root-soil interface that is under the influence of the plant root. This zone
is distinguished from bulk soil by this root influence. The overall effect of the
plant-microbe interaction is an increase in microbial biomass by an order of magnitude or
more compared with that of microbial populations in bulk soils. The common theme to
the literature on microbial degradation of herbicides in the rhizosphere is the possibility
that rhizosphere microbial communities are involved in protecting the plant from chemical injury. Microbial consortia, rather than individual microbial species, are likely
potential role of vegetation m facilitating microbial degradation for in situ
bioremediation of surface soils contaminated with hazardous organic compounds
(Anderson et al., 1993).
Anaerobic bacteria are not used for bioremediation as often as aerobic bacteria (Aislabie
et al., 1997) and studies on the anaerobic treatment of PCP, combining anaerobic
sewage sludge and bioaugmentation, resulted in the accumulation of less highly
chlorinated phenols as opposed to complete mineralisation of PCP (Fetzner and
Lingens, 1994). PCP was, however, able to be removed by anaerobic fixed film and
upflow anaerobic sludge blanket reactors, as well as in an anaerobic semicontinuous
-stirred tank reactor (Fetzner and Lingens, 1994). The fate of
[1
4C]PCP in flooded soil,
i.e. anaerobic conditions was investigated and different mechanisms of PCP
transformation were found (Fetzner and Lingens, 1994). A major part of the
radioactivity was incorporated into insoluble macromolecules, i.e., bound to humin and
humic acid (Fetzner and Lingens, 1994).
2.2.4 FEASIBILITY OF BIOREMEDIATION
Bioremediation is appropriate whenever it is certain that no toxic by-products will be
formed either biologically or abiologically, that there are microorganisms which can
degrade the contaminants, and that it is economical (Litchfield, 1991). To be certain that
more toxic by-products are not formed, it is helpful to know the metabolic pathways that
have been described based on studies of pure cultures and single compounds. Another
factor to consider in determining whether to use bioremediation is the availability of the
waste and it's concentration. The laboratory studies must involve testing the mixture of
contaminants at the in situ concentrations. The economics of the various bioremediation
options must be evaluated. Important factors include: time to develop the necessary data
base, length of time for the remediation, costs of construction, location of the
contamination in the soils or in soils and groundwater, the hydrogeology of the site,
location of the contamination in relation to site boundaries and surface structures, and