Rochester Institute of Technology
RIT Scholar Works
Theses
Thesis/Dissertation Collections
2006
An Evolutionary Computation Approach to
Optimization of Isoelectric Point Prediction in
Proteins
Chris Parkin
Follow this and additional works at:
http://scholarworks.rit.edu/theses
This Thesis is brought to you for free and open access by the Thesis/Dissertation Collections at RIT Scholar Works. It has been accepted for inclusion in Theses by an authorized administrator of RIT Scholar Works. For more information, please [email protected].
Recommended Citation
.~
~~
..
~.rfOrmatlcs
RIT
"
To: Head, Department of Biological Sciences
Rochester Institute of Technology Department of Biological Sciences Bioinformatics Program
The undersigned state that _ _ _ ~Co.!.hll.r.L=is!..!o.to~p.L.!h.l:=.e.!...r .!...P.!=!.aru.k;u.iu.n _ _ _ _ _ _ _ _ _ , a
candidate for the Master of Science degree in Bioinformatics, has submitted his/her
thesis and has satisfactorily defended it.
This completes the requirements for the Master of Science degree in Bioinformatics at Rochester Institute of Technology.
Thesis committee members:
Name
paul Craig
(Committee Chair)
Paul Craig
(Thesis Advisor)
Illegible Signature
Illegible Signature
Illegible Signature
Gary R. Skuse, Ph.D. Director of Bioinformatics
Date
Thesis/Dissertation Author Permission Statement
Title of thesis
or.disse~tion:
12
!£~~~f//£r;r
f/Xft
f
o3°
D1{t:s12ach
In
tJp
fun I Zahf!YJ
a
5'0 f-e
I 0Y1 0J'n
k
Name of author:
Chnsdoph<:c
1?uhlO
Degree:
13,
C ido
em IX -hie:>1I!ll'JV1S
~o~: ~S~g~\D~
______________________________________________ __
College:.s
ci
e.n (
e
I understand that I must submit a print copy of my thesis or dissertation to the RIT Archives, per current RIT guidelines for the completion of my degree. I hereby grant to the Rochester Institute of Technology and its agents the non-exclusive license to archive and make accessible my thesis or dissertation in whole or in part in all forms of media in perpetuity. I retain all other ownership rights to the copyright of the thesis or dissertation. I also retain the right to use in future works (such as articles or books) all or part of this thesis or dissertation.
Print Reproduction Permission Granted:
I, Christopher Parkin , hereby grant permission to the Rochester Institute Technology to reproduce my print thesis or dissertation in whole or in part. Any reproduction will not be for commercial use or profit.
Signature of Author: Christopher Parkin Date:
Print Reproduction Permission Denied:
L
,
hereby deny permission to the RIT Library of theRochester Institute of Technology to reproduce my print thesis or dissertation in whole or in part. Signature of Author: _ _ _ _ _ _ _ _ _ _ _ _ _ _ _ _ _ _ _ Date: _______ __
Inclusion in the RIT Digital Media Library Electronic Thesis
&Dissertation (ETD) Archive
L Christopher Parkin , additionally grant to the Rochester Institute of Technology Digital Media Library (RIT DML) the non-exclusive license to archive and provide electronic access to my thesis or dissertation in whole or in part in all forms of media in perpetuity.
I understand that my work, in addition to its bibliographic record and abstract, will be available to the world-wide community of scholars and researchers through the RIT DML. I retain all other ownership rights to the copyright of the thesis or dissertation. I also retain the right to use in future works (such as articles or books) all or part of this thesis or dissertation. I am aware that the Rochester Institute of Technology does not require registration of copyright for ETDs.
I hereby certify that, if appropriate, I have obtained and attached written permission statements from the owners of each third party copyrighted matter to be included in my thesis or dissertation. I certify that the version I submitted is the same as that approved by my committee.
An
Evolutionary
Computation Approach to OptimizationofIsoelectric Point Prediction in Proteins
Submitted
by
Chris Parkin
DepartmentofBiologicalSciences
Inpartialfulfillmentoftherequirements
fortheMasterofSciencedegree in
Bioinformaticsat
RochesterInstitute ofTechnology
Abstract
An
Evolutionary
ComputationApproachtoOptimizationofIsoelectric Point Prediction in Proteins
by
Christopher Parkin
MasterofSciencein Bioinformatics
Rochester Instituteof
Technology
Professor PaulCraig,Chair
Computational
biology
hasattackedtheproblem ofisoelectricpoint prediction withlittlesuccess, achievinga roughaccuracy levelofonly 30%. In2005,MatthewConteperformeda
study focused ontherelationship betweensequence characteristics andisoelectricpoint
prediction accuracy. Results indicatedthatchargesbetweenadjacent amino acids couldhave a
significantimpactontheoverall predicted pi fortheprotein. Inthis studyweintroduce an
evolutionarycomputation approach aimed ataccounting fortheseproblemdipeptides. Foreach
possibledipeptide
involving
charged amino acids(7chargeable groups->49possibilities), thealgorithm predicts apKavaluethat,whenincluded inthe pi predictionalgorithm,should resultin
a moreaccurate prediction.
By
accounting forthesecharged, adjacent aminoacids,thepipredictionshowedimprovements forthoseproteins withthegreatestdeviation between
experimentaland predicted pi value(Apl>0.7). However,theseresults were notgeneralized, as
theincorporationofthesevalueshadthereverse effect onremainingproteins,mostnotablythose
fromthemost accuratedataset(Apl<0.1). Whilethisresearchlaysafoundation for
improving
thepi prediction algorithm,additional exploration remainsnecessary foran overallaccuracy
Contents
1 Introduction 1
2 Methods 5
2.1
ExPASy
2DPAGE Database 52.2
Trimming
theDataSet 52.3
Training
&Testing
72.4 The Genetic Algorithm 7
2.4. 1 The Chromosome 8
2.4.2 Fitness 8
2.4.3 Tournament Selection 9
2.4.4 Crossover 10
2.4.5 Mutation 10
2.4.6 JavaClasses 12
3 Results 13
3.1 An Example GA Run 13
3.2 SuggestedpKaValues 13
3.3 Effectson piPrediction 16
3.3.1
Using
Apl<0.1 Data 163.3.2
Using
0.1 <Apl<0.3 Data 173.3.3
Using
0.3 <Apl<0.7 Data 183.3.4
Using
Apl>0.7 Data 193.3.4
Using
Complete Data Set 203.3.5 Overall Effect
Using
Apl<0.1 213.3.6 Overall Effect
Using
0.1<ApI<0.3 223.3.7 Overall Effect
Using
0.3<ApI<0.7 233.3.8 Overall Effect
Using
Apl>0.7 243.3.9 Average Apl Values 25
4 Discussion 26
5 Conclusion 31
Introduction
Two-dimensionalgel electrophoresis
(2DE)
firstemergedin 1975whenDr. Patrick O'Farrelldisplayedtheabilitytoseparate 1,100polypeptides from Escherichiacoli[1]. Withthetheory
andtechnique
being
slightlyahead ofits time,itwasinitially
practicedby
onlyahandfulofscientists aroundtheworld. Sincethen, theemergence of new analyticaltools, combined with
numerouslarge-scale,publicinformationdatabases,has shed a whole newlightonthis once
dormanttechnique [2]. Today, 2DEremains a
leading
techniqueforseparation andidentificationof proteins.
Isoelectric
focusing (IEF)
isthemainfocusofthis studyand makesupthefirst dimensionof2DE. IEFisa methodinwhich amphoteric molecules are separatedina polyacrylamide gel
accordingtotheirisoelectricpoint values[2]. Whenplacedina pH gradient,a protein will
migrateto theposition whereitsnet chargeisequaltozero. ThepHatthispositionisknownas
theisoelectricpoint
(pi)
value. Isoelectricpointis determinedby
charged groupsinthe protein,andis oftenbetween 3 and12,withmost
falling
between 4and7[1 1,12].TraditionaltechniquesusedtoformpHgradients involved mixingampholytesthathad been
chemicallyengineeredtoacertainpKavalue[13]. While thismethod workedefficiently,thepH
gradient wasextremely difficulttoreproduce. Sincethen, immobilizedpH gradients
(IPGys)
havebeen introduced. InanIPG, theampholytes areboundinacrylamidegel,
forming
afixedpH gradient andensuring reproducibility [8,13].
Theseconddimensionof2DE isa separation
by
molecular mass. Achargeis appliedtoabufferthat surroundsthe gel,attractingthemoleculestothe opposite end andcausingthem to
migrate. Thelargerofthesemoleculestravel the slowest and will remain nearthetop ofthegel,
whilethesmaller moleculeswilltravelfurtherandbeseentowardthebottomofthegel. After
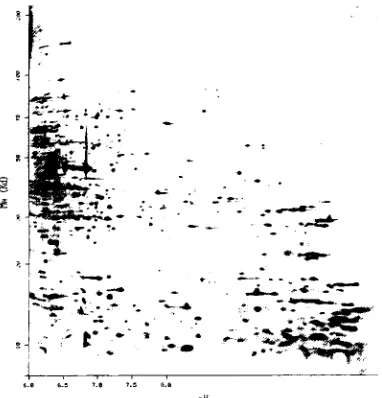
staining, theend result of2DEisa grid of spots with each spotreferringto thelocationof a
protein molecule inthegel(Figure 1). The Xvalueinthegrid corresponds to thepi valueofthat
protein,whiletheYvalue correspondstothedistancemigratedinthegel.
Theapplication ofthistechniquehasprovento
bea powerfultoolandhasprovided researchers
witha great amount ofdata [5]. However,the
difficulty
andtimerequirements associated withperformingand
interpreting
2DE correctly have ledtotheemergence of computational approaches to
2DE [5]. Whilethebenefitsassociated with
simulations are often quiteattractive, the
limitationsplaced uponthepi prediction portion of
the2DEsimulationhaveprovedtobetheAchilles
=
.
[image:8.531.39.230.230.429.2]-r
Figure 1. Sampleoutputfrom
2-Dimensional Electrophoresis. Obtained
from Swiss 2DPAGEdatabase,protein
ID#P16700[7,10]
heel oftheentire simulation.
The isoelectricpoint prediction algorithmtobeoptimizedinthisstudy ispart of a2DE
simulatorthatwas originally developedatthe RochesterInstituteof
Technology
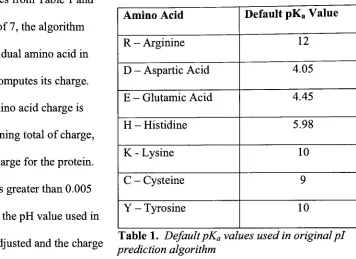
as part of anhonor'sthesisproject[3]. Thisalgorithmwasimplemented tocalculatecharge,basedonside
chains ofaminoacidsfoundinthesequence. Thecharge on each side chainis afunctionofthe
Amino Acid DefaultpKaValue
R- Arginine 12
D- Aspartic Acid 4.05
E- GlutamicAcid 4.45
H- Histidine 5.98
K- Lysine 10
C
-Cysteine 9
Y- Tyrosine 10
charge ontheaminoacid side chains isshownin Table 1
Using
thevaluesfrom Table 1 andstartingwith a pH of7,the algorithm
looksat eachindividual amino acidin
the sequenceand computesitscharge.
Eachindividualamino acid charge is
thenaddedtoarunningtotalofcharge,
resulting intotal charge fortheprotein.
Ifthe totalchargeisgreaterthan0.005
orlessthan-0.005, thepH value usedin
, , . ,. , , , , Table1. DefaultpKavaluesusedinoriginalpi
thecalculation isadmsted andthe charge ,.
, .f, J
prediction algorithm
calculationisrepeated. Thiscycle continues untilthe totalcharge isreportedtobebetween
-0.005 and0.005,practicallyzero. Finally,thepH valueresulting ina net charge of zero onthe
proteinisreturned, and consideredthepi value forthatprotein.Whilethe pKavalues are
heavily
relied oninthis calculation, variables such as post-translational modifications and charge-charge
interactions areleftunaccountedfor, significantly affectingpredictionaccuracy[3].
In2005,Matthew Conteperformed sequential analyses on numerousproteinsfromtheE.
coliproteome,obtained fromthe Swiss 2DPAGEdatabase[3, 7]. In
doing
so,heuncovered acorrelationbetweentheoccurrence ofchargeddipeptidesinthesequence andthelevelof
discrepancy
betweenexperimental and predictedpi,knownin his studyas well asthisone asApl[3]. Hisresults showedthat thehigherthenumberofcharge-chargedipeptides inthe sequence,
thegreaterthedeviationbetweenactual and predictedpi valueforthatprotein[3].
Thepicalculationisbasedonthe pKavalues fortheamino acid sidechains. Basedonhis
[image:9.531.127.483.76.335.2]results, ourhopewastoderivenewpKavaluesusing ageneticalgorithm. AsinConte'swork,
Escherichiacoli wastheproteome ofchoice. E. coliisthought tohave arelativelylownumber
ofpost-transcriptional
modifications suchasmethylation andphosphorylation,andit isone of
themostwidelystudiedbacteria inscience,making itanidealsubject[3]. Furthermore,
experimentalisoelectricpointdata fromonlyonegroupwasused,assuring consistency in lab
practicesanddatasubmission[3,9].
Nowa cornerstonein
biology,
evolution andtheunderlyingtheoryof natural selection areaccreditedtoCharlesDarwinafterhisresearchinthemid
19th
century [4]. Histheoryof natural
selectionproposedthatindividuals bestadaptedto theirsurrounding environment are more
likely
tosurviveand mate. Overtime,thosewiththeless-favorabletraitsdieout,while favorabletraits
are passedon,eventually
introducing
adaptationsintothepopulation.Evolutionary
computation modelslikethegeneticalgorithm(GA)
usedinthisstudyloosely
follow Darwin'stheories. Inthis case,eachindividual inthepopulation isa set ofpKavalues
usedtoaccommodatethecharge-charge amino acid pairsthatnormally hurttheaccuracyof pi
prediction. Ineachgeneration, themost well adaptedindividualsarethose thatleadto themost
accurate piprediction,and areknownasthefittestofthepopulation.
According
toevolution, thefittest individualsarethosemostlikely
tosurvive andmate, sothefittest fromeach generation automaticallysurvive intothenext. Overtime,simulated
processesofmutation,crossoverand recombination are appliedtoeachgeneration,resulting ina
population ofthebestpossibleindividuals. Further details regardingtheworkings oftheGA are
Methods
ExPASv 2DPAGE Database
The
ExPASy
server's Swiss2DPAGE database(http://ca.expasy.org/ch2d/) contains vast2DEgelinformationforhuman,mouse,Arabidopsis thaliana,Dictyosteliumdiscoideum,
Escherichiacoli,Saccharomycescerevisiae,andStaphylococcusaureus(N315))[7]. Foreach
proteininthedatabase,informationregardingexperimentalpivalue,molecularweight,
experimentalmethods, references, anda photo oftheactualgel runintheexperimentis
available[7].
Becausemanygroupshavecontributedto thisdatabase, it isnot uncommontofindmultiple
submissionsfor anyone protein. Forthatreasonandto
keep
experimental practices consistent,onlythoseentries fromTonellawere usedinthisstudy [9]. Forease ofuse, theSwiss 2DPAGE
allows fortheinformationtobe downloaded intoatab delimitedtextfiletobe importedtoa
spreadsheet14]. Thefields availableinthisfile include genename, description,Swiss 2DPAGE
accessionnumber, spotID,experimentalpi,experimental molecularweight,mappingmethods,
commenttopics and a referenceto thegroup carryingouttheexperiments.
TrimmingtheDataSet
After obtainingtheinitial Tonella datasetcontaining roughly 340proteins,itwas not
uncommonto seeupto eight entries for anyone protein. Again,duplicationsare a result of
post-translationalmodificationsthatcause a change inpI/MW onthe protein,
leading
toa unique spotonthegel. Becausemost oftheseduplicatepi values were quite similar(oftenwithin.01 of one
another), anaveragepi value wastaken torepresenttheproteininthe dataset,andtheremaining
duplicatesremoved. Inthe eventthat
drastically
differentpi values wererecorded, onlythefirstentrywas saved,andthatprotein wasomitted fromtrainingthegeneticalgorithmlaterinthe
study.
170proteins remainedafter allduplicateswereremovedfromthedata set,which werethen
broken into fourgroupsbasedonthedifference betweenexperimental and predicted pivalue,
knownas jpKO.l, 0.1<_pl<0.3, 0.3<_pl<0.7, and (Appendix A). Thegreatest
concern forthisstudywereproteinsfoundinthe and0.3<_pl<0.7datasets,with
expectationsthat
improving
thosepredictions wouldgreatly improvetheoverallaccuracy levelforthealgorithm. Fora complete
listing
oftheproteins used aftertrimming, seeAppendixA.Sequence
Gathering
All Swiss 2DPAGEproteinentries are cross-linked withthe Swiss-Protdatabase, making it
possibletoacquireFASTAformattedsequencethrough theNCBI Batch Entrezsearch[15]. To
usethistool,a simple listofthe 170protein accession numbers was uploadedto theNCBI,
which returnedall 170proteins in FASTA format. To easilyassociatetheexperimental pi value
withtheproteinsequence,each experimental value wasmanuallyenteredintothesecondline of
therespectiveFASTAfileofthatprotein. Thisresultedinonelarge FASTA formatted file
containingall 170proteins, completewith accessionnumbers, pKavalue andsequence. Aperl
scriptthenparsedthisfile and saved each proteinsequenceseparately,
basing
thefilename ontheprotein's accession number. Finally, another short program was writtentoreadinall 170
protein sequences and sortthemaccordingto thedifference betweenexperimental andpredicted
pi value. Alldata filesusedinthisresearchhave beensavedintoa compressedfolderandcanbe
obtainedathttp://www.rit.edu/~cdp3511/thesis/
Training
&Testing
DataAfterthisorganization wascomplete,eachdataset was runthrough the algorithminthe
following
manner. First,afolderwasmadetocontain"training
data,"which containedfourproteins chosenfromthedataset. Each oftheseproteins wasdeemedacceptable
(only
oneSwiss 2DPAGEsubmission perprotein)and was automaticallyreadfromthe
directory by
theGA,which requires
directory
name asinput. Thealgorithm wasthensettorunstartingwith arandomlygeneratedpopulation. After 80 generations onaverage, theideal set ofpKavalues that
resultedinthebestoverall pi predictionforthatdataset wasdisplayed.
Next,a similar run was carried out onfournewproteins,knownas
"testing"
data. This
time,the initialpopulation was seeded with a chromosomerepresentingthefittestvaluesfrom
thepreviousrun. Theoretically,ifthe pKavalues found intheprevious runleadtoanaccuracy
increase forthetrainingdata,theycouldbe expectedtomake a positiveimpactonaccuracy for
similar proteins fromthesameorganism. Again,theresults werecollected,comparedto the
original, andthe4proteinspreviouslyknownastestingdatawereaddedto thetrainingdata.
Alleight proteins werethenrun atonce, this time
being
seededwithtwochromosomes,onefromtheoriginaltrainingrun and onefromthefirsttestingrun. Theresultsfromthiswerethen
usedtoseedfournewproteinsthatbecomethetestingset. Thisprocess continueduntil all
acceptable proteins fromthedataset were a part ofthetraining data,givingthebestoverallpIQ
valuesforthatset.
The GeneticAlgorithm
Thegenetic algorithm,writtenintheJavaprogramming
language,
wasthedriving
forcebehindthisproject. Aspreviously
indicated,
the GAissetuptoloosely
simulate evolution andfollows Charles Darwin'stheoryof"survivalofthefittest". Asmentioned, theoriginal
predictionalgorithm stepsthrough the sequence,
looking
atone aminoacid at atime. Inthefollowing
sections, theideas and codebehindthealgorithm areexplained.TheChromosome
Thefirststep in any GAisto
develop
aninitialpopulationof what are calledchromosomes[4]. Achromosomeis an objectrepresentingtheparameters usedto optimizethe
problem athand. Forthepurposes ofthisexperiment, a chromosome couldbe definedas an
arrayof
binary
integervaluesthatrepresentpKavalues,one foreachdipeptideofinterest. Forexample,ifwe wantedtorepresent an arginine whenitoccurs nexttoanotherarginine,or an
argininenexttoan aspartic acid(astheymight occurintheproteinsequence), thearraymight
holdvaluessuch as "001
1"
or"0110". Whenconvertedtointegers,these
binary
strings equal"3"
and"6",which wouldbecometherespectivepKavalues associated with"AA"and"AD"in
thatchromosome.
Eachchromosomethenholdstheentire set ofpKavalues usedtooptimizethepi prediction
algorithm. The initialpopulationis obtained
by
usinga random numbergenerator,providinganumberbetween 0 and 14inclusive torepresenttorepresent eachpIQvalue.
Fitness
Aftertheinitialgenerationisinplace,each chromosomeistestedforwhatis knownasits
"fitness."
Asnoted, each chromosomeholdstheparametersthatareutilized intheprediction
algorithm, outputtinga predicted pi value. Inthis experiment,achromosome'sfitnesscanbe
definedastheaveragedifferencebetweentheexperimental andpredictedpi valueforeach
protein
being
tested. Therefore,ifwehave 100chromosomesand aretestingon a setof10proteins, thatmeansthatforeachgeneration, thefitnessvalueiscalculated 1,000times.
Testing
ontheentiredataset means 100chromosomestestedon 170 proteins,for 17,000calculationsper
generation.
Foundinthefitnessfunction,thepi prediction algorithmis simplytheoriginalalgorithm,
modifiedtolookattwoamino acids at atime. Forexample, theoriginal algorithm would see a
"K"
inthesequenceand assignitapKavalueof10. Instead,themodified algorithm seestheK
andthencheckstheamino acid
immediately
following. Ifit isan amino acid with a charged sidechain, like arginineforexample, thefunctionlooks atthecurrent chromosome and extractsthe
correspondingpKavalueforK-R, and assignsitto K. After
doing
so, thealgorithm steps aheadone spot and seestheR, andthenrepeatstheprocess. Theoverallfitnessthendepends onhow
welltheparametersfound inthechromosomework,orhowclosetheresultingpi prediction ends
up
being
to the experimental pi.Afterall chromosomesinthegenerationhave beenassigned afitnessvalue,theyare sorted.
Thetop5% fittestchromosomes are called
"survivors,"
and areautomaticallyplacedinthenext
generation. Remainingchromosomes are choseninpairstorepresentparents, andtheyare
matedtoproducetwonew offspring.
Tournament Selection
Themethod
by
whichchromosomes are chosenfor mating is knownas a"tournament"selection.
Many
variations oftournamentselectionexist,withthechosen methodmostlybeing
personal preference. Inthis case, the tournamentselection starts out
by
selecting 4chromosomesatrandom, excludingthe surviving 5%. Fromthefourselectedchromosomes,thetwowiththe
bestfitnessvalues are mated
by
crossover. Forexample,considerthefollowing
parentParentA= 1010 1100 0011 0101
ParentB=1111 0000 1 100 001 1
Now, considerthepossiblechildrenresulting froma cross ofParentAand ParentB:
ChildA=
1010 1000 1 100 001 1
ChildB= 1111 0100 0011 0101
Noticetheeffectsthat thiscrossoverhadonthesecondpKavalues forthesechromosomes.
Initially,thesecondpKavaluelistedin ParentAhada value of"1100"or 12, whileParentB was
"0000"
or0.
Following
the crossover, ChildAhas"1000"or8while ChildBhas "0100",or4.By
implementing
this typeofcrossover,as well asintroducing
random mutation ofindividualbits,
numerousvariations canbequicklyintroducedintothe population,simulating evolution(seethesections on crossover and mutationformoreinformation). Thetournamentselection
repeats,againselecting fourchromosomes at random andmatingthefittesttwo, untilthenew
generation containsthedesiredamount of chromosomes(defaultsetto 100forthisexperiment).
Crossover
To
keep
thematingprocessunbiased, crossover and mutation wereboth implementedrandomly. Asmentioned, a crossoverrequirestwoparentchromosomes,and results inthe
creationoftwooffspring. First, a crossover pointis determinedusinga random number
generator. BecauseaChromosomeobjectis actuallyanarrayof
binary
strings, thisdeterminationmustactually be done intwosteps:
1. Randomlyselectanindex intheChromosome arraytosetthecrossover pointin. This
shouldbea numberfrom 0-24inclusiveandpointstoonefour bitpKavalue.
2. Withinthestringselected atthatindex,choose a pointtocrossover. Each string hasa
Afterthecrossover pointis selected, thecrossoveriscarriedout aspreviouslydemonstrated,
with secondhalfofone chromosome addedto thefirsthalfofthe other, and vice versa.
Mutation
Mutationsaresimplyanotherwayto introducevariationintothepopulationand occur
roughly 5%ofthe time. Although different fromthe crossover, theyworkina similar manner.
Afterthetworandom selections aremade, theselectionissimplyflipped from0to 1 or 1 to
zero.
Forinstance:
ChromosomeAbeforemutation= 1001 1011 0011 0101 0111
IfChromosomeA wastobe selectedformutation andthe second positioninthe array, third
positioninthatstringwereselected,themutation would endupasfollows:
ChromosomeAafter mutation= 1001 1001 0011 0101 0111
The resultingChromosomehasgonefrom
having
apKavalue of 1 1 inthesecond positiontoone
having
apKaof9,which couldhaveasignificantimpactonthe overall pi prediction.Mutationoffitchromosomes couldhaveadetrimentaleffect on overallpopulationfitness. To
avoidthisproblem mutation rates arekeptlow,nohigherthan 5%.
Inadditionto automatically
being
placedintothenextpopulation,thefittestchromosomesare saved after eachgeneration. Ifafter apre-determinednumber ofgenerations(always
between50and 150inthisstudy), thefittestchromosomehasnotchanged,thatfitnessis
determinedtobethebestpossibleunderthoseconditions, andthe correspondingpKavalues are
returned.
JavaClasses
Containing
roughly 800lines of code(commentsincluded),
theprogram consisted ofthreeclasses, theGeneration class,theChromosomeclass, andtheEvolveclass. See Table 1 foran
explanation of each ofthe threeclasses andtheimportantfunctionswithinthoseclasses.
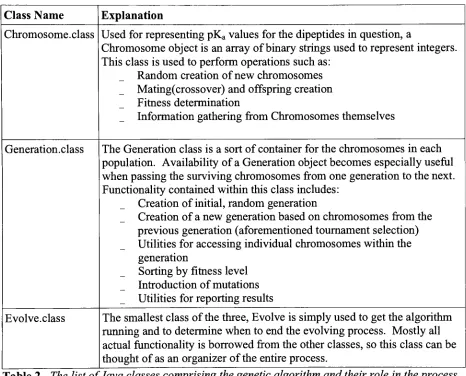
Class Name Explanation
Chromosome.class Used for representingpKavaluesforthedipeptidesinquestion, a
Chromosomeobjectisan arrayof
binary
strings usedtorepresentintegers.Thisclassisusedtoperform operations suchas:
Randomcreation of new chromosomes
Mating(crossover)andoffspringcreation
Fitness determination
Information gathering from Chromosomesthemselves
Generation.class The Generationclassisasort of containerforthechromosomesineach
population.
Availability
ofaGenerationobjectbecomes especiallyusefulwhenpassingthesurvivingchromosomes fromone generationto thenext.
Functionalitycontained withinthisclassincludes:
Creationofinitial,randomgeneration
Creationof a new generationbasedon chromosomes fromthe
previous generation(aforementionedtournamentselection)
Utilitiesfor accessing individualchromosomes withinthe
generation
Sorting
by
fitness levelIntroductionof mutations
Utilitiesfor reportingresults
Evolve.class The smallestclass ofthethree,Evolveis simplyusedtogetthealgorithm
runningandtodeterminewhentoendtheevolvingprocess.
Mostly
allactual
functionality
is borrowed fromtheotherclasses, sothis class canbe [image:18.531.33.499.172.548.2]thoughtof as an organizer oftheentire process.
Table 2. ThelistofJavaclassescomprisingthegenetic algorithm andtheirrole intheprocess.
Theprevious section gives an overallideaofhowthegenetic algorithm works. Forthe
Results
An Example Genetic Algorithm Run
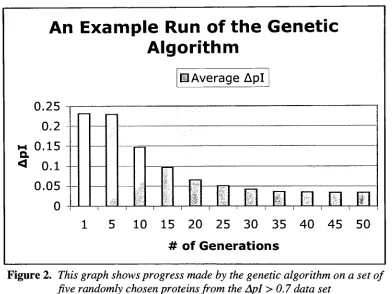
Figure2 showstheprogress made
by
a genetic algorithm when run on a set offive proteins. This is onlymeanttodisplay
themannerinwhichtheGAarrivesatitsconclusion,and doesn'tdirectly
correspondtothefinalresults.An Example Run
ofthe
Genetic
Algorithm
H Average Apl
0.25
0.2
h 0.15 Q. < 0.1
0.05
0
5 10 15 20 25 30 35 40 45 50
[image:19.531.73.465.256.550.2]# of Generations
Figure 2. Thisgraph shows progress made
by
thegenetic algorithm on a setof fiverandomlychosen proteinsfrom theApl>0.7 datasetThefiveproteins wereselected at randomfromtheApl>0.7 datasetforuseinthis
example. Typicalof mostGAruns, the algorithmmakesquickimprovements early inthe run,
seenhere ismost
likely
anindicationthat theunderlyingtheoriesbehindtheGAneedtobestrengthened.
Inthis example, thealgorithmwas allowedtorunfor 50generations withoutany
improvementonthetopfitnessvalue. Great improvementscanbenotedfortheproteinsinthis
example, astheAplvalues wentfrom
being
over0.7on averagetohaving
an averageAplof0.03. Unfortunately,resultsliketheseareuncommonwhenusing alargernumberof protein
sequences.
SuggestedpKaValues
Thegenetic algorithm was run onfour differentproteindata setsbefore
being
run onthecompleteEscherichiacolidata. Eachofthefoursets correspondedtoadifferent levelof
discrepancy
betweenexperimentaland predicted pi values(Apl),andtheresults oftheseruns areshownbelow in Table 3.
Dipeptide Pair I)ata Set UsedlinGA
Apl<0.1 0.1<Apl<0.3 0.3 <Apl<0.7 Apl>0.7 C()mplete
HH 6 12 13 7 1
HK 5 5 3 3 3
HR 1 8 7 10 13
HE 1 11 3 5 3
HD 13 9 7 12 12
HC 9 9 1 11 13
HY 10 8 5 11 12
KH 11 3 6 13 1
KK 5 14 11 1 9
KR 11 12 14 13 12
KE 7 13 1 3 13
KD 14 5 1 10 5
KC 11 14 11 14 14
KY 11 14 5 13 14
RH 12 7 1 1 7
RR 7 11 8 10 5
RE 12 9 9 13 14
RD 9 14 10 10 14
RC 1 1 7 12 9
RY 13 11 5 10 12
DH 5 12 1 13 5
DK 11 1 9 3 1
DR 3 5 5 11 1
DE 3 8 5 3 7
DD 5 1 3 5 5
DC 7 14 3 13 3
DY 5 3 13 3 12
EH 11 1 1 1 1
EK 3 1 2 3 1
ER 5 5 5 3 5
EE 3 3 5 5 7
ED 5 3 6 11 5
EC 13 3 1 1 5
EY 1 10 11 1 1
CH 6 3 3 1 1
CK 11 7 5 3 1
CR 5 9 9 3 3
CE 7 8 1 8 7
CD 3 13 1 10 12
CC 5 1 5 7 10
CY 9 1 3 13 7
YH 13 1 12 13 13
YK 8 13 14 11 12
YR 11 3 1 13 1
YE 12 14 8 1 1
YD 5 9 13 10 10
YC 14 1 13 10 9
YY 12 14 1 13 11
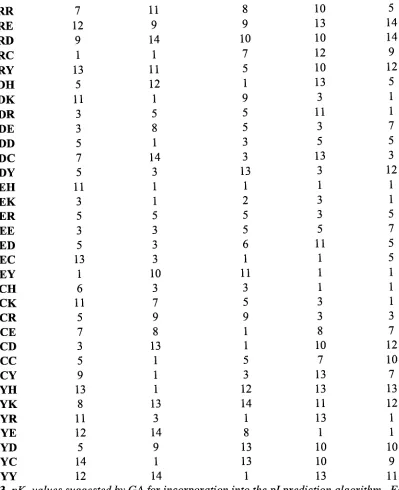
Table3.pKavalues suggested
by
GAforincorporationintothepi predictionalgorithm. Each column showsthevaluessuggested when usingthedatasetindicated.Eachcolumn representsthepKavaluessuggested
by
the geneticalgorithm whenrunningon adifferentset ofdata. Forinstance,thefirstcolumn ofdatarepresentsthefittestchromosome
fromthe GArunsusingproteins assignedto theApl<0. 1 dataset. Whenusedinthepi
[image:21.531.68.467.38.528.2]predictionalgorithm, thesedipeptidepKavaluesresultedinthehighest averageaccuracy level
forthatgroup.
Atfirstglance,thereare certain aspects ofTable 3 thatstandout as problem areas. Most
notableisthe
inconsistency
whencomparingone columnto thenext. Anumber oftimesa valuesuggestedforuse fromonedatasetisverydistant fromthatfromanotherdataset. Forexample,
theGA suggested apKavalue of6 for histidinewhenitoccurs nextto anotherhistidine inthe
Apl<0.1 dataset.
Moving
acrossto the0.1 <Apl<0.3column, the value suggestedforthesamedipeptidepairismuchhigher,at 12.
In addition, some ofthevalues suggested
by
the algorithmdon't entirelymake sense.Aspartic Acidhasadefaultvalue of4.05,buthas suggestedpKavalues upwards of13 fromthe
genetic algorithm. Ashift ofthismagnitude seemsimprobableandisevidencethat thefitness
functionassociated withthisGA mayneed alteration. Alone, thisinformation has littletosay
abouthoweachsuggesteddipeptidepKahas affectedtheaccuracyof pi prediction. Inthe
following
series ofgraphs, thesuggestedpKavalues from Table 3are puttothe testwhenthenewAplvalues are comparedto thoseoftheoriginal pi prediction. Again, thedifference
betweentheoriginal and new algorithmsisthe incorporationofdipeptidepKavaluesthatwere
expected tohavea positive effect ontheoverall prediction accuracy. Forcompleteexcel
Effectson piPrediction
UsingApK 0.1 Data Set
Effects of Modified Algorithm on Apl < 0.1 Data Set
-Apl Using Original Algorithm Apl Using Modified Algorithm
0.40
0.35
0.25
0.
0.05
&
<&^
^
& ^
4> <$&
(#4*
&
#V
^
< <
9 <" < <y <*'
<r <?v <?
<r <P < <$r <r*
<? < <5r <2V <3r <r
Protein Accession #
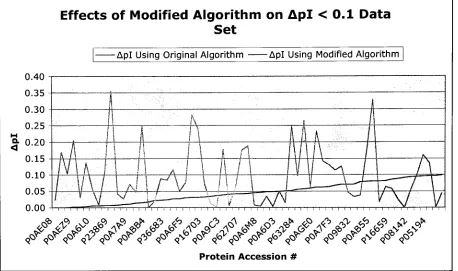
Figure3. A comparisonofApl beforeand afterthe incorporationofdipeptidepKa valuesinto
theprediction algorithmfortheApl< 0.1 data. UsingpKavalues suggested
by
theGAfortheApl<0.1 dataset, the pink,jaggedlineshowsAplvalues whenusingthemodified algorithm.
Theblue linecorrespondstoAplvaluesforthesame protein set when usingthe original,
unmodified algorithmforprediction.
Furtherevidenceis found in Figure3, where we see a clearindicationthatnot all proteins
werepositivelyaffected
by
thenew prediction method. Theblue,graduallyincreasing
linerepresentstheAplbeforeaddition ofdipeptidepKavalues andthejagged,pinklineshowsthe
new
discrepancy
levels. Whilesomeimprovements canbe seen(wherethepinkline dips below [image:23.531.42.500.182.453.2]the
blue),
themajorityoftheresults showa negative impactonprediction, especially inthoseproteinsthatpreviouslyshowed a
fairly
high levelof accuracy. Toexplaintheincreasing
natureoftheblue line inFigure 3 andthefiguresto follow isverysimple. Priortocreatingthese
graphs, theproteinswere sorted
by
theoriginalAplvalues,which were calculatedusingtheoriginal pi predictionmethod.
Using
0.1<ApI< 0.3 Data SetEffects of Modified Algorithm on
0.1 < Apl < 0.3 Data Set
-Apl Using Original Algorithm Apl Using Modified Algorithm
0.7
0.6
0.5
m 0.4
o.
0.3
0.2
0.1
r
A. / ^-A
-"
wrr
v
V
1 i i \ i i r
J
^
<$^
J> jf>
tf
$>^
$>tf
J? J>J? JP
&
^
</ <//
</ </4?/
^ ^
/
/>*
^ ^
</^
</ Protein Accession #Figure 4. Acomparisonofpibeforeand aftertheincorporation of dipeptidepKavaluesintothe
prediction algorithmforthe0.1<pl<0.3 data. UsingpKavalues suggested
by
theGAforthe0.1<ApI<0.3dataset, the pink,jaggedlineshowsAplvalues whenusingthemodified
algorithm. The blue linecorrespondstoAplvaluesforthesame protein set whenusingthe
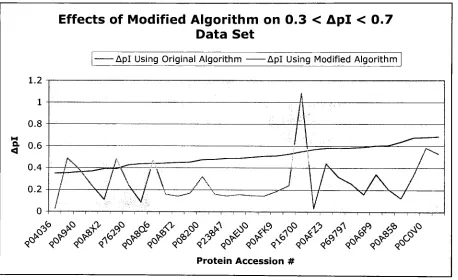
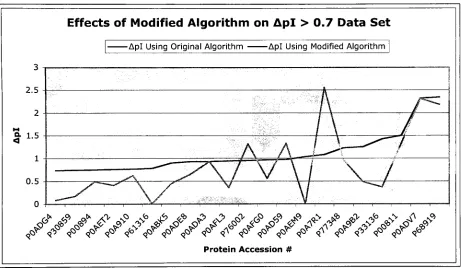
[image:24.531.43.496.233.510.2]Similarresults are found inFigures4, 5 and6,showingbothpositive and negative
impactson prediction accuracy. However, it becomes clearthat thedatasets with greater
discrepancy
levelsgenerallyyieldagreater overallimprovementon prediction accuracy.Considerthecomparison ofFigures 3 and6. On onlythreeoccasionsdidthenew prediction
accuracy decrease fortheApl>0.7 dataset(Figure 6),whereasthenegativeimpacts seemto
outweighthepositivefortheApl<0.1 data. Thethemecanalsobeseenin comparing Figures 3
and5,wherethereisanaccuracy on allbut fourproteinsinthe0.3<Apl <0.7 data set(Figure
5).
Using
0.3<ApI< 0.7 Data SetEffects of Modified Algorithm on 0.3 < Apl < 0.7
Data Set
-Apl UsingOriginal Algorithm -Apl Using Modified Algorithm
1.2
0.8
0.6
0.4
0.2
1
(\
r\
/ . f, '
\
/vr
A
/
~VT\
\ / \A
A
J
/N
A
A
/
/
/
/
j i r 1 1 1 r
v
r i i ~i 1 1
r-i 1 r -^
i/
V
X
x/
s>
^
J?
<f^
,<& <&
4>
#
#
<? <& <o
^
<f&
<$/
^
/> #*</
/>
^
/>^ / / / /
/> />^
Protein Accession #
Figure 5. Acomparisonofpibeforeand aftertheincorporation ofdipeptidepKa valuesintothe
prediction algorithmforthe0.3<pl<0.7data.
Using
pKa values suggestedby
the GAforthe 0.3<ApI<0.7dataset, the pink,jagged lineshowsAplvalues whenusingthemodified algorithm.Theblue linecorrespondstoAplvaluesforthesame protein set whenusingtheoriginal,
unmodified algorithmforprediction.
[image:25.531.42.500.288.568.2]Using
Apl>0.7 Data SetEffects of Modified Algorithm on Apl > 0.7 Data Set
-AplUsingOriginal Algorithm -Apl UsingModifiedAlgorithm
2.5
31-5
0.5 _r^XX_
^\tv
\
/
-.
_
rl ? o,*1
<> -^ \b ^ *
i? ^ o^
f? ^ i1 > i<%
^ 41
*-> AA -v>
> S? <? ^
oSP fV ^ ^ -^ (^ /\< q\?
^ ^
^ /\V y<V CS^ ,^ (^ProteinAccession # />
^
^VV"<r>v<*V<r^ 4?<f4?4^4^ 4?^'4?^>>^4*Figure6. Acomparisonof Apl before and aftertheincorporation of dipeptidepKa valuesinto
theprediction algorithmfortheApl>0.7data. UsingpKa values suggested
by
theGAforthe Apl>0.7dataset, the pink,jaggedlineshowsAplvalues whenusingthemodified algorithm.The blue linecorrespondstoAplvaluesforthesame protein set whenusingthe original,
[image:26.531.37.498.201.469.2]Using
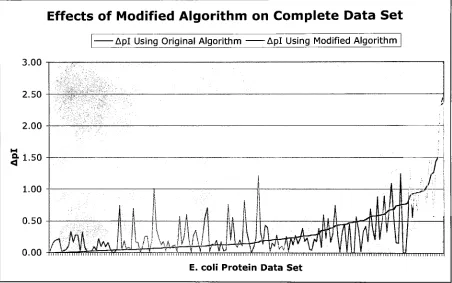
Entire E. coliDataSetProceeding
theGArunson each ofthefourpartialdatasets, thebestchromosomefromeach run was usedtoseed onelastrunonthe entireE. colidata, andthose suggestedpKavalues
were pluggedintothealgorithm. Theresults ofthisrun are showninFigure 7. Again,itis
evidentthatmostimprovements cameforthoseproteins withhigh Aplvalues,whilethe
modifiedalgorithm faltered forthemore accurate proteins.
Effects of Modified Algorithm on Complete Data Set
AplUsing Original Algorithm Apl Using ModifiedAlgorithm
3.00
2.50
2.00
a 1.50
1.00
0.50
0.00
FT
; i.X ' [ T'
1 1 11 1 1 1 11 1m 1 1 1 1 1 1 1 1ifII 1 1 M 1 1 1 1 M 1 1 1'l u 1 1 1 1 N l
E.coli Protein Data Set
Figure 7. AcomparisonofApl beforeand aftertheincorporation ofdipeptidepKa valuesinto
theprediction algorithmforthecompleteE. colidata.
Using
pKa values suggestedby
theGAfortheentiredataset, the pink,jaggedlineshowsAplvalues whenusingthemodified algorithm.
Theblue linecorrespondstoAplvaluesforthesame protein set when usingthe original,
unmodifiedalgorithmforprediction.
[image:27.531.43.495.264.547.2]Furthermore,
theentiredataset was usedtotest themodified algorithm whenincorporating
pKavaluesfrom theApl<0. 1, 0. 1 <Apl <0.3, 0.3<Apl A 0.7 andApl>0.7 datasets andthe
correspondingresults canbe found infigures 8, 9, 10, and 11. Again,theinaccuraciestend to
overshadowthepositive effectshadon piprediction.
EffectsonEntire E.coliData Set
Using
Values Predicted inApl< 0.1 DataEffects of Modified Algorithm on Complete Data Set
Using
Values Suggested from ApKO.l Data-Apl UsingOriginal Algorithm -Apl Using Modified Algorithm
3.0
2.5
2.0
M
*
1-51.0
0.5
0.0
Proteins in E.coliData Set
f
i
k
I I
i
1
,1 1! A ft ,
Ml
I
I
I
1 iiinrd-
M
/ Mil/, , i, ft
d
a1
'vimVl i
--,
ir^m ii >i i. r i
Figure8. Acomparisonof Apl beforeand afterthe incorporation of dipeptidepKa valuesinto
theprediction algorithmforthecompleteE. colidata. UsingpKa values suggested
by
the GA fortheApl<0.1 dataset, the pink,jaggedlineshowsAplvalueswhenusingthemodifiedalgorithm. Theblue line correspondstoAplvaluesforthesame proteinset whenusingthe
[image:28.531.41.494.185.438.2]EffectsonEntireE. coliDataSet Using Values Predicted in O.K Apl<0.3 Data
Effects of Modified Algorithm on Complete Data Set
Using
Values Suggested from 0.1 < Apl < 0.3 Data-AplUsing Original Algorithm Apl Using Modified Algorithm
3.00
2.50
2.00
S-1-50
1.00
0.50
0.00
wmUaM
II1 1 1 1 1 11II l'1'l11 11 1A
rrfc
W-A
i ii ii i ii ii i ii minn iriiriiiiiflrrriTiTHTivirn^rfrn'ifirHniTiTiTiTHrniTiTrrTTii umuiiiiu nuMiininiiiiriiniMiiiMiiinnrr 1 10 19 28 37 46 55 64 73 82 91 100 109 118 127 136 145 154 163
Proteins in E.coli Data Set
Figure 9. Acomparison of Apl beforeand aftertheincorporation of dipeptidepKa values into
thepredictionalgorithmforthecompleteE. colidata. UsingpKa values suggested
by
theGAforthe0.1<ApI<0.3dataset, the pink,jaggedlineshowsAplvalues whenusingthemodified
algorithm. The bluelinecorrespondstoAplvaluesforthe same protein set whenusingthe
original, unmodifiedalgorithmforprediction.
[image:29.531.39.498.193.507.2]EffectsonEntire E. coliData Set
Using
Values Predicted in 0.3<Apl<0.7 DataEffects of Modified Algorithm on Complete Data Set
Using
Values Suggested from 0.3<ApI<0.7 DataApl Using Original Algorithm Apl Using Modified Algorithm
3.0
2.5
2.0
- 1 5
1.0
0.5
0.0 rT-rr't'im-^^'i!rTr triii'viti'itittitiii'i i imi
_S ILL
\ .A/IS iTTl
n Ink / /
li ml l ii i il i ii i ii in i liili li ii i ill li i ii i in il i ii l li i li 1 1 ll i li ill i li i il l ii l li i iiiill i ii i ii i ill il ill l li l
Proteins in E. coli Data Set
Figure 10. A comparisonof Apl beforeand aftertheincorporationofdipeptidepKa valuesinto
theprediction algorithmforthecompleteE. colidata. UsingpKa values suggested
by
theGAforthe0.3<ApI<0.7 dataset, thepink,jaggedlineshowsAplvalues whenusing themodified
algorithm. The blue line correspondstoAplvaluesforthe same protein set whenusingthe
[image:30.531.37.501.139.450.2]Effects onEntire E. coliDataSet
Using
Values Predictedin Apl >0.7 DataEffects of Modified Algorithm on Entire Data Set
Using
Values Suggested from Apl>0.7 DataApl Using Original Algorithm Apl Using Modified Algorithm
3.00
2.50
2.00
1.50
1.00
0.50
0.00
u
fmMuMum
iiiniiiiii'iiiiiii
-H
Proteins in E. coli Data Set
Figure 11. AcomparisonofApl beforeand aftertheincorporation of dipeptidepKa values into
theprediction algorithmforthecompleteE. colidata. UsingpKa values suggested
by
the GAfortheApl>0.7 dataset, the pink,jaggedline showsAplvalues whenusingthemodified
algorithm. Theblue linecorresponds toAplvaluesforthesame protein set whenusingthe
original, unmodified algorithmforprediction.
[image:31.531.38.499.169.474.2]Asanalternativemethodfor
displaying
these results,averageAplvalues foreachdatasetare shown in Table 4. Althoughthe overallaccuracyappears tohave decreasedslightly,from
0.31 to0.33 onaverage, theaverageAplvalue was decreased
by
about0% inthe0.3 <Apl<0.7dataset,and
by
roughly30% forproteins intheApl>0.7 set. Whiletheproblem of predictionaccuracy clearlystillremains, theseresultsmay beastepintherightdirection.
[image:32.531.118.424.298.522.2]Average Apl Values BeforeandAfter
Table 4 showstheaverageAplvaluesforeachdatasetbeforeand afterincorporationof
dipeptidepKa values intheprediction algorithm.
DataSet Original Avg.Apl Modified Avg. Apl
ApKO.l 0.0455 0.0970
0.1<ApI<0.3 0.18 0.17
0.3<Apl<0.7 0.5060 0.2782
Apl> 0.7 1.1148 0.8403
Complete Set 0.3069 0.3340
Complete Set
Using
ApKO.l Values 0.3069 0.3583
Complete Set
Using
0.1<ApI<0.3 Values 0.3069 0.3793
Complete Set
Using
0.3<ApI<0.7 Values 0.3069 0.3627
Complete Set
Using
Discussion
Overall,itappearsthatour
learning
algorithm wasn'tcompletely effectiveinimproving
onisoelectricpoint predictioninproteins. Whileonecan onlyspeculateastoexactly whythe
resultsappeared asthey did,oneideawasthat thetrainingdataset wasinsufficient fortheGAto
produce reasonable results.
Totest thistheory, afinalexperimentwas performedthatis knownas a
"leave-one-out"
approach. This approach addressesthetrainingset problem
by including
allbutone proteininthetrainingdata. Forexample, inadatasetthatcontains 170proteins, thefirst GAtrainingrun
includedprotein#s 2
-170, while protein#1 was setaside asthetestingdata. After collecting
pKa valuesfromtheGArun onthetraining data,thosevalues wereincorporatedintothepi
predictionalgorithmto test theireffectson predictionforthetesting data,or protein#1. This
information,
including
experimentalpivalue,predictedpivalue,and predicted pi valuefromthemodified algorithm,wasthenrecordedintoatable.
After recordingthedata,protein#1 wasputbackintotheset of proteins and protein#2
was removed and set aside asthetestingdata. AgaintheGAwas run and results were collected
and recordedastheywereinthefirstrun. Next,protein#2was re-introducedintothedataset
and protein#3 was removed andsetaside,andthisprocess wasrepeatedover and over. When
each ofthe 170proteins inthedatasethadat onetimebeen setasideastestingdata,the
experiment was complete. Thenextstepwastocompare averageAplvaluesoftheoriginal and
modified pi prediction algorithms.
Using
theoriginalprediction algorithm, theaverageApl was0.31.Using
theleave-one-outapproachtooptimizethepi predictionshowedasignificantdecrease inaccuracy,ending up with
anaverageof0.47. Whilethiswasn'ttheresultthatwashopedfor,it isconsistentwith results
fromtheprevious experimentwhere we were unabletoimproveon overall prediction accuracies
forthecompletedataset.
Vastpossibilitiesexist forexpandingonthisworkinan attemptto significantlyimprove
our pi prediction algorithm. First,cuttingdownthe listofdipeptides inthechromosome might
makethegenetic algorithm more efficientinitsresults. ThroughouttheGAruns,itbecame
clearthatchromosomescontaining notablydifferentpKavalues could oftentimes resultin very
closefitnessvalues. Ifthosedipeptidesweregreatly
impacting
thepredictionalgorithm,wewould expecttosee consistent results. Instead,theinconsistenciesmightindicatethat the
charges onthesidechainsoftheseadjacent amino acidsdonot affect one anothertoalarge
extent, inwhich casetryingto accountforthemmay actually hurtprediction accuracy. The
studytoaccomplishthismightincludea comparison of sequence characteristicsbetweenthe
positively andnegativelyaffected proteins.
By
narrowingthesearch space inthis manner, thechances of
having
a positive effect withoutthenegative repercussions shouldincrease.Anotherproblem area inthisstudyandpossibility forfurtherresearch mightinvolve
limiting
how farthesuggestedpKavaluesare allowedtodeviate fromthedefault. As previouslymentioned,someofthe pKavalues were morethandoubledinthemodified predictionalgorithm.
To illustratethis problem, we might considerany randomly chosen
dipeptide,
likeahistidine-aspartic acidcombination,for instance.
Histidinehas adefaultpKaof5.98, butwhenitoccurred nexttoasparticacidintheApl>
times theH-D dipeptideoccurredinthis
data,
whichis thesmallest setofthefour. AtthestartoftheGAruns, allpKavaluesarerandomlygenerated, soiftherewere alowoccurrence ofH-D
combinationsin any dataset, thefitnessvalue wouldn'tbeaffected asmuchasit is
by
highly
occurring dipeptides. Inturn,thismeansthatoutrageouspKavalues might notendup
being
replaced andcould survive inthefittestpopulation.
Thispoint couldbeusedtoexplaintheresults whenrunningonthe completedataset.
Again,thepKavalue for H-Dwas suggestedtobe 12. Forthis exampleitis importantto
keep
inmindthat theGArunusingthecompletedataset was
initially
seeded withthetop chromosomesfromeach ofthefourprevious runs. Thismeansthat thetop chromosome fromtheApl>0.7run
wasused,
immediately introducing
apKavalue of12intothepopulation. Evenintheinstancethatthechromosome wasn'tinthetop 5% fitness levelanddidn't surviveto thenextgeneration,
it's
likely
that thevalue of12 for H-D stayedintactthrougha series ofmatingand crossoverevents.Ifat some pointthechromosome containingthatpKavalue wasinthetop5%offitness
levels,itwasautomaticallymovedto thenextgeneration, savingthatvalueforthehistidine
-aspartic acid pair.
Overtime, thefittestchromosomes endup
being
reproduced morereadily,whichinthisexample would meanthatthevalue of12 fortheH-Dpairdominatesthepopulation eventhough
itmight nothavea significant effect on predictionaccuracy. Eventually,thisvalueis
incorporated intothealgorithm, and could endup
having
anegativeimpactontheprediction.Therefore,
by limiting
how farthepKavalues candeviate,
itwoulddecreasethenegativeimpactincases such asthis, and might notovershadowthesuggestedpKavaluesthatreallyare
having
apositive effect.
Athirdapproach mightbetoexpand onthechargeable groupsandintroduceuncharged
amino acidsintotheequation. PreviousresearchhasshownthatN-terminalasparaginehada
significantimpactonthepredicted pi value [5]. Althoughthemeans
by
whichthisoccursremainunclear, onepossibility may be that thehydrophobic, uncharged amino acidsinterfere
withcharged,adjacentside chainswhenincontactwith water. Althoughpossibilities are
extensiveforthistypeofresearch,one method ofattackingthisproblem mightbetoconsider
events where ahydrophobicamino acid restsbetweencharged side chains. Similartothe
research presentedhere,anevolutionary programmingapproach couldbeusedinattempttofind
pKavaluesthatremedytheproblem.
Conclusion
Thisthesisworkhasinvestigatedthepossibility of
improving
isoelectricpoint predictionby
using evolutionary programmingto accountforcharge-chargeinteractionswithinthesequence. Whileanincrease in accuracywasseen on a smallscale,itwas not substantial enough
and was overshadowed
by
decreasesin accuracy inother areas. Forthatreason wecannotsayour workhasresultedinabetteralgorithm. However,isoelectricpoint predictionis adifficult
problemthatstillhasmuch roomfor investigation. Whiletheresultsfailedtoyieldevidenceto
an overallaccuracyincrease,theinformationpresentedhereputs us one smallstepclosertoa
successful pi prediction and provides a genetic algorithmthatmayprove usefulin futurestudies.
Bibliography
[1] Hamdan,H. andRighetti,
P.G.(2005)
"ProteomicsToday: Protein AssessmentandBiomarkers
Using
Mass Spectrometry,2DElectrophoresis,andMicroarray
Technology".Hoboken,NJ,John
Wiley
and Sons,Inc.[2] Fichmann, J. andWestermeier,R.(1999)"2-D Protein Gel Electrophoresis: AnOverview." Methods in Molecular Biology: Vol. 112(1-9)
[3] Conte,M. (2005)"Isoelectric Point Prediction FromtheAmino Acid Sequenceof a
Protein"
submittedaspart of aMaster's Thesis ProjectatRITin 2004
[4] Mitchell,M. (1998)"An IntroductiontoGeneticAlgorithms"
The MIT Press, 1999
[5] Cargile,B.J., Talley, D.L., Stephenson,J.L. (2004) "ImmobilizedpH gradients as afirst
dimension inshotgun proteomics and analysis oftheaccuracyof pipredictabilityof peptides".
Electrophoresis 25: 936-945
[6] Hortsmann,C.S. (2001) BigJava:
Programming
andPracticeWiley, 1stEdition[7] "SWISS-2DPAGE Two-dimensionalpolyacrylamidegel electrophoresis
database"
Foundat
http://us.expasy.org/ch2d/
[8] Bjellqvist, B., Hughes, G., Pasquali, C, Paquet, N., Ravier, F., Sanchez, J.-C,et al.
(1993)
"The
focusing
positions of polypeptidesin immobilizedpH gradients canbepredicted fromtheiramino acid sequences".Electrophoresis 14:1023-1031.
[9]
TonellaL., HooglandC,BinzP.-A.,AppelR.D.,HochstrasserD.F.,Sanchez J.-C. "NewperspectivesintheEscherichiacoliproteomeinvestigation". Proteomics 1:409-423(2001).
[10] "ComputepI/MxforSwiss-Prot/TrEMBL entriesor a user-enteredsequence".Foundat
http://us.expasy.org/tools/pi_tool.html
[1
1]
SilleroA., Ribeiro,J.M.(1989)
"Isoelectricpoints of proteins:theoreticaldetermination.AnalyticalBiochemistry" 179: 319-325
[12]
Righetti, P.G., Caravaggio, T.(1976)"Isoelectricpoints and molecular weights ofproteins.JournalofChromatrography
"
[13]
Cargile,B.J., et al.(2004)
"Gel Based IsoelectricFocusing
ofPeptides andtheUtility
ofIsoelectricPointinProteinIdentification."
Journalof proteome research3.1 (2004): 1 12-9.
[14]
"Getproteinlistforareferencemap."
Foundat
http://www.expasy.org/cgi-bin/get-ch2d-table.pl
[15]
"NCBI Batch Entrezsearch". Foundathttp://www.ncbi.nlm.nih.gov/entrez/batchentrez.cgi?db=Protein
Appendix A
-Escherichia
coliData Set
Protein Actualpi Predicted
|Actual-Pred|
Color Codes: P0AE08 5.05 5.050048828 4.88E-05 ApKO.lP05055 5.13 5.129943848 5.62E-05 0.1<ApK0.3 P45578 5.2 5.200439453 4.39E-04 0.3<Apl<0.7
P0AEZ9 5.74 5.7421875 0.0021875 Apl>0.7
P37689 5.15 5.152587891 0.002587891
P0ABB0 5.81 5.806274414 0.003725586
P0A6L0 5.52 5.514892578 0.005107422 P13029 5.16 5.16583252 0.00583252 P61714 5.19 5.183349609 0.006650391 P23869 5.51 5.502929688 0.007070312
P09030 5.8 5.807983398 0.007983398
P0AEZ3 5.28 5.26965332 0.01034668
P0A7A9 5.06 5.049194336 0.010805664
P0A6P1 5.22 5.234619141 0.014619141
P0AFU8 5.67 5.655029297 0.014970703
P0ABB4 4.95 4.932983398 0.017016602
P0A817 5.1 5.121826172 0.021826172
P0AB71 5.56 5.537109375 0.022890625
P36683 5.24 5.263671875 0.023671875
P0ACU7 5 4.973144531 0.026855469
P0A6E4 5.28 5.252563477 0.027436523
P0A6F5 4.91 4.879150391 0.030849609
P00509 5.53 5.561035156 0.031035156
P39172 5.58 5.611450195 0.031450195
PI 6703 5.47 5.437988281 0.032011719
[image:39.531.48.296.275.656.2]P0AE67 4.95 4.915039063 0.034960938
P0ADU2 5.77 5.807128906 0.037128906
P0A9C3 4.9 4.860778809 0.039221191
P0A877 5.38 5.338867188 0.041132812
P0C054 5.63 5.588378906 0.041621094
P62707 5.82 5.861816406 0.041816406
P0A799 5.15 5.107299805 0.042700195
P0AAI9 5.03 4.98425293 0.04574707
P0A6M8 5.21 5.256408691 0.046408691
P26646 5.6 5.648193359 0.048193359
P07004 5.39 5.438842773 0.048842773
P0A6D3 5.34 5.389282227 0.049282227
P0A7Z4 5.04 4.988952637 0.051047363
P0A870 5.08 5.132080078 0.052080078
P63284 5.44 5.383728027 0.056271973
P0A796 5.43 5.487548828 0.057548828
P08312 5.74 5.799438477 0.059438477
POAGEO 5.41 5.472167969 0.062167969
P0A6G7 5.6 5.537109375 0.062890625
P0A6F9 5.23 5.166259766 0.063740234
P0A7F3 7.01 6.941894531 0.068105469
POAE18 5.71 5.638793945 0.071206055
P24216 4.96 4.888549805 0.071450195
P09832 5.48 5.551635742 0.071635742
P23721 5.47 5.391845703 0.078154297
POA850 4.93 4.849884033 0.080115967
P0AB55 5.29 5.208984375 0.081015625
P76149 5.38 5.46105957 0.08105957
P0AG67 4.99 4.908416748 0.081583252
PI6659 5.06 5.146606445 0.086606445
P0AA25 4.8 4.711669922 0.088330078
P0A9A9 5.78 5.688354492 0.091645508
P08142 5.22 5.314086914 0.094086914
PI8843 5.34 5.434570313 0.094570313
POAC55 5.78 5.875488281 0.095488281
P05194 5.31 5.213256836 0.096743164
P0A6Y8 4.96 4.863128662 0.096871338
P0A9M5 5.44 5.538818359 0.098818359
P0A6D7 5.18 5.280761719 0.100761719
POAEDO 5.2 5.097900391 0.102099609
P0A9D2 5.76 5.863525391 0.103525391
P0A8G6 5.51 5.615722656 0.105722656
P0AG78 6.49 6.596679688 0.106679687
P0AEQ3 7.32 7.435791016 0.115791016
P60595 5.24 5.359375 0.119375
P0ABU2 5.02 4.900085449 0.119914551
P0A7L0 8.24 8.115966797 0.124033203
P0ABD8 4.78 4.654846191 0.125153809
P0AF03 4.84 4.965454102 0.125454102
P04949 4.7 4.573669434 0.126330566
P68066 4.98 5.106445313 0.126445312
P0A6E6 5.34 5.46875 0.12875
P0A6A3 5.72 5.8515625 0.1315625
P75797 7.32 7.186279297 0.133720703
P29744 4.82 4.683044434 0.136955566
P09029 5.75 5.612304688 0.137695313
P61889 5.49 5.629394531 0.139394531
P00547 5.33 5.472167969 0.142167969
P0A7E1 7.28 7.13671875 0.14328125
P67910 4.98 4.835571289 0.144428711
P0AGD3 5.45 5.595214844 0.145214844
P0A9A6 4.83 4.680480957 0.149519043
P00946 5.16 5.31237793 0.15237793
P12758 5.66 5.82421875 0.16421875
P0A955 5.43 5.595214844 0.165214844
P0A8M0 5.01 5.195739746 0.185739746
P69783 4.95 4.762939453 0.187060547
P0AFC7 5.42 5.612304688 0.192304688
P0A9Q9 5.2 5.393554688 0.193554687
P25553 5.29 5.095336914 0.194663086
P0AEX9 5.23 5.435424805 0.205424805
P28635 4.95 5.156860352 0.206860352
P0A9G6 4.98 5.189758301 0.209758301
P0A6W5 4.95 4.73815918 0.21184082
P39177 6.25 6.037841797 0.212158203
P0A862 5.02 4.800537109 0.219462891
P0A715 6.1 6.323242188 0.223242188
P0AC69 4.96 4.727050781 0.232949219
P0A7N1 8.3 8.065551758 0.234448242
P0ABU5 4.92 4.685180664 0.234819336
P0A7K2 4.87 4.633056641 0.236943359
P0AES9 4.84 5.0859375 0.2459375
P0AD96 5.31 5.561889648 0.251889648
P38489 5.55 5.812255859 0.262255859
P0AEK4 5.33 5.595214844 0.265214844
P0A6N1 5.58 5.314086914 0.265913086
P0A855 7.05 6.78125 0.26875
P46850 5.65 5.928466797 0.278466797
P0A9C5 5 5.282470703 0.282470703
P35340 5.2 5.485839844 0.285839844
P0A9M2 5.38 5.080810547 0.299189453
P04036 5.11 5.46105957 0.35105957
P37902 7.87 7.516113281 0.353886719
P0A940 5.33 4.967163086 0.362836914
P0A763 5.19 5.557617188 0.367617187
P0A8X2 5.2 5.591796875 0.391796875
P63020 4.96 4.568115234 0.391884766
P76290 5.8 5.373046875 0.426953125
P04816 5.08 5.516601563 0.436601562
P0A8Q6 5.4 4.959472656 0.440527344
P0AG82 6.85 7.293945313 0.443945313
P0ABT2 5.27 5.718261719 0.448261719
P09551 5.17 5.622558594 0.452558594
P08200 4.7 5.17565918 0.47565918
P0A8P3 5.46 5.937011719 0.477011719
P23847 5.71 6.196777344 0.486777344
P37329 6.7 7.187988281 0.487988281
POAEUO 4.99 5.489257813 0.499257812
P0AEE5 5.19 5.697753906 0.507753906
P0AFK9 4.76 5.270507813 0.510507813
P0ADG7 5.49 6.017333984 0.527333984
PI6700 6.58 7.128173828 0.548173828
P69441 5 5.567871094 0.567871094
P0AFZ3 5.01 4.428833008 0.581166992
P23843 5.47 6.052368164 0.582368164
P69797 5.17 5.755859375 0.585859375
P0AGE9 5.73 6.321533203 0.591533203
P0A6P9 4.74 5.344848633 0.604848633
P18335 5.19 5.797729492 0.607729492
P0A858 5.01 5.649047852 0.639047852
P31663 5.25 5.926757813 0.676757813
POCOVO 8.01 7.329833984 0.680166016
P0A879 5.03 5.717407227 0.687407227
tUUBUBSBBBBKNUtt
P0ADG4 5.71 6.453125 0.743125
P30859 5.07 5.813964844 0.743964844
P00894 8.11 7.352050781 0.757949219
P0AET2j 5 5.762695313 0.762695313
P0A910 : 5.23 5.996826172 0.766826172
P61316 , 5.52 6.306152344 0.786152344
P0ABK51 4.95 5.843017578 0.903017578
P0ADE8
\
6.11 5.179931641 0.930068359 P0ADA3 8.84 7.902770996 0.937229004P0AFL3 8.52 7.567382813 0.952617187 P76002 9.2 8.246704102 0.953295898
POAFGO 5.4 6.37109375 0.97109375
P0AD59 5.33 6.306152344 0.976152344
P0AEM9 5.19 6.230957031 1.040957031
P0A7R1 5.1 6.186523438 1.086523438
: P77348 8.55 7.314453125 1.235546875
P0A9B2 5.32 6.583007813 1.263007812
P33136 8.04 6.608642578 1.431357422
P00811 9.06 7.55456543 1.50543457
P0ADV7 10.3 7.978393555 2.321606445
P68919 10.6 8.2578125 2.3421875
Appendix B
-Genetic
Algorithm
Source
Code
Chromosome
.java/*
*Chromosome.java
*
author:Chris Parkin
*date:
September,2006
*
*Class for
constructionandmanipulationof achromosome,which contains *
information regardingpKavaluesforaminoacidtriplets
*/
publicclassChromosome{
privateString[]chromosome;//arrayrepresentingthechromosome
//chromosomelabels
private staticStringf]represented;
*default
constructor(randomlyassignedvalues) *each positionin
the arrayisassigned a valuebetween 0and15
publicChromosomeO{ represented=new
String[] { "HH","HK","HR","HE","HD","HC","HY",
"KH","KK","KR","KE","KD","KC","KY",
"RH","RK","RR","RE","PvD","RC","RY",
"DH","DK","DR","DE","DD","DC","DY",
"EH","EK","ER","EE","ED","EC","EY", "CH","CK","CR","CE","CD","CC","CY", "YH","YK","YR","YE","YD","YC","YY"};
chromosome=new
String[represented.length]; for(inti=0;i<represented.length;i++) {
int intValue=
(int)((Math.random() * 14)+ 1);
Stringbinary=Integer.toBinaryString(intValue);
if(binary.length()<4){
binary=
addLeadingZeros(binary,4-binary.length()); }
chromosome[i]=binary;
}
/***************************************************************
*
createanemptychromosomeof specificlength
**************#************************************************/
publicChromosome(intlength){
chromosome=new
String[length];
}
/****#**********************************************************
*
createa chromosomebasedon aninputstringarray
************************************************************
publicChromosome(String[] input){
chromosome= input; } /*************************************************************** * getLength *
returnthelengthofthechromosomearray
***************************************************************/
publicintgetLength(){
returnchromosome.length; } /*************************************************************** * getValueAt *
returnthecurrent pKa valueforthespecifiedarray index inbinaryformat * @param:arraylndex- theindex
corresponding to therepresentedarray ***************************************************************/
publicStringgetValueAt(intarraylndex) {
return chromosome[arraylndex];
}
/*************************************************************** *
getlntValueAt
* returnthecurrent pKa valueforthespecified
array index in int form
*
@param:arraylndex- the
index correspondingto therepresentedarray
publicint getIntValueAt( intarraylndex){
returnInteger.parseInt(chromosome[arrayIndex],2);
}
* mutate *
mutatethechromosomeby flippingarandomlychosenbit
public voidmutate(){
//randomlychoose anindex inthechromosome
intindexToFlip=
(int)(Math.random() *chromosome.length);
}
//getthebinaryvaluetomutate
StringbeforeMutation=
chromosome[indexToFlip];
//randomlychoose whichofthefourbitstoflip
intbitToFlip=
(int)(Math.random()*4);
//convertthestringintosomethingthatcanbeedited
char[]editable=
beforeMutation.toCharArray();
//determinetofliptoa 1 or a0 if(editable[bitToFlip] == '0*){ editable[bitToFlip]= T; } else{ editable[bitToFlip]= '0'; }
//createanew,post-mutationstringand stickit back inthechromosome
StringafterMutation=new