R E S E A R C H
Open Access
Predicting outcome in patients with
moderate to severe traumatic brain injury
using electroencephalography
Marjolein E. Haveman
1,2*, Michel J. A. M. Van Putten
1,2, Harold W. Hom
3, Carin J. Eertman-Meyer
2,
Albertus Beishuizen
3and Marleen C. Tjepkema-Cloostermans
1,2Abstract
Background:Better outcome prediction could assist in reliable quantification and classification of traumatic brain injury (TBI) severity to support clinical decision-making. We developed a multifactorial model combining quantitative electroencephalography (qEEG) measurements and clinically relevant parameters as proof of concept for outcome prediction of patients with moderate to severe TBI.
Methods:Continuous EEG measurements were performed during the first 7 days of ICU admission. Patient outcome at 12 months was dichotomized based on the Extended Glasgow Outcome Score (GOSE) as poor (GOSE 1–2) or good (GOSE 3–8). Twenty-three qEEG features were extracted. Prediction models were created using a Random Forest classifier based on qEEG features, age, and mean arterial blood pressure (MAP) at 24, 48, 72, and 96 h after TBI and combinations of two time intervals. After optimization of the models, we added parameters from the International Mission for Prognosis And Clinical Trial Design (IMPACT) predictor, existing of clinical, CT, and laboratory parameters at admission. Furthermore, we compared our best models to the online IMPACT predictor.
Results:Fifty-seven patients with moderate to severe TBI were included and divided into a training set (n= 38) and a validation set (n= 19). Our best model included eight qEEG parameters and MAP at 72 and 96 h after TBI, age, and nine other IMPACT parameters. This model had high predictive ability for poor outcome on both the training set using leave-one-out (area under the receiver operating characteristic curve (AUC) = 0.94, specificity 100%, sensitivity 75%) and validation set (AUC = 0.81, specificity 75%, sensitivity 100%). The IMPACT predictor independently predicted both groups with an AUC of 0.74 (specificity 81%, sensitivity 65%) and 0.84 (sensitivity 88%, specificity 73%), respectively. Conclusions:Our study shows the potential of multifactorial Random Forest models using qEEG parameters to predict outcome in patients with moderate to severe TBI.
Keywords:Traumatic brain injury, EEG, Prognosis, Random forest, ICU
Background
There is an ongoing need for continuous, bedside-available, preferably non-invasive tools for reliable predic-tion of neurological outcome in traumatic brain injury (TBI) patients. A prediction model for patient outcome after TBI might provide realistic information to caregivers to inform relatives about expectations. Besides, better
outcome prediction could assist in reliable quantification and classification of TBI severity to support clinical decision-making [1].
Currently, the International Mission for Prognosis And Clinical Trial Design (IMPACT) predictor is the best available predictor for neurological outcome after TBI. This online predictor is based on a large multicen-ter database including both randomized controlled trials and observational studies in TBI [2]. Linear regression models were created on clinical admission parameters to predict mortality (Glasgow Outcome Scale 1) and
un-favorable outcome (Glasgow Outcome Scale 1–3) at 6
© The Author(s). 2019Open AccessThis article is distributed under the terms of the Creative Commons Attribution 4.0 International License (http://creativecommons.org/licenses/by/4.0/), which permits unrestricted use, distribution, and reproduction in any medium, provided you give appropriate credit to the original author(s) and the source, provide a link to the Creative Commons license, and indicate if changes were made. The Creative Commons Public Domain Dedication waiver (http://creativecommons.org/publicdomain/zero/1.0/) applies to the data made available in this article, unless otherwise stated.
* Correspondence:marjoleinhaveman@gmail.com
1
Clinical Neurophysiology Group, University of Twente, Drienerlolaan 5, 7522 NB Enschede, the Netherlands
2Department of Neurology and Clinical Neurophysiology (C2), Medisch
months after injury [3]. The model is based on age, motor score, pupillary reaction, CT characteristics, signs of hypoxia, hypotension, glucose, and hemoglobin at ad-mission. However, this prediction model, based on pa-rameters at admission, does not take into account evolvement of secondary injury in TBI patients nor ef-fects from treatment [4].
Electroencephalography (EEG) is a non-invasive
bedside-available measure of cortical activity and is par-ticularly useful in sedated or comatose patients [5–7]. Continuous EEG (cEEG) is often part of the multimodal monitoring in TBI patients at the ICU, where it is mainly used for the detection of (non-convulsive or elec-trographic) seizures [8,9].
Several attempts have been made to relate EEG features to functional outcome of TBI patients. Worse outcome was associated with lower (regional) EEG power [9], slow-ing of the EEG [10–13], decrease in alpha power [9–11, 14, 15], lower EEG (alpha) variability [9, 16, 17], and in-creased coherence [18]. However, most studies used single EEG features and were limited to mild TBI in the subacute phase (days, weeks, or even months) after the moment of injury [19]. A combination of multiple EEG features might be even more relevant for outcome prediction in TBI pa-tients, considering the heterogeneity of the primary injury, additional organ dysfunctions, and evolvement of second-ary injury in these patients. Furthermore, computer algo-rithms can assist in EEG interpretation [6, 20,21], which decreases the labor intensity and subjectivity.
As proof of concept, we report on a cEEG monitoring tool using multiple quantitative EEG (qEEG) features combined with IMPACT predictors for neurologic out-come prediction in patients with moderate to severe TBI.
Materials and methods Study population
Between 2013 and 2018, two prospective cohort stud-ies were performed in the Medisch Spectrum Twente in which cEEG was recorded in patients with moder-ate to severe TBI. Inclusion criteria were patients of 18 years and older with moderate to severe TBI
(Glas-gow Coma Scale ≤12 at the trauma location or
emer-gency department) admitted to the ICU with a(n) (expected) stay of more than 24 h. Exclusion criteria were trauma following or combined with severe circu-latory failure (cardiac arrest/cerebral hemorrhage), earlier TBI or CVA without full recovery, progressive brain illness (tumor, neurodegenerative disease), or limited life expectancy (< 6 months) prior to TBI. Since the EEG is part of our routine care, the institu-tional review board waived the need for written
in-formed consent. Verbal consent was asked for
outcome assessment in the first cohort from 2013 to
2016. For a larger clinical study, from 2017, written informed consent was obtained from the legal repre-sentative for the EEG measurements and (if possible) from the patient during follow-up.
Outcome assessment
Patient outcome assessment at 12 months after admis-sion was performed by telephone calls by one of two in-vestigators. The primary outcome measure was the extended Glasgow Outcome Scale (GOSE) approxi-mately after 1 year after TBI dichotomized as poor
out-come (GOSE 1–2) or good outcome (GOSE 3–8).
Clinical parameters
Age, gender, time of TBI, and Injury Severity Score were noted at admission. From the electronic patient records, the following data during the first 7 days of inclusion were retrospectively collected: administration of propo-fol, fentanyl, midazolam, and mean arterial blood pres-sure (MAP). Age is a powerful prognostic factor in recovery after TBI [2] and hypotension is associated with
poor outcome and increased mortality after TBI [2, 22,
23]. The features age and MAP are available in all pa-tients at any time.
IMPACT prediction and parameters
For each patient, the prediction by the IMPACT classi-fier was calculated online [24]. IMPACT parameters are age, motor score, pupil response, CT characteristics (Marshall CT classification [25], epidural hematoma, traumatic subarachnoid hematoma), secondary insults (hypotension and hypoxia), and laboratory parameters (glucose and hemoglobin) at admission, which we re-trieved retrospectively from the medical records.
EEG recordings
Continuous EEG recordings were started as soon as pos-sible after admission to the ICU and continued until 7 days, unless a patient regained consciousness or ICU treatment was ended. Nineteen electrodes (either silver/ silver chloride cup or subdermal wire) were placed ac-cording to the 10–20 International System. A Neurocenter EEG system with Refa amplifiers (TMSi, Netherlands) was used, recording at a sample frequency of 256 Hz.
EEG features
At 24, 48, 72, and 96 h after TBI, 60 min of EEG data was preprocessed using a zero-phase sixth-order Butterworth
bandpass filter of 0.5–30 Hz. A custom-made computer
algorithm was used to detect artifacts and remove the concerning channels within 10-s windows in the common average reference. Artifacts included empty channels and channels with large peaks or noise (amplitude≥150 or≤
preprocessing, all qEEG features were calculated for each 10-min window in the longitudinal bipolar montage.
Absolute power per band
The absolute power of the frequency bands was calcu-lated by integration of the power spectral density (PSD) within each frequency band: delta (0.5–4 Hz), theta (4–8 Hz), alpha (8–13 Hz), and beta (13–20 Hz). Hereby, we
estimated the PSD of each channel using Welch’s
method, with an overlap of 50%, and averaged the PSD over the 60 epochs within the 10-min windows.
Total power
The sum of all power bands (0.5–20 Hz) resulted in the total power.
Relative power per band
The relative power of each frequency band was defined as the ratio between the power within that frequency band and the total power.
ADR
The alpha/delta ratio (ADR) was calculated as the power ratio from the alpha (8–13 Hz) and delta (0.5–4 Hz) fre-quency bands.
SEF90
The spectral edge frequency 90% (SEF90) is the fre-quency at which 90% of the power lies below in the higher frequencies.
Variability per frequency band
Variability in the power of each frequency band was computed by the ratio of the median absolute deviation (MAD) to the median power in each frequency band [9], resulting in a value between 0 (no variability) and 1 (high variability).
Brain symmetry index
The pairwise derived brain symmetry index (BSI) was used to calculate the symmetry of power between each pair of electrodes from the left and right hemisphere [26], expressed in a value between 0 (symmetric) and 1 (highly asymmetric). BSI was calculated over the
fre-quency ranges 0.5–20 Hz (total power) and 0.5–4 Hz
(delta power).
Center of gravity
The center of gravity (COG) quantifies the distribution of power over the head and represents the topographical place at which the maximal power within a certain fre-quency band. The COG was calculated for the left-right (x-) and anterior-posterior (y-) direction, expressed as values from−1 to 1 [27].
Mean amplitude
The mean amplitude was defined as the standard devi-ation of the signal.
Coherence
Coherence was defined as the mean of all magnitude-squared coherences between all possible combinations of channels using a Hanning window of 4 s and an overlap of 2 s, resulting in a value between 0 (no synchronization) and 1 (full synchronization).
Shannon entropy
The Shannon entropy was calculated as defined by Shan-non [28]. Higher entropy indicates a more complex and less predictable system [29,30].
Regularity
Regularity is a measure for the continuity of the EEG pattern based on the variance of the amplitude of the signal. Regularity is normalized between 0 and 1, where a higher value indicates a signal with more regular amp-litude [6].
EEG preprocessing and feature calculation were per-formed using MATLAB R2018a (The MathWorks, Inc., Natick, MA).
Multifactorial model
We trained a Random Forest classifier, which is a super-vised machine learning method that combines multiple individual classification trees using bootstrapped samples to randomly select features at each node to determine a split. Predictions result from the percentage of vote of the different classification trees [31]. Because the predic-tion accuracy of a model increases by using a larger sam-ple size [32], we used an extended number of observations: for each patient, EEG features from the six 10-min windows at 24, 48, 72, and 96 h after TBI were included. If there was no available data for patients at these intervals, available data from the previous and fol-lowing hour (and subsequently, the second last or next hour) were used.
Modeling was performed using the Random Forest package in the R Library (randomForest, R 3.5.1)
based on Breiman’s Random Forests for Classification
which the individual parameters from the IMPACT model were added to the models with 10 parameters.
The performance in the training set was evaluated using“leave-one-patient-out.”Poor outcome was defined as positive classification. The area under the ROC curve (AUC) with 50% confidence intervals was used for model comparison. The model with the highest AUC without IMPACT parameters (1) and including IM-PACT parameters (2) was used for validation on an ex-ternal dataset not used for training, and for comparison with the IMPACT predictor (3). Finally, these three models were also trained and evaluated to predict poor
outcome defined as GOSE 1–4.
Results
Fifty-seven patients were included. Patients were divided into a training set (38 patients included between 2013 and 2016) and a validation set (19 patients included be-tween 2017 and 2018). A flow diagram for the inclusion and exclusion of eligible patients is shown in Fig.1.
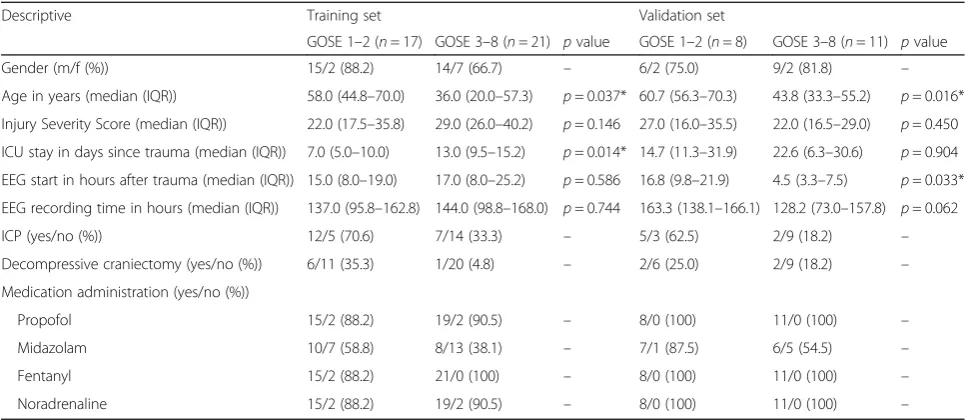
Table 1 shows the baseline characteristics. Patients
with good neurological outcome were significantly younger in both training set (p= 0.037) and validation
set (p= 0.016). Injury Severity Score and duration of
EEG monitoring did not differ between the groups in both sets.
Fifteen out of the 38 patients in the training set died during their hospital admission (GOSE 1), and 15 had a good neurological outcome at 1 year with a GOSE between 3 and 6. The remaining eight patients were lost to follow-up, because they could not be contacted by telephone. Patient outcome was there-fore estimated based on their medical data records.
Two of them were in a vegetative state at discharge
and assigned to the poor outcome group (GOSE 1–
2), and the other six to the good outcome group
(GOSE 3–8). In the validation set, none of the
pa-tients was lost to follow-up; 11 out of 19 papa-tients had a good neurological outcome, and the other eight pa-tients had a poor outcome.
Model selection and performance in the training set Our initial models based on all qEEG features, age,
and MAP had an AUC of 0.79–0.83. Models in which
we selected only the 10 best features had an average AUC of 0.86 on the single time intervals, 0.88 on subsequent combined intervals (24 and 48, 48 and 72, and 72 and 96), and 0.82 on the 1-day-in-between combined intervals (24 and 72, 48 and 96). From these models with fewer features, the best model was the one with features from both 72 and 96 (72 and 96) h after TBI with an AUC of 0.88. Adding IM-PACT parameters to the features of our best model resulted in an increase in AUC to 0.94 (specificity 100%, sensitivity 75%) on the training set. This model was subsequently used for validation and compared to the IMPACT predictor independently.
Performance in the validation set
Our best model classified poor outcome in the validation set with an AUC of 0.75 without IMPACT parameters and an AUC of 0.81 including IMPACT parameters with a specificity of 83% vs. 75% and a sensitivity of 0.88 vs. 100%, respectively (Fig.2).
[image:4.595.60.540.497.683.2]Performance of the IMPACT predictor
The IMPACT predictor independently predicted with an AUC of 0.74 (sensitivity 65%, specificity 81%) on our training set and an AUC of 0.84 (sensitivity 88%, specificity 73%) on the validation set. However, the sensitivity and specificity at the optimal threshold were lower compared to those of our best model including both EEG and IMPACT parameters (Table2).
Model performances of the best models with and with-out IMPACT parameters and the performance of the
IMPACT predictor are shown in Table2. This table also
shows performances of these models when using an ad-justed GOSE dichotomy of 1–4 vs. 5–8.
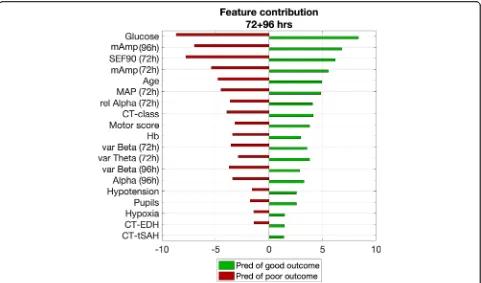
Feature contributions
The best models used 19 features (8 qEEG, MAP, and age, and 9 other IMPACT parameters at
admis-sion), of which each contribution is shown in Fig. 3
ranking from high to low relevance. Mean amplitude of the EEG, age, and MAP were important features in all models. In the model at 72 + 96 h after TBI, the most relevant features originated from 72 h, while the mean amplitude at 96 h also contributed strongly to
the model’s predictability. From the IMPACT
parame-ters, the glucose level at admission strongly contrib-uted to the predictive ability of the models. Second, motor score and hemoglobin level at admission were features with moderate relevance. The least relevant were pupillary reactivity, hypotension, hypoxia, and the presence of epidural hematoma or traumatic sub-dural hemorrhage at the CT scan. The latter also scored lower than the EEG features.
Discussion
We developed a multifactorial model as proof of concept for using a machine learning algorithm including qEEG features and clinically relevant parameters for the prog-nostication in moderate to severe TBI. Our best models comprised qEEG features and MAP at 72 and 96 h after TBI, combined with clinical (IMPACT) parameters at hospital admission. Our model has an AUC of 0.94 on the training set and 0.81 on the validation set. In both training and validation sets, the sensitivity and specificity of our best model were slightly higher than those of the IMPACT predictor alone, while the AUC of the ROC was similar.
Although several attempts have been made over the last decades to relate individual EEG parameters to pa-tient outcome after TBI [9–11, 13–16, 19, 33–37], no models based on multiple qEEG parameters predicting patient outcome in the acute phase after moderate to se-vere TBI were reported.
Quantitative EEG features highly contributed to the predictive ability of the model, especially the mean amp-litude of the EEG. Although mean ampamp-litude (or total power) of the EEG has been associated with depth of coma [38] and with neurologic outcome in patients after cardiac arrest [6], it has rarely been described in relation to patient outcome after TBI [9]. Spectral edge fre-quency of 90% and relative alpha power at 72 h were the second and third most relevant qEEG features. This is in line with a recent study from Tolonen et al., who showed that median alpha power was most related to patient outcome after TBI [9].
[image:5.595.56.541.98.308.2]Age and MAP at 72 h were relevant prognostic fea-tures as well, which is in line with earlier literature Table 1Patient characteristics for both training and validation sets
Descriptive Training set Validation set
GOSE 1–2 (n= 17) GOSE 3–8 (n= 21) pvalue GOSE 1–2 (n= 8) GOSE 3–8 (n= 11) pvalue
Gender (m/f (%)) 15/2 (88.2) 14/7 (66.7) – 6/2 (75.0) 9/2 (81.8) –
Age in years (median (IQR)) 58.0 (44.8–70.0) 36.0 (20.0–57.3) p= 0.037* 60.7 (56.3–70.3) 43.8 (33.3–55.2) p= 0.016*
Injury Severity Score (median (IQR)) 22.0 (17.5–35.8) 29.0 (26.0–40.2) p= 0.146 27.0 (16.0–35.5) 22.0 (16.5–29.0) p= 0.450
ICU stay in days since trauma (median (IQR)) 7.0 (5.0–10.0) 13.0 (9.5–15.2) p= 0.014* 14.7 (11.3–31.9) 22.6 (6.3–30.6) p= 0.904
EEG start in hours after trauma (median (IQR)) 15.0 (8.0–19.0) 17.0 (8.0–25.2) p= 0.586 16.8 (9.8–21.9) 4.5 (3.3–7.5) p= 0.033*
EEG recording time in hours (median (IQR)) 137.0 (95.8–162.8) 144.0 (98.8–168.0) p= 0.744 163.3 (138.1–166.1) 128.2 (73.0–157.8) p= 0.062
ICP (yes/no (%)) 12/5 (70.6) 7/14 (33.3) – 5/3 (62.5) 2/9 (18.2) –
Decompressive craniectomy (yes/no (%)) 6/11 (35.3) 1/20 (4.8) – 2/6 (25.0) 2/9 (18.2) –
Medication administration (yes/no (%))
Propofol 15/2 (88.2) 19/2 (90.5) – 8/0 (100) 11/0 (100) –
Midazolam 10/7 (58.8) 8/13 (38.1) – 7/1 (87.5) 6/5 (54.5) –
Fentanyl 15/2 (88.2) 21/0 (100) – 8/0 (100) 11/0 (100) –
Noradrenaline 15/2 (88.2) 19/2 (90.5) – 8/0 (100) 11/0 (100) –
stating that age is a powerful prognostic factor in recov-ery after TBI [2]. Prediction was most optimal with fea-tures from recordings at 72 and 96 h after TBI. This time interval coincides with being at risk for secondary damage, and this period might therefore have strong
[image:6.595.57.540.88.289.2]impact on the prognosis of TBI patients [39]. Although the model at 72 + 96 h was selected as the best model for this proof of concept, this was however not statistically substantiated and all models performed well at the dif-ferent (individual) time intervals in the training set
Table 2Model performances of the best model based on electroencephalography features, mean arterial pressure and age, the best model including IMPACT features at admission and the IMPACT predictor independently, predicting poor outcome both as Extended Glasgow Outcome Scale (GOSE) 1–2 and GOSE 1–4. For both the internal validation within the training set and the validation set, the number of patients (N), area under the receiver operating characteristic curve (AUC) values with 50% confidence interval, and sensitivity and specificity at an optimal threshold are shown
Performance measures for the prediction model
Best model, 72 + 96 h Best model, 72 + 96 h + IMPACT IMPACT predictor
Poor outcome GOSE 1–2 GOSE 1–4 GOSE 1–2 GOSE 1–4 GOSE 1–2 GOSE 1–4
Training set
N 30 25 29 25 38 30
AUC (50% CI) 0.88 (0.83–0.91) 0.66 (0.57–0.74) 0.94 (0.89–0.96) 0.61 (0.51–0.68) 0.74 (0.66–0.79) 0.67 (0.61–0.73)
Threshold 0.541 0.740 0.680 0.591 0.650 0.530
Sensitivity 0.92 (0.81–0.98) 0.71 (0.59–0.80) 0.75 (0.61–0.85) 0.76 (0.66–0.85) 0.65 (0.54–0.75) 0.63 (0.53–0.72)
Specificity 0.77 (0.66–0.85) 0.75 (0.57–0.88) 1.00 (0.92–1.00) 0.50 (0.33–0.67) 0.81 (0.72–0.88) 0.82 (0.67–0.91)
Validation set
N 14 14 14 14 19 19
AUC (50% CI) 0.75 (0.60–0.86) 0.73 (0.62–0.82) 0.81 (0.69–0.88) 0.76 (0.65–0.89) 0.84 (0.76–0.89) 0.87 (0.78–0.92)
Threshold 0.623 0.805 0.378 0.668 0.550 0.349
Sensitivity 0.83 (0.61–0.95) 0.78 (0.61–0.89) 1.00 (0.79–1.00) 0.89 (0.73–0.97) 0.88 (0.70–0.96) 1.00 (0.88–1.00)
Specificity 0.88 (0.70–0.96) 0.80 (0.55–0.94) 0.75 (0.57–0.88) 0.80 (0.55–0.94) 0.73 (0.58–0.84) 0.75 (0.57–0.88)
IMPACTInternational Mission for Prognosis And Clinical Trial Design,GOSEExtended Glasgow Outcome Scale,AUCarea under the receiver operating characteristic curve,CIconfidence interval
Performences of the best model referred to throughout the manuscript is shown in italic
[image:6.595.57.541.502.706.2](average AUC of 0.86). Therefore, models at other time intervals could be of interest in future studies, too. In addition, temporal evolution might have additional prog-nostic value. At 72 and 96 h, the number of patients dropped due to patients’passing or awakening and being transferred to the general ward. Patients with no imme-diate risk of death and uncertainty about the awakening remain, which is also the category for which caregivers could use better decision support tools.
From the IMPACT parameters, glucose levels at admis-sion contributed most to the model’s predictive ability. Murray et al. already stated that prognostic models in TBI should include laboratory data and especially glucose [2], although they found a smaller effect of glucose compared to other parameters in the IMPACT predictor [24]. Least
relevant for our models were pupillary reactivity,
hypotension, hypoxia, and the presence of epidural hematoma (EDH) or traumatic subdural hemorrhage at the CT scan. On the contrary, Steyerberg et al. found that most prognostic information was contained by age, motor score, and pupillary reaction and that CT information provided additional information, although this information might be not detailed enough for prognostic purposes [24]. Lee et al. (2019) [40] recently showed that the absence of a posterior
dominant rhythm, absence of sleep stage N2 transients, and predominant delta activity and discontinuous background during the first 72 h were individually associated with poor outcome at 3 months and increased the predictive ability of the IMPACT predictor from 0.65 to 0.77. Since we focused on quantitative analysis instead of visual EEG analysis, these EEG characteristics were not incorporated in our proof of concept study; however, they could be added in future pre-diction modeling after TBI.
EEG measurements are more time consuming than IMPACT prediction. Electrode application takes ap-proximately 45 min, and visual analysis apap-proximately
1–2 h per day. This can be substantially reduced by
computer algorithms supporting visual analysis [6] and promising developments in electrode design [41–44]. If the prognostic ability of a model based on EEG exceeds that of the IMPACT predictor, the benefits may out-weigh the extra efforts.
[image:7.595.58.539.87.370.2]and heterogeneous pathology evolvement in TBI patients [4]. The fact that our best model has similar predictive power as the IMPACT data set independently is an en-couraging result for a model that is trained on only 30 patients from a by nature heterogeneous group of TBI patients. A Random Forest classifier was chosen because of its ability to prevent overfitting and the model was trained using leave-one-patient-out, which also lowers overfitting. A limitation of Random Forest models for multifactorial data is that it excludes observations with missing data. For this reason, other possible relevant clinical parameters, which were not available in all pa-tients, such as intracranial pressure, were not considered in modeling.
A limitation of our study is that primary outcome, the GOSE, does not take non-neurological cause of death (in case of polytrauma patients) into account and that patient survival depends on clinical decision-making. In addition, preferably, the poor outcome group would be
defined as death to severe disability (GOSE 1–4) and
good outcome as moderate disability to good recovery
(GOSE 5–8). Due to a low number of patients with a
GOSE of 5–8 and incomplete follow-up in 8 patients of
the training set, we primarily choose to define poor
out-come as GOSE 1–2. Model performances were indeed
lower when predicting poor outcome defined as GOSE
1–4. A disadvantage of including the MAP as a
param-eter for prediction is that it could be artificially con-trolled because of treatment to optimize hemodynamics or cerebral perfusion pressure. Although MAP was in-cluded in the prediction model, its contribution was relatively low (not in the top 5 most relevant factors). As EEG features also depend on the MAP and CPP, this may explain its low additional value for outcome predic-tion. QEEG features were not corrected for the potential influences of decompressive craniectomy or epileptic ac-tivity. Although this might have increased the mean amplitude of the EEG, lower mean amplitude is a strong predictor for poor outcome.
Another limitation of the study is that the training and validation sets originate from different cohorts in time. However, we do not expect this to be a confounder, be-cause there were no changes in treatment over this period and the ratio of poor outcome was relatively simi-lar. The size of the training set and validation set are below the ideal size for a prognostic model, its validation and comparison to the IMPACT predictor alone. How-ever, in this proof of concept study, we showed the po-tential of Random Forest models for this purpose.
Models should be further developed using larger data-sets and use GOSE 1–4 and 5–8 to distinguish between poor and good neurologic outcome respectively. For fu-ture research, higher generalizability could be obtained by including more data from multiple time periods and
medical centers [9] and by optimizing model parameters (i.e., amount of trees and nodes).
We showed that qEEG parameters provide useful in-formation in prediction of outcome after moderate to se-vere TBI during the first days after trauma. Ultimately, using data from multiple modalities that monitor brain function might lead to better decision support tools in moderate to severe TBI patients at the ICU.
Conclusion
Multifactorial Random Forest models using qEEG fea-tures, clinical data, and radiological findings have poten-tial to predict neurological outcome in patients with moderate to severe TBI.
Abbreviations
ADR:Alpha/delta ratio; AUC: Area under the receiver operating characteristic curve; BSI: Brain symmetry index; cEEG: Continuous electroencephalography; CI: Confidence interval; COG: Center of gravity; CT: Computed tomography; EEG: Electroencephalography; GCS: Glasgow Coma Scale; GOSE: Extended Glasgow Outcome Score; ICU: Intensive care unit; IMPACT: International Mission for Prognosis And Clinical Trial Design; ISS: Injury Severity Score; MAD: Median absolute deviation; MAP: Mean arterial blood pressure; PSD: Power spectral density; qEEG: Quantitative electroencephalography; SEF90: Spectral edge frequency 90%; TBI: Traumatic brain injury
Acknowledgements Not applicable
Authors’contributions
MH contributed to the design and conception of the work, data acquisition, and analysis and interpretation of the data and drafted the manuscript. MP contributed to the design and conception of the work and data analysis and interpretation and revised the manuscript. HH contributed to the design and conception of the work and data acquisition and revised the manuscript. CM contributed to the design and conception of the work and the data acquisition. AB contributed to the design and conception of the work and revised the manuscript. MT contributed to the design and conception of the work, data acquisition, and data analysis and interpretation and revised the manuscript. All authors read and approved the final manuscript.
Funding Not applicable
Availability of data and materials
The datasets used and/or analyzed during the current study are available from the corresponding author on reasonable request.
Ethics approval and consent to participate
The institutional review board of the Medisch Spectum Twente waived the need for ethical approval and informed consent.
Consent for publication Not applicable
Competing interests
MP is the co-founder of Clinical Science Systems, a supplier of EEG systems for Medisch Spectrum Twente. Clinical Science Systems offered no funding and was not involved in the design, execution, analysis, interpretation, or publication of the study. The remaining authors declare that they do not have competing interests.
Author details
1Clinical Neurophysiology Group, University of Twente, Drienerlolaan 5, 7522
NB Enschede, the Netherlands.2Department of Neurology and Clinical
Enschede, the Netherlands.3Intensive Care Center, Medisch Spectrum
Twente, Koningsplein 1, 7512 KZ Enschede, the Netherlands.
Received: 12 July 2019 Accepted: 21 October 2019
References
1. Maas AIR, Menon DK, Adelson PD, Andelic N, Bell MJ, Belli A, et al. Traumatic brain injury: integrated approaches to improve prevention, clinical care, and research. Lancet Neurol. 2017;16:987–1048.
2. Murray GD, Butcher I, McHugh GS, Lu J, Mushkudiani NA, Maas AIR, et al. Multivariable prognostic analysis in traumatic brain injury: results from the IMPACT study. J Neurotrauma. 2007;24:329–37.
3. Steyerberg EW, Mushkudiani N, Perel P, Butcher I, Lu J, McHugh GS, et al. Predicting outcome after traumatic brain injury: development and international validation of prognostic scores based on admission characteristics. PLoS Med. 2008;5:e165.
4. Ghajar J. Traumatic brain injury. Lancet. 2000;356:923–9. 5. Young GB. The EEG in coma. J Clin Neurophysiol. 2000;17:473–85. 6. Tjepkema-Cloostermans MC, van Meulen FB, Meinsma G, van Putten MJAM.
A Cerebral Recovery Index (CRI) for early prognosis in patients after cardiac arrest. Crit Care. 2013;17:1.
7. Ruijter BJ, van Putten MJAM, van den Bergh WM, Tromp SC, Hofmeijer J. Propofol does not affect the reliability of early EEG for outcome prediction of comatose patients after cardiac arrest. Clin Neurophysiol. 2019;130:1263–70.
8. Claassen J, Taccone FS, Horn P, Holtkamp M, Stocchetti N, Oddo M. Recommendations on the use of EEG monitoring in critically ill patients: consensus statement from the neurointensive care section of the ESICM. Intensive Care Med. 2013;39:1337–51.
9. Tolonen A, Särkelä MOK, Takala RSK, Katila A, Frantzén J, Posti JP, et al. Quantitative EEG parameters for prediction of outcome in severe traumatic brain injury: development study. Clin EEG Neurosci. 2018;49:248–57. 10. Jasper HH, Kershman J, Elvidge A. Electroencephalographic studies of injury
to the head. Arch Neurol Psychiatr. 1940;44:328–50.
11. Williams D. The electro-encephalogram in acute head injuries. J Neurol Psychiatry. 1941;4:107–30.
12. Moulton RJ, Marmarou A, Ronen J, Ward JD, Choi S, Lutz HA, et al. Spectral analysis of the EEG in craniocerebral trauma. Can J Neurol Sci. 1988;15:82–6. 13. Nuwer MR, Hovda DA, Schrader LM, Vespa PM. Routine and quantitative
EEG in mild traumatic brain injury. Clin Neurophysiol. 2005;116:2001–25. 14. Thatcher RW, Walker RA, Gerson I, Geisler FH. EEG discriminant analyses of
mild head trauma. Electroencephalogr Clin Neurophysiol. 1989;73:94–106. 15. Kane NM, Moss TH, Curry SH, Butler SR. Quantitative
electroencephalographic evaluation of non-fatal and fatal traumatic coma. Electroencephalogr Clin Neurophysiol. 1998;106:244–50.
16. Vespa PM, Boscardin WJ, Hovda DA, McArthur DL, Nuwer MR, Martin NA, et al. Early and persistent impaired percent alpha variability on continuous electroencephalography monitoring as predictive of poor outcome after traumatic brain injury. J Neurosurg. 2002;97:84–92.
17. Hebb MO, McArthur DL, Alger J, Etchepare M, Glenn TC, Bergsneider M, et al. Impaired percent alpha variability on continuous
electroencephalography is associated with thalamic injury and predicts poor long-term outcome after human traumatic brain injury. J Neurotrauma. 2007;24:579–90.
18. Thatcher RW, Walker RA, Gerson I, Geisler FH. EEG discriminant analyses of mild head trauma. Electroencephalogr Clin Neurophysiol. 1989;73:94–106. 19. Haneef Z, Levin HS, Frost JD, Mizrahi EM. Electroencephalography and
quantitative electroencephalography in mild traumatic brain injury. J Neurotrauma. 2013;30:653–6.
20. Stewart CP, Otsubo H, Ochi A, Sharma R, Hutchison JS, Hahn CD. Seizure identification in the ICU using quantitative EEG displays. Neurology. 2010;75:1501–8.
21. Foreman B, Claassen J. Quantitative EEG for the detection of brain ischemia. Crit Care. 2012;16:1–9.
22. Haddad SH, Arabi YM. Critical care management of severe traumatic brain injury in adults. Scand J Trauma Resusc Emerg Med. 2012;20:12. 23. Walia S, Sutcliffe AJ. The relationship between blood glucose, mean arterial
pressure and outcome after severe head injury: an observational study. Inj Int J Care Inj. 2002;33:339–44.
24. Steyerberg EW, Mushkudiani N, Perel P, Butcher I, Lu J, McHugh GS, et al. Predicting outcome after traumatic brain injury: development and international validation of prognostic scores based on admission characteristics [internet]. PLoS Med. 2008; Available from: http://www.tbi-impact.org/?p=impact/calc. Accessed 11 Aug 2018.
25. Marshall LF, Marshall SB, Klauber MR, van Berkum Clark M, Eisenberg HM, Jane JA, et al. A new classification of head injury based on computerized tomography. J Neurosurg. 1991;75:S1–66.
26. Sheorajpanday RVA, Nagels G, Weeren AJTM, van Putten MJAM, De Deyn PP. Reproducibility and clinical relevance of quantitative EEG parameters in cerebral ischemia: a basic approach. Clin Neurophysiol. 2009;120:845–55. 27. van Putten MJAM. The colorful brain: visualization of EEG background
patterns. J Clin Neurophysiol. 2008;25:63–8.
28. Shannon CE. A mathematical theory of communication. Bell Syst Tech J. 1948;27(379–423):623–56.
29. Kannathal N, Choo ML, Rajendra Acharya U, Sadasivan PK. Entropies for detection of epilepsy in EEG. Comput Methods Prog Biomed. 2005;80:187–94. 30. Phung D, Tran D, Ma W, Nguyen P, Pham T. Using Shannon entropy as EEG
signal feature for fast person identification. Eur Symp Artif Neural Networks, Comput Intell Mach Learn. 2014:413–8.http://www.i6doc.com/fr/livre/ ?GCOI=28001100432440.
31. Breiman L. Random Forests. Mach Learn. 2001;45:5–32.
32. Kim SY. Effects of sample size on robustness and prediction accuracy of a prognostic gene signature. BMC Bioinformatics. 2009;10:4–7.
33. Ianof JN, Anghinah R. Traumatic brain injury: an EEG point of view. Dement Neuropsychol. 2017;11:3–5.
34. Rae-grant AD, Barbour PJ, Reed J. Development of a novel EEG rating scale for head injury using dichotomous variables Triphasic waves.
Electroencephalogr Clin Neurophysiol. 1991;79(5):349–57.
35. Leon-Carrion J, Martin-Rodriguez JF, Damas-Lopez J, Barroso y Martin JM, Dominguez-Morales MR. Delta-alpha ratio correlates with level of recovery after neurorehabilitation in patients with acquired brain injury. Clin Neurophysiol. Int Fed Clin Neurophysiol; 2009;120:1039–1045.
36. Arciniegas DB. Clinical electrophysiologic assessments and mild traumatic brain injury: state-of-the-science and implications for clinical practice. Int J Psychophysiol. 2011;82:41–52.
37. Modarres MH, Kuzma NN, Kretzmer T, Pack AI, Lim MM. EEG slow waves in traumatic brain injury: convergent findings in mouse and man. Neurobiol Sleep Circadian Rhythm. 2017;2:59–70.
38. Wang B, Bai Q, Jiao X, Wang E, White PF. Effect of sedative and hypnotic doses of propofol on the EEG activity of patients with or without a history of seizure disorders. J Neurosurg Anesthesiol. 1997;9:335–40.
39. Godoy DA, Rubiano A, Rabinstein AA, Bullock R, Sahuquillo J. Moderate traumatic brain injury: the grey zone of neurotrauma. Neurocrit Care. 2016; 25:306–19.
40. Lee H, Mizrahi MA, Hartings JA, Sharma S, Pahren L, Ngwenya LB, et al. Continuous Electroencephalography After Moderate to Severe Traumatic Brain Injury. Crit Care Med. NLM (Medline); 2019;47:574–82.
41. Young GB, Ives JR, Chapman MG, Mirsattari SM. A comparison of subdermal wire electrodes with collodion-applied disk electrodes in long-term EEG recordings in ICU. Clin Neurophysiol. 2006;117:1376–9.
42. Das RR, Lucey BP, Sherry AE, Ae H-YC, Espinosa PS, Amir AE, et al. The utility of conductive plastic electrodes in prolonged ICU EEG monitoring. Neurocrit Care. 2008;10:368–72.
43. O’Sullivan M, Temko A, Bocchino A, O’Mahony C, Boylan G, Popovici E. Analysis of a low-cost EEG monitoring system and dry electrodes toward clinical use in the neonatal ICU. Sensors (Basel). NLM (Medline). 2019;19:1–16.
44. Kamousi B, Grant AM, Bachelder B, Yi J, Hajinoroozi M, Woo R. Comparing the quality of signals recorded with a rapid response EEG and conventional clinical EEG systems. Clin Neurophysiol Pract. 2019;4:69–75.
Publisher’s Note