Rochester Institute of Technology
RIT Scholar Works
Theses
Thesis/Dissertation Collections
5-1-2005
A comparative analysis between the RIT Contrast
Resolution Test Target And the Gutenberg Test
Target
Deepak Dubey
Follow this and additional works at:
http://scholarworks.rit.edu/theses
This Thesis is brought to you for free and open access by the Thesis/Dissertation Collections at RIT Scholar Works. It has been accepted for inclusion
in Theses by an authorized administrator of RIT Scholar Works. For more information, please contact
Recommended Citation
School of Print Media
Rochester Institute of Technology
Rochester, NY
Certification of Approval
Master's Thesis
This is to certify that the Master's Thesis of
Deepak Dubey
has been approved by the Thesis Committee as satisfactory
for this thesis requirement for the Masters of Science degree
at the convocation of
April 2005
Thesis Committee:
Dr. Edward Granger
Primary Thesis Advisor
Franz Sigg
Secondary Thesis Advisor
Thesis Consultant
Dr. Twyla Cummings
Graduate Thesis Coordinator
Dr. Twyla Cummings
Graduate Program Coordinator
A
Comparative Analysis between
the
RIT Contrast
Resolution Test Target
And the
Gutenberg
Test Target
By
Deepak
Dubey
A
thesis
submittedin
partialfulfillment
ofthe
requirements
for
the
degree
ofMasters
ofScience in
the
school of
Printing
Management
andScience
ofthe
Rochester
Institute
ofTechnology
May
2005
Thesis
Advisor:
Dr.
Edward
Granger
Permission to Reproduce
I. Title
of
thesis
"
A
Comparative Analysis between the RIT Contrast Resolution
Test Target and the Gutenberg Test Target
".
I
, Deepak Dubey,
hereby grant
permission to
the
Wallace Memorial Library ofRIT
to
reproduce my thesis in
who
le
or in part. Any reproduction will not
be
for commercial or profit.
Date
:
May 21, 2005
2.
Title
of
thesis
"A
Comparative Analysis between the RIT Contrast Resolution
Test Target and the Gutenberg Test Target
"
.
I, Oe
epak
Dube
y,
prefer to be
co
nt
acted eac
h tim
e a
r
eq
u
es
t
for
r
ep
r
o
du
c
ti
on
is made.
[
can
be reached
a
t
following
e
address:
Acknowledgement
I
wouldlike
to thank
my
advisors;
Dr. Edward
Granger,
Prof. Franz
Sigg,
andDr.
Twyla
Cummings for
their
guidance,
help,
and patienceduring
the
completionofthis thesis.
In
addition,
I
wouldlike
to thank
all ofthe
observers,
who participatedin
the
tests,
as
their
resultsare a vital part ofthe
researchin
this thesis.
Table
ofContents
List
oftables
viList
ofFigures
viiAbstract
ix
Chapter 1
1
Endnotes for Chapter
1
5
Chapter 2
Theoretical Bases
ofStudy
6
Introduction
6
Definitions
6
Bit Depth
6
Dots
7
Marks/Spots
7
Marking
Engines
8
Raster Image Processor
(RIP)
8
Methods
ofTransferring
Images
8
Binary
System
8
Bit
Depth/ Multilevel
Inking
System
9
Screener
9
Screening
Methods
9
Amplitude
Modulation
10
Frequency
Modulation
10
Gaussian Blur
10
Contrast
11
Resolution
12
Pixels
perinch
(ppi)
13
Samples
perInch
(spi)
13
Dots
perinch
(dpi)
14
Halftone Cell (Dot
Matrix)
14
Screening
Methods
16
Ordered Dither
16
Clustered
dot
16
Screen Angle
17
Screen
Frequency
17
Dot Pattern
18
Level
Assignments
18
Rational Tangent
19
Super Cell
20
Multicenter Dot
21
Dispersed Dot
21
Test Targets
24
RIT Contrast Resolution Test Target
25
Evaluation
ofRIT Contrast Resolution Test Target
27
Gutenberg
Test Target
28
Evaluation
ofGutenberg
Test
Target
29
Endnotes for Chapter 2
30
Chapter 3
Review
ofLiterature
31
Endnotes
36
Chapter 4
Hypotheses
37
Chapter 5
Methodology
38
RIT
Contrast
Resolution
Test
Target
38
Construction
ofTarget
38
Evaluation
oftarget
40
Gutenberg
Test Target
43
Construction
ofTarget
43
Evaluation
oftargets
43
Chapter
6
Results
45
RIT Contrast Resolution
Test Target
45
Gutenberg
Test
Target
51
Chapter 7
Summary
andConclusions
57
Summary
57
Conclusion
62
Recommendation
for Further Studies
63
Bibliography
65
Appendix A
Two-way
Analysis
ofVariance data
68
List
ofTables
Table 1:
Size
series usedfor
Gutenberg
Images
29
Table 2:
Gaussian
Blur
values usedfor the targets
40
Table 3:
Relative
CRV
measurementsfor
eachobserverfor
eachGaussian blur
valuesfor RIT
Contrast
Resolution Test Target
45
Table 4:
Two-way
ANOVA
without replicationusing
an alphalevel
of0. 0 for RIT Contrast
Resolution Test
Target
46
Table 5:
Relative CRV
measurementsfor
eachobserverfor
eachGaussian blur in ascending
order
for blur
andobserversfor RIT
Contrast
Resolution Test Target
47
Table 6:
Normal distribution
percentilefor
each observer on each systemRIT Contrast
Resolution Test Target
49
Table
7:
Ranking
for
each observerfor
eachGaussian blur
valuesfor
Gutenberg
Test
Target
51
Table 8:
Two-way
ANOVA
without replicationusing
an alphalevel
of0.01 for
Gutenberg
Test
Target
51
Table 9:
Relative Rankings for
eachobserverfor
eachGaussian blur in ascending for
blur,
andobservers
for
Gutenberg
Test
Target
53
Table 10:
Normal distribution
percentilesfor
each observerfor
eachblur
valuefor
Gutenberg
Test Target
55
Table 1 1
:Two-way
ANOVA
without replicationusing
analphalevel
of0.01 for the RIT
Contrast
Resolution
Test Target
69
Table 12:
Two-way
ANOVA
without replicationusing
an alphalevel
of0.01 for the
Gutenberg
List
ofFigures
Figure 1:
Examples
ofAM
andFM screening
10
Figure 2:
Bell
Shape
Probability
curve11
Figure 3
:Low
contrastimage
11
Figure 4:
High
contrastimage
11
Figure 5
:As
input
resolutionincreases,
pixel sizedecreases
14
Figure 6:
The
possible combinationsfor
filling
a2X2 dot
matrix15
Figure 7:
The 16
possible perturbationsfor
a2X2 dot
matrix15
Figure 8
:Screen
angles usedfor
conventionalfour
colorprinting
17
Figure 9
:Rational Tangent dot
placement ondigital
grid19
Figure 10:
Super Cell Irrational Tangent dot
placementondigital
grid20
Figure 1 1
:Multicenter Dot Super Cell Irrational Tangent dot
placementondigital
grid21
Figure 12:
FM
screenings22
Figure 1 3
:First
order andSecond
orderFM
screenings23
Figure 14:
Black Quadrant Diagram
25
Figure 15:
Gutenberg
Test Target
28
Figure 16:
RIT Contrast Resolution Test Targetform
39
Figure 17:
Contrast sensitivity
curvesandrelativeCRV
valuesin
xdirection for Observerl
41
Figure 1 8
:A three-dimensional distribution
of contrast-resolution-volume42
Figure 19:
Gutenberg
Test
Target form
43
Figure 20:
Blur
values versusCRV
valuesfor RIT Contrast
Resolution Test Target
48
Figure 2 1
:Normality
test
of observersfor RIT Contrast Resolution
Test Target
49
Figure 22:
Blur
versusRanking
for
Gutenberg
Test
Target
54
Figure 23
:Normality
test
ofobserversfor
the
Gutenberg
Test Target
Ranking
55
Figure 24:
Relationship
between
the
averageCRV
andthe
average rankings versusthe blur
Values
59
Figure 25:
RIT Contrast Resolution Test Target Form
72
Abstract
In
additionto
color,
the
othertwo
mostimportant
propertiesthat
determine quality
ofreproduction of a
printing/imaging
system are contrast and resolution.Contrast
andresolution
limitations
of an outputdevice
partially
define
output quality.These
limitations
canbe
attributedto
variousfactors
such asthe
screening
method usedby
the
RIP,
the
image
transfer
methodofthe
outputdevice,
the
substratesused,
and capabilitiesof
the
postscriptinterpreter
or a combination of allthese
factors.
This study introduces
a newtest target
for
quality
evaluation calledthe
Gutenberg
Test Target.
A
comparative analysisbetween
the
Gutenberg
Test Target
and theRIT
Contrast Resolution Target has been
performed.Both
targets
have been developed
collectively
by
Dr. Edward Granger
andFranz
Sigg
andboth
are usedto
measurethe
contrast and resolution
limitations
of animaging
system.The
Gutenberg
target
uses a visual subjective comparisonto
evaluate overall outputquality
of animaging/printing
system.On
the
otherhand,
the
RIT Contrast Resolution
Target
uses a method of analysisto
calculate a Contrast-Resolution-Volume
(CRV)
value,
whichthen
is
used as a relativeindicator
ofthe
reproductionquality
ofthe
imaging/printing
system.For
this
study both
test
targets
were printedon aselectedimaging /printing
systemwith
varying degrees
ofimage deteriorations
(Gaussian
Blur)
applied onthe
images. The
image deteriorations
simulateddifferent Modulation Transfer Functions
(MTF)
for
different devices. The
printedtest targets
were analyzedby
performing
two
visualexperiments,
onefor
eachtarget,
using
a number of observers.The
generateddata from
the
experiment was usedfor
mathematical analysis and a comparison was madebetween
the two targets.
The
final
analysis and results showedthat
both
targets
do
a goodjob in
measuring
Chapter 1
Introduction
In
the past,
extensiveresearchhas been
conductedin
the
graphic artsindustry
to
identify
various
quality
parametersthat
candetermine
capabilities ofprinting/imaging
devices
by
means of
test
targets, but relatively limited
workhas been done
ondetermining
performance of a
printing/imaging
system as a whole.A printing/imaging
systemis
a set of various stand-alonedevices
connectedby
asingle
workflow;
examples of stand-aloneprinting/imaging
devices
arefilm-setters,
plate-setters,
proofing
devices,
or(digital)
presses.Depending
onthe
configurationofthe
devices
usedfor
the
system,
aprinting/imaging
system couldbe
divided into
threecategories:
digital,
analog,
andhybrid.
A
digital
systemis
one whichonly
usesdigital
devices
in
the workflow;
ananalog
system usesonly analog
devices
such asanalog
film
preparation,
platemaking
and offsetlithographic
press,
whereas a systemusing
both kind
of
devices
wouldbe
ahybrid
printing
system.The
tools
whichare usedto
determine
the
outputquality
of a givenprinting/imaging
device
or of a system areknown
asTest Targets.
A Test
Target
canbe
usedto
determine
the
capability
ofindividual devices
as well asthe
comprehensivecapability
of a systemas a whole.
When
processedthrough
adevice
or asystem,
atest
target
provides usefulgenerated
is further
usedfor optimization,
calibration, characterization,
and processcontrol
to
extractthe
best
possible outputfrom
ofthe
process.There
aretwo types
oftest
targets,
naturalimages
orsynthetic,
patterns oflines,
circles,
halftone
patches whichtoday
aredigitally
programmed(PostScript).
Each
elementin
atarget
is
capable oftesting
one or more characteristic ofthe
device
or system.While
some ofthe
elements/targets
aresubjective,
i.e.
canbe
evaluatedvisually
orby
any
other subjective assessmentmethod,
othertargets
requirethe
use ofmeasuring devices
such as adensitometer,
colorimeter or a spectrophotometer.Such
targets
are called objectivetargets.
Some
examples oftest targets
are parallellines,
checkerboards,
and startarget
(to
measuredirectional
effects),
and registrationtarget,
natural
SCID
test
images
asdefined
by
ISO
12640,
solid areapatches(ink
density),
tints
and overprints.
Test
targets
canbe
used atany
stage of aprinting
system.They
are usedto
measureand control various output
quality
parameters such ascolor,
colorgamut,
density,
tonal
quality (tone
reproduction anddetails in
highlight,
shadows andmiddle-tones),
line
quality
(width,
blurriness,
andraggedness), text
quality
and effective resolution.Most
ofthe
digital
test targets
availablein
the
graphic artsindustry
are used withoutput
devices
such asfilm-setters,
plate-setters,
proofing
devices,
digital
presses,
anddesktop
printers.Image
Quality
reproducedby imaging
systemsis
adirect
function
oftheir
addressability.
Output devices
aregenerally
divided
into
two
categoriesdepending
uponof asystem
is defined
asits
ability
to
reproducefine detail
ofan image1that
is
afunction
of
the
outputdevice's
mechanicalability
to
image
small spots(addressability)
andits
ability
to
renderdensity
difference
between
the
foreground
andthe
background
(contrast).
Different
devices
usedifferent
methodsto
generatedetail
and contrastto
reproducean acceptable
quality
ofimage. A
high-addressability imaging
device
usesits high
addressability,
i.e.
the
mechanicalability
ofthe
systemto
putvery
small spotsinside
ahalftone
cell,
to
generategrey levels.
On
the
otherhand,
alow-addressability imaging
device has
a smaller number ofspots within a
half
tone
cell andtherefore,
does
nothave
the
physicalability
to
generateenough
gray levels
to
produce a goodquality image. To
compensatefor
this
shortcoming
low
addressability
imaging
devices
canimage
a given spot at various colorlevels,
utilizing
bit depth
or multilevelinking
ability,
andtherefore,
can produceimage
quality
comparable
to
high
addressability
devices.
The
numberofgray levels
at which a singlespotcan
be imaged is
expressedas abinary
countandis
referredto
asbit depth.
A
system underany
given circumstances reproducesthe
finest detail
at maximumcontrast
(100%,
only
fully
black
or clearimage
areas)
because
nohalftones
are needed.As
the
contrastbetween
the
detail
andthe
background becomes less
than
100%,
ascreening
methodbecomes
necessary to
simulatethe
density
difference. The
simulationgenerated
by
the
screener/screening
method causesloss
of resolutionbecause
ofthe
halftone dots. As
the
density
difference is further
reduced,
after a certainpoint,
the
the
detail
andthe
background.
Such
limitations
are causedby
interactions between
various
frequencies,
which arethe
screening
method,
the
addressability
ofthe
outputdevice,
andthe
resolution(ppi)
ofthe
originalimage.
Knowing
the
resolution contrastcapability
ofsystemsavailable canhelp
in making
abetter
decision
about whetherthe
systemis
suitablefor
aparticularjob. It
can alsohelp
in
using
the
systemto
its
maximumcapability
to
extract optimum results.This
thesis
employstwo test
targets,
the
RIT Contrast
Resolution Target
andthe
Gutenberg
Test
Target,
developed
by
Dr. Edward Granger
andProf. Franz
Sigg,
for
measuring
the
contrastandaddressability limitations
ofimaging
systems/devices.2
The RIT Contrast Resolution
Target,
along
withits
method ofanalysis,
calculates acontrast-resolution-volume
(CRV)
valuefor
the
system.Elliot
Harper,
in his
master'sthesis,
provedthat
the
RIT
Contrast
Resolution
Target
provides a method ofdiscriminating
CRV
ofmarking
engines andscreening
methods.3
This
thesis
introduces
a newtest target
calledthe
Gutenberg
Test Target. The
Gutenberg
Test Target
has been
collectively
developed
by
Dr. Edward Granger
andProf.
Franz
Sigg
for
measuring
the
resolutionquality)
limitation
of animaging
system/device.
The
purpose ofthis thesis
is
to
perform a comparative analysisbetween
the
RIT
Contrast Resolution Target
andthe
Gutenberg
Test
Target,
to
determine
whetherthe
Gutenberg
Test Target
candiscriminate between different printing
systems andwhetherit
provides an easier method
for
evaluating
printquality
than the
RIT Contrast Resolution
Endnotes for Chapter 1
1. Franz
Sigg,
"Definition of
Imaging
Terms
(5lhdraft)"(Rochester,
NY:
RIT,
2003).
2. Franz
Sigg,
"RIT Contrast Resolution Test
Target"(Rochester,
NY:
RIT,
2000)
3. Eliot
Harper,
"An Investigation
into
the
Relationship
between Contrast
andResolution"
(Masters
Thesis, Rochester,
NY:
RIT,
2000).
4. Franz
Sigg,
"Workflow
to
makeGutenberg
target"
(Private
communication,
Rochester,
Chapter 2
Theoretical Bases
ofStudy
Introduction
In
orderto
understand andinterpret
the
contrast resolutiondifferences between different
printing
systems,
it is first necessary
to
identify
the
underlying
principles and mechanicsbehind
imaging/printing
processes.This
chapter provides an explanation andidentifies
the
fundamental differences between
contrast and resolution andthe
effect ofthe
screening
method,
and explainsthe
structure and evaluation methods ofthe
RIT Contrast
Resolution
Test
Target
andthe
Gutenberg
Test Target.
Before
any
further
discussion,
it
is
important
to
understand somebasic
concepts,
definitions,
andterminologies
regarding
contrastand resolution.Definitions
Bit Depth
Bit
Depth
is defined
asthe
number ofbits
oftonal
rangecapability
ofthe
spots of anoutput
device. For
example,
a graphic artsfilm
orplate setterhas
abit depth
ofone,
i.e.
the
number ofbits
oftonal
rangecapability
ofthe
pixelin
animage.
For
example,
RGB
24 bit
colormeansapixeldepth
of8 bits
per coloror 28(256)
levels
per color1.Dots
In
terms
ofprinting,
adot is
the
smallest screener element.For
abinary
outputdevice
having
high addressability
and abit depth
of oneusing
amplitude modulation(AM)
screening,
adot is
composed ofmany
spots.This dot is commonly known
as ahalftone
dot
andits
fineness
is
measuredin "lines
per inch"or
lpi. In
the
case of adisplay
device
that
has
alarge bit depth (8 bits
or256
tone
values)
at alow addressability (72
spi.),
adot
has
the
same size as one spot.Marks/Spots
Marks
arethe
physical elementsthat the
outputdevice
orthe
marking
engine places atthe
addressability locations
that
in
turn
are called spots.A
markcanhave
adifferent
sizeand shape
than
one spot(addressability
location). The
size ofthe
spotis determined
by
the
addressability
ofthe
outputdevice. A
typical
computer monitorhas
72
spots perlinear
inch
while afilm imagesetter may have
morethan
4000. A
typical
digital
pressprints at
600
spots perinch
with afew
modelsprinting
at800
or more perlinear inch.
The
"spot"is
often confused withthe
"dot" asin "dots
perinch",
but
a printeddot is
actually
madeup
of agroup
of spots.It
is
commonto
referto the
addressability
of anMarking
Engines
Marking
engines arethose
physicaldevices
that
place marksonthe
addressability
grid onthe
output medium .The
term
is usually
appliedto
imagesetters,
platesetters,
anddigital
printers.
Raster Image Processor
(RIP)
An RIP is
a computer programthat takes the
input information from
animage
andgenerates a spot
map,
i.e.
patterns ofspots arranged as abitmap
which creates a visualrepresentation of
the
originalimage
onthe
outputdevice3.
Methods
of
Transferring
Images
There
aretwo
main methods usedin
transferring
images
to the
substrates:1
.Binary
system.2.
Bit Depth
system/Multilevel
inking.
Binary
Method.
Output
devices
such asimagesetters,
platesetters andmany digital
printers
/
proofing
devices
are calledbinary
devices
because
they
useonly
one or zeroto
control
the
on/off statefor
each spot.In
this method,
ahalftone
cellis
madeup
ofmany
spotsand
the
different levels
ofgray
are achievedby
turning
some pixels on or off withina
halftone
cell.Systems
employing
this
method needhigh addressability in
orderto
Bit Depth /
Multilevel
Inking
Method.
These
systems are ableto
generatedifferent
tone
values
by
applying varying
amounts ofink
on a given spot.Systems
having
low
addressability
have
multilevelinking
capability
to
producethe
levels
ofgrey
requiredto
reproduce
high quality
images.
Screener
It
is
that
part ofRIP
which calculatesarea modulation or multilevelinking
valuesof eachspot
for
anoutputdevice,
onthe
basis
of requiredtonal
value ofthe
projected pixelfrom
the
input
image,
in
orderto
form halftone dots. The function
of a screeneris
very
device-dependent. The
screenertries to
rendertone
valuesthat
representthe
information
ofthe
input
pixel grid4.Screening
Method
These
arethe
methods usedby
the
screenerto
form halftone dots
onthe
addressability
grid of
the
outputdevices
with abit
depth
of1 (binary).
There
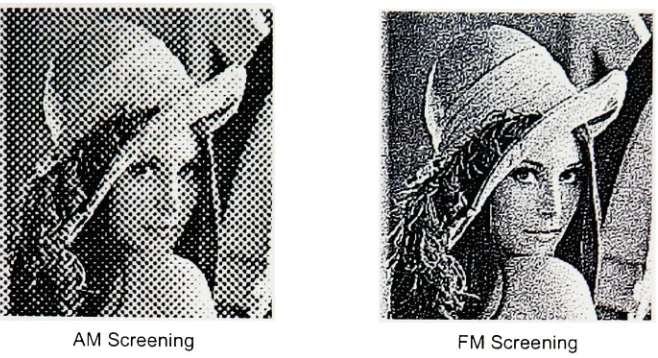
aretwo types:
1.
Amplitude Modulated
Screening
(AM).
>...-'.::: >co:^
AM
Screening
FM
Screening
Figure
1
.Examples
ofAM
andFM
screening
Amplitude Modulation
Screening
(AM). In
this
screening
method,
different dot
sizes areachieved
by
turning
spots on or off within ahalftone
cell.The
distance between
the
centers of
the
halftone dots is
constant;
the
placement ofspotswithinthe
dot is
clustered;
that
is,
spots are centered withinthe
halftone
cellto
producedifferent
tonal
values.Frequency
Modulation
Screening
(FM). The dot
shape and size arekept fixed but
areplaced
randomly
onthe
addressability
grid ofthe
outputdevice. The
placement ofspotswithin
the
halftone
cellis
dispersed;
that
is,
spots are placedrandomly
withinthe
halftone
cell
to
producedifferent
tonal
values.Gaussian Blur
A Gaussian probability
curveis
the
classicbell-shaped
curve withahigher probability in
the
center ofthe
curve andlower
probabilitieson either side.A Gaussian
blur
effecttakes
[image:22.503.91.420.50.229.2]has
greater effect nearits
originallocation
andlesser
effect(in
abell
curvedshape)
farther
away from its
originallocation5.
ft*)
Figure
2. Bell
Shaped
Probability
curveContrast
The
term
refersto the
visualdifference between
two
adjacent parts of animage.
Black
and white colors
have
the
greatest contrast.In
animage,
the
density
difference between
the
lightest
andthe
darkest
area characterizesits
tonal
range withthe
lightest
andthe
darkest
points asthe
endpoints.An
image is
consideredto
be high
contrastif
there
is
alarge
density
difference between its lightest
andits darkest
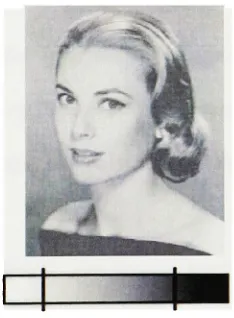
regions.Figure 3
is
anexample of a
high
contrastimage.
Figure
3.
High
contrastimage
Figure 4. Low
contrastimage
[image:23.503.189.315.120.223.2] [image:23.503.286.403.473.632.2] [image:23.503.104.218.473.630.2]The
scalebelow
the
picture showsthe
range ofgray
scale usedbetween
the
lightest
and
the
darkest
image
areas; the
large
gap
between
the two
pointsonthe
scale showsthat
the
image has
ahigh
contrast.Figure 4 is
an example of alow
contrastimage.
The
smallergap between
the
lightest
and
the
darkest
image
areasindicates
that
the
image
has
alow
contrast.The
aboveillustrated
exampleonly
refersto
contrastin
grayscaleimages;
differing
levels
ofcontrast can alsooccur
in
colored objects.Resolution
Resolution is
aterm that
describes
the
capability
of animaging
systemto
reproduce smalldetail
of animage.
People
often confuse resolution and addressability.Unlike
resolution,addressability
is
strictly
afixed,
mechanical characteristic ofthe
outputdevice.
Resolution
onthe
otherhand
relatesto the
subjective perception of animage.
Resolution
cannotbe
a singlenumber
because it
is
afunction
of contrast.More
resolutionis
obtained athigh
contrastthan
atlow
contrast.Addressability
is
one ofthe
contributing
factors for both
resolution,
andgray levels
(which
in
turn
relatesto
contrast).Other
contributing
factors
arethe
screening
method,
registrationof
the
colors andthe
sharpness ofthe
input image (which is
relatedto
image
processing
andthe
numberof pixels ofthe
image).
When
describing
spatial aspects of an outputdevice,
the
properterms
to
use areThere
aredifferent
quantitative unitsaffecting
resolution;
pixels perinch
(ppi),
samples per
image
(spi),
anddots
perinch
(dpi). The
following
definitions
ofthese
unitsare used
in
this
report:Pixels
perInch
(ppi)
A
pixelis
the
smallest picture element of adigital image. Pixels
are usedto
indicate
the
total
amount ofinformation
that
adigitized
image
containsin its horizontal
and verticaldimensions. The
term
"pixels
per inch" refersto
the
number of pixelsin
aninch
contained
in
adigital image. It is
usedto
measurethe total
amount of rasterinformation
within an
image.
For
adisplay
device,
resolutiondefines
the
number ofdiscreet
horizontal
and vertical visualelements.It
is
also calledscreenresolution.Pixels
aredata,
not a physical
element,
and referonly
to the
input
side of animage. On
the
outputside,
there
are nopixels,but
spots orhalftone dots.
Samples
perImage
(spi)
A
sample perimage is
the
correctterm
for referring
to the
input
resolution of scannersand
digital
cameras.For
suchdevices,
the term
pixel perinch
refersto the
sampling
rateof
the
device
andthe
amount of pixelinformation in
the
image. Input devices
offer avariable range of resolutions.
As
the
sampling
rate of animage
increases,
the
pixel sizedecreases,
thus
enhancing
the
image
resolution.This
is illustrated in Figure 5.
50
ppi100
ppi300
ppiFigure
5.
As
input
resolutionincreases,
pixelsizedecreases
Dots
perInch
(dpi)
This
term
is
used somewhatloosely by
the
industry.
Normally,
people usethis term to
describe
the
addressability
of an outputdevice.
However,
an outputdevice images
spotsnot
dots. The
term
dot properly
refersto
halftone dots.
In AM
screening,
ahalftone dot is
placed at
the
center of ahalftone
cell,
and consists of a number ofspots.The
correct unitfor addressability is
spots perinch
(spi)
and notdots
perinch (dpi).
Halftone Cell
(dot matrix)
A
halftone
cellis
madeup
ofagrouping
of spotsto
form
adot
structure.The
size ofahalftone
cellis defined
by
the
number of spotsalong
its
x andy-axis anddetermines
the
tonal
rangeit
can achieve.A halftone
cell uses allthe
possible spot positionsto
constructa
dot. Figure
6
shows a2X2 halftone
cell.In
this
cell,
the
possible conditionsfor
filling
In
ahalftone
cell, the
discreet
tonal
values(or gray
levels)
are restrictedby
the
maximum number of spotpositions available within
the
cell,
plus one(no
spot,
blank).
[image:27.503.106.359.320.606.2]Hence,
for
a cell size of4X4,
the
maximum numberofspotswouldbe 17 (4X4+1
).
Figure 6. The
possible combinationsfor
filling
a2X2 dot
matrixA
halftone dot
uses allthe
possible combinations of spotsto
achievedifferent
tone
values.
These
types
ofmarking
combinationsareknown
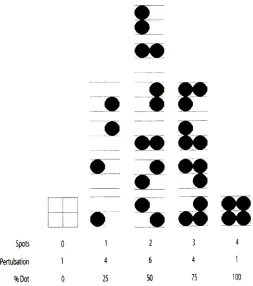
as perturbations.Figure
7
showsthe
various possible combinations of spots within a2X2
matrix.tr
z
Spots
0 12
3Pertubation 1 4 6 4
%0ot
0 2550
75
100Figure 7. The 16
possible perturbationsfor
a2X2
dot
matrixAs
shownin figure
7,
for
each number ofspots, there
are several perturbations available.The
exceptions are zero spots and maximumspots,
whereonly
one possible perturbationis
possible.Although
such groupings are equalin dot
area coverage or percentagedensity,
they
vary in dot
structure.Therefore,
a2X2
cellhas
a minimum of5
gray
levels
andhas
atotal
numberof16
spotconfigurations.Screening
Methods
One
ofthe
mainfactors
which controlthe
contrastand resolutioncapabilitiesof an outputdevice is
the type
ofscreening
method used.Generally,
there
aretwo types
ofscreening
methods usedin
graphic artstoday,
AM screening
andFM
screening.This
section explains eachscreening
methodandnotesits
effect on contrast and resolution.Ordered
Dither
Ordered dither
is
a method ofproviding
afixed
sequence ofturning
pixels on within ahalftone
cellto
generatethe
gray levels. There
aretwo
mainapproaches;
clusteredspots anddispersed
spots.Clustered
spots.At
a giventone-level,
clustered-spot-ordereddither
turns
adjacentpixels'
spots
on,
forming
a clusterin
the
cell.This grouping
of pixels resultsin
substantiallow-frequency
components.The dot-to-dot
spacing
is fixed
andthe tone
level
is
modulatedby
dot
sizewithinthe
halftone
cell.This
technique
is
alsocalledthe
"amplitude
modulation"Amplitude
Modulated
(AM)
Screening
In
four
colorAM
screening, the
RIP
convertsthe
image into four
separateC, M, Y,
and
K
images,
and applies an amplitude modulatedhalftone
screen patternto
eachchannel.
The
halftone dots
in
each screened channel are arrangedat a given angle.The
amplitude modulated
screening is described
by
a set of parametersconsisting
ofascreen
angle,
screenfrequency,
dot
pattern,
andlevel
assignment(tone).
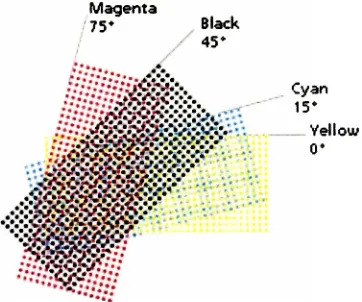
Screen Angle.
Using
AM screening for printing
morethan
onecolor,
the
separatedcolor screensmust
be
rotatedto
preventscreening interference
patterns,
such as moireor rosettes.
The
ideal
anglebetween
two
colors which reducesinterference
patternsto
a minimum
is 30.
For
colorprinting,
the
conventional approachfor
screen anglesis
to
set
black
at45
,
cyan and magenta at30
,
andthe
yellowat0
(Figure
8).
Magenta
75* Black
45-Figure 8. Screen
anglesusedfor
conventionalfour
colorprinting
Screen
Frequency.
It
is
a measurement ofthe
number ofhalftone
dots
within a givenunitofmeasurement.
This
is
commonly
givenas ameasurementoflines
perinch
(lpi)
[image:29.503.155.336.384.535.2]or
lines
per cm(cm'1).
By
increasing
the
screenfrequency,
the
dot
sizedecreases,
andthe
halftone
frequency
patternbecomes less
apparent withinthe
image. A low
frequency
gives a coarse appearance whereas ahigh
frequency
produces afine
andsmooth appearance.
Also,
by
increasing
the
screenfrequency
the
number oftone
levels
achievableby
ahalftone
dot
gets reduced.Two
important factors
in considering
screenfrequency
arethe
image
content anddevice
capability.If
the
image
contains areasoffine
detail,
then
a coarse screen wouldbe
inappropriate because
detail
wouldbe lost.
However,
ahigh
screenruling,
whichmeans small
halftone
dots,
reducesthe
number ofgray levels
that
canbe imaged.
Therefore,
acompromise mustbe found between
resolutioncapability
andgray level
capability
Dot Pattern.
The
dot
patternis
the
fill-in
orderfor
the
dot
growth sequence andis
directly
relatedto
image
texture.
It
has
astrong
impact
onthe
outputquality
of animage.
A
digital halftone dot
cannot growuniformly
asin
conventionalscreening
because
ofthe
fundamental
discrete
nature ofthe
addressability
grid.The
dot
canonly
grow
by
adding
one printer spot at atime.
In
doing
so,
it is
easy
for
the
dot
to
become
lopsided
orasymmetrical,
producing
visual artifactsthat
showup
as undesirabletexture
andcoarse patternsin
the
printing.Within
the
family
ofclustered-dot-ordered
dither
methods,
there
arefour
maintechniques
and variationsfor AM
halftone
dot
generation.These
are rationaltangent,
super
cell,
andmulti-centerdot.
A
digital half-tone
cellis
constructedin
a pixel grid.Depending
onthe
relativepositioning
ofthe
cell with respectto
the grid,
angled screens are classified as rationaland
irrational
tangents.
Rational Tangent
A
screenis
called a rationaltangent
if
the
four
corners ofthe
halftone
cellfall exactly
on
intersection
points ofthe
pixel grid8.It
is
shownin Figure 9.
Figure 9. Rational Tangent
dot
placement onadigital
gridRational
tangent
cellshave
exactly
the
same size andshape;
they
line up
the
sameway
with respectto
the
digital
grid.Only
one screenfunction
is
neededfor
allhalftone
cells.
However,
the
match of cell cornersto the
digital
gridlimits
the
number ofchoices available
for
angles andfrequencies.
This
makesit difficult
to
avoid moire andartifacts unless
large halftone
cells are usedby
printing
at coarserline
screens.Super
cellsAngles
ofparticularinterest
such as 15and 75
cannot
be accurately
producedby
rational
tangent
screensif
the
cell sizeis
small.The
problemis
reducedby
using
large
halftone
cells,
having
large integers
for
the tangent ratio,
which allowsfor
smallerangular
increments.
It
is
therefore
possibleto
achieve close approximationsat 15and
75
angles.
The
solutionto
this
problemis
to
divide
the
large
cellinto many
smallersub cells
to
increase
the
screenfrequency9.
Using
this
technique,
accurate angles canbe
produced.This
approachis
called supercellscreening
andis
shownin Figure 10.
[image:32.503.130.359.294.520.2]l.I.J.J..>_-L-I-J--'-.l.l.J.. .L.1.J.V..V.1
Figure 10. Super Cell Irrational Tangent dot
placement onadigital
gridA
supercellis
arationaltangent
screen composed ofmany
smaller sub cells which areMulticenter dot
As
shownin Figure
12,
amulticenterdot
cellis
divided
into approximately
equalpartsusually
two
orfour. Each
partialdot has
a nucleus and growsinto
a separate cluster.The
purposeis
to
increase
the
apparent screenfrequency
withoutreducing
the
numberof
tone
levels10.
An
exampleis
shownin Figure 1 1
where a40-level dot is divided into
four
sub cells with10
spots each.t
1
251-29
*.' ' *
?'1
1
j
5
33.'27l'3t,
^1
1 1
.'17!
13!
9
' .
23
3 !
7
3S'i
28'r32.
.3.7,'19i
15;11
i24
4
j
8
36-2~6f3a
.39I
/20j
16
j
12
' >22
I
2
|
6
34,":'--. 40
,'18:14:
10
1 I '"s.^ -38
;
Figure
1 1
.Multicenter Dot Super Cell Irrational
Tangent
dot
placement onadigital
gridThe
dot
patternis
grownalternatively from
one sub cellto
another.Within
each subcell,
the
microdotis
grownin
a clustered spiralfashion.
By
slicing
alarge dot into four
smaller
components,
the
apparent screenfrequency
increases
by
afactor
of2
whilethe
number of
gray levels is
stillhigh. The drawbacks
arethe
slightly
textured
contouring
and
the tone
jump
in
the
highlight
regionthat
resultsfrom alternating
growthfrom
nucleus
to
nucleus. [image:33.503.173.319.260.411.2]Dispersed Dots. The
dispersed
dot dither
turns
binary
pixels on or offindividually
without
grouping
them
into
the
clusters ataparticulartone
level in
the
highlight
andthe
mid-
tone
regions".It
employsfixed
size microdots
whose center-to-center
spacing (or
frequency)
is
variedaccording
to
the
density
ortone
level
ofthe
input
pixels.For
this
reason,
it is
sometimes called"frequency
modulation"
(FM). In FM
screening, the
RIP
converts
the
four
channels and appliesfrequency
modulatedscreening
to the
separatedchannels.
An
example ofFM screening is
shownin
Figure
12.
[image:34.503.45.459.254.455.2]Dither
(300dpi)
Continuous Tone
Figure 12. FM
Screening
AM (300
dpi,
60
Ipi,
rounddot)
The
spots arewidely
spacedin
highlight
areas and are clusteredtogether
in
shadow areas of an
image. The
spacing
of spotsis determined
by
the
screening
AM &
FM
Screening
AM
Screening
FM
Screening
1st Order
FM
Screening
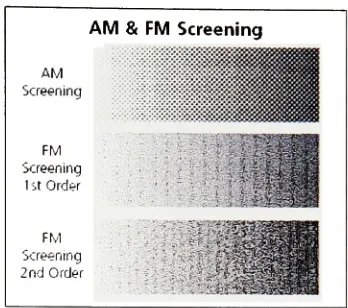
[image:35.503.165.339.81.235.2]2nd Order
Figure 13. First
orderandSecond
orderFM
screeningsThere
aretwo
types
ofFM screening
methods:first
order and second order.A
problem of past
FM screening has been
that
some offset presses andproofing
systemshave had
trouble
holding
this
very
small stochasticdot. To
solvethis
problemthe
secondgeneration of
FM screening
uses a cluster approach which combinesvery
small spotsinto
larger
micro-dots.One
advantagethat
FM
screening
has
overAM screening
is
that
FM
screening
does
not produce moire and rosette patterns although otherpatterns,
such asdot-cluster
formations
can occur.When
printing
morethan
four
colors(e.g.
hexachrome),
the
controlof
interference
patternsin AM
screening
canbe
a problem.Many
printersusing
morethan
four
colors choosethe
FM
screening
technique
for
this
reason.Test Targets
Normal
graphic artsdigital
test
targets
aredesigned
for
outputdevices
withhigh
addressability
(-1200-3600
spi).The writing
methodin
these
devices is
binary;
ink
canonly be
either onor off.Gray
levels
areachievedby
turning
some pixels on or off withina
halftone
cell.However,
there
aremany
outputdevices
which can not resolvevery
fine
pixels;
suchdevices
are unableto
generatethe
amount ofgray levels
andaddressability
required
for AM
screening.However, they
can still reproducehigh quality
images,
asthey
are ableto
apply varying
amountsofink
on a givenspot,
andtherefore
obtainmany
gray levels despite
their
low
addressability.For
suchdevices,
normal graphic artsdigital
test targets
areunsuitable,
asthese targets
aredesigned for
binary
systems withhigh
spatial addressability.
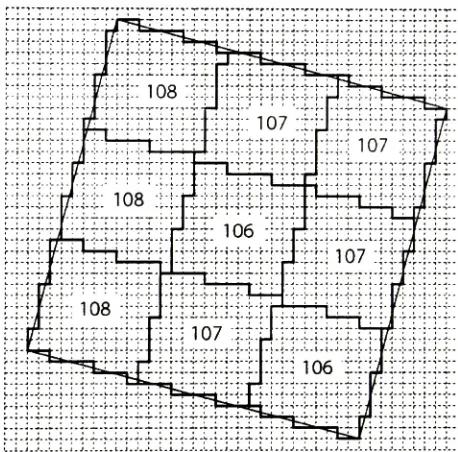
The RIT Contrast Resolution Test Target
andthe
Gutenberg
Test Target
canboth be
used on
low
orhigh
addressability printing
systems,
providing
they
have
the
ability
to
accept
PostScript
files. The
target's
purposeis
to
measurethe
relationship between
contrast and resolution of a
printing
system.It
is important
to
notethat the target
is
RIT Contrast
Resolution
Test
Target
I
1
Figure
14. Black
Quadrant
Diagram
The
target
wasdeveloped
by
Prof.
Franz
Sigg
andDr.
Edward Granger
andis
shownin
Appendix A.
On
the
target,
there
aretwo
black
contrast-resolutionquadrants,
onehorizontal,
andthe
other vertical.The
reasonfor
this
angularduplication is
that
many
printing
systemsdiffer in
contrast-resolution capabilitiesin
the
horizontal
and verticalimaging
directions;
therefore,
the target
willindicate
suchdirectional
contrast-resolutionlimitations. The
target
contains pairs ofblack,
magenta,
and cyanquadrants;
however,
for
this
thesis,
only black
was used.Figure
15
aboveillustrates
the
quadrantdesign
onthe
x-imaging
axis.The
quadrant
is
constructed asa series oflines along
the
x-axis.The
x-axisis divided into 10
separate
"strips"
or
columns,
each separatedby
smallblack
or whitedots
acrossthe
quadrant.
Each strip
contains a series oflines
withidentical line
width and spacing.The
[image:37.503.78.434.92.296.2]line
width andspacing
decreases
logarithmically
asthe
stripsdescend from
top
to
bottom.
They
start with1000pm
line
and spacewidths,
anddecrease
to
80u.m
widths.Each line
widthis
modulatedto
10 different
contrastsfrom left
to
rightacrossthe
target.
The
far left strip has
maximumcontrast appliedto the
lines (100%
tonal
valuefor
the
coloredline,
and0%
tonal
valuefor
the
spacing).The
contrastsdecrease
in
logarithmic
stepsfrom 100%
-0% (a difference
of
100%).
to
49.2%
-50.8% (a difference
of
1.0 %)12.
The
resolution and contrast ranges ofthe target
canbe defined
by
editing
the
header in
the
EPS
file.
All
strips acrossthe
y-axis are centered on a single referencetint value,
i.e.
the
average
tonal
valuebetween
the
lines
andspacing
in
each verticalstrip
remains at aconstant
throughout the
quadrant.By
default,
this tint
valueis 50% (mid
tone
range).However,
it
may
be
changedto
a referencetint
value of25%
(highlight range)
orto
areference
tint
value of75% (shadow
range).This
reference value canbe
changedin
the
header
ofthe
EPS file. There
are additional editablefields in
the
file header
such asthe
line
width,
the target
length,
etc.,
that
allowfurther
customization ofthe target
for
Evaluation
of
the
RIT Contrast
Resolution
Test Target Form
In evaluating
the
target,
each quadrantofthe target
is visually
assessed.First,
an observerviews
the
100%
contrast patch ata givenxstrip,
i.e.
an observer viewsthe
100%
contrastarea within
the
lOOOu.
boundary.
The
observerthen
looks
acrossthe
selected x-axisstrip
for
the
area wherehe/she
can nolonger
see allthe
lines
which are presentin
the
100%
contrast area.
The lines do
nothave
to
be perfectly
clearbut
must atleast be interpreted
as
horizontal lines. In
the
last
area wherethe
lines
arejust
visible, the
contrastlevel for
that
areais
recorded.For
instance,
atthe
lOOOp
strip,
if
an observer can stilldistinguish
all
the
horizontal lines
that
are presentin
the
100%
patchdown
to
3.9%,
and notlower,
then
3.9% is
the
recorded valuefor
the
lOOOu.
x-axis stripsin
that
quadrant.This
procedure
is
then
repeatedfor
all nineremaining
x-axis stripsin
that
quadrant.If
it is
determined
that the
output system was unableto
renderthe
lines
at a given x-axisstrip,
then
areading is
not required andthe
wholehorizontal strip is ignored13.
After
measurement,
the
recordeddata
canbe
plotted as a contrastsensitivity
curve.
By
taking
the two
contrastsensitivity
curves(quadrants
printedboth in horizontal
and vertical
directions),
the
Contrast-Resolution-Volume
(CRV)
canbe
calculated -the
methodology for
performing
the test
is
explainedin Chapter 5. For data
analysispurpose,
a
Microsoft
Excel
workbook wasdeveloped
to
executegraphing
ofthe
contrastsensitivity
curves andCRV
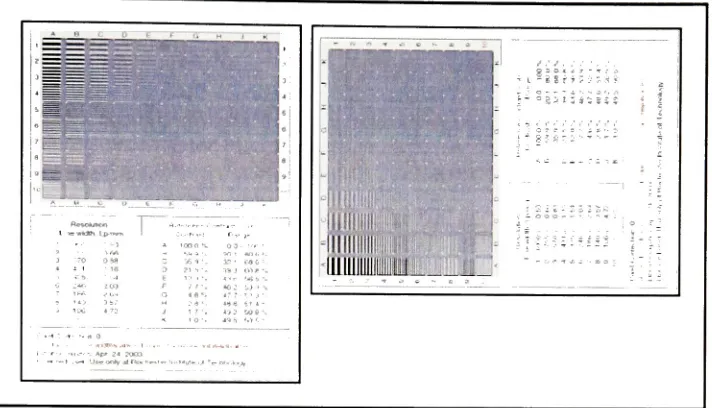
calculations.Gutenberg
Test
Target
The
Gutenberg
Test Target
has
been collectively developed
by
Dr. Edward Granger
andProf. Franz
Sigg
for measuring
resolutionquality)
limitations
of animaging
system/device.
The
Gutenberg
Test Target
consists of a series ofimages
ofGutenberg,
eachone with
only 24
x36
pixels.The
image
ofJohannes
Gutenberg
was chosenfor
the
target
as atribute to
his
contributionto
printing.The
target
canbe
used onboth high
as well aslow
addressability
systems.Other
than
measuring
the
contrast and resolutioncapability
of aprinting/imaging
system, the
target
can also act as a visualdot
gainindicator because it includes
quartertones,
mid-tones
and shadows areas.The
Gutenberg
Test Target
form is
givenin Figure
16.
*mi$
1
!
1
Figure 16.
Gutenberg
Test
Target
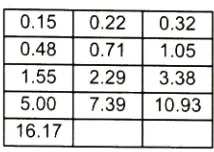
The
Gutenberg
Test Target
consists of a series ofimages
ofGutenberg,
arrangedin
descending
orderin
size.The
size ofthe
Gutenberg
images
usedin
the
form follows
a0.15
0.22
0.32
0.48
0.71
1.05
1.55
2.29
3.38
5.00
7.39
10.93
16.17
Table
1
.Size
series usedfor
Gutenberg
Images
The
target
contains elevenGutenberg
images,
eachimage representing
the
variousfrequencies
(image detail from high
to
low)
that
are presentin
animage.
Evaluation of
the
Gutenberg
Test Target Form
The
Gutenberg
Test
Target
is
supposedto
be
evaluated under standardviewing
conditions such as a neutral
grey
background,
standardviewing distance
and standardambient
light
conditions.For
evaluation,
eachimage
ofthe
Gutenberg
Test Target
is
visually
assessed.Starting
from
the
largest
Gutenberg
image,
the
observer readsthe target
horizontally
in
anti-clockwisedirection moving from
the
largest
towards the
smallestGutenberg
image in
the
form.
Moving
from
the
largest
towards the smallest, the
observerindicates
(ranks)
at whichimage Gutenberg's face is
still recognizable ordiscernible.
Systems
withdifferent
resolution/contrastcapability
will yielddifferent
results13.Once
ranked,
the
results are computedandanalyzed. [image:41.503.199.306.52.128.2]Endnotes for Chapter 2
1.
Sigg
Franz. "Definition
ofImaging
Terms
(5thdraft)"Rochester,
NY:
RIT,
2003.
2.
Ibid.,
5.
3.
Ibid.,
7.
4.
Ibid.,
8.
5. http://www.tu-harburg.de/rzt/tuinfo/periph/drucker/Color_Reproduktion/.
5.
Ibid.,
6.
6.
Kang,
Henry
R. "Digital Color
Halftoning"Piscataway,
NJ:
SPIE, IEEE,
1999.page
213
7.
Ibid.,
213.
8.
Ibid.,
252.
9.
Ibid.,
259.
10.
Ibid.,
260.
11.
Ibid.,
279.
12.
Harper,
Eliot. "An Investigation Into
the
Relationship
Between Contrast
and Resolution"Rochester,
NY:
RIT,
2000.
13.
Ibid.
15.
Sigg
Franz. "Workflow
to
makeGutenberg
target"
Chapter
3
Review
ofthe
Literature
There is relatively limited
published workin
the
area ofSubjective
Quality
Function
(SQF)
andits
correlation with subjectiveimage
judgments,
althoughthere
are severalpublished papers on similar
topics.
This
chapter,
first
reviews several papers on similartopics,
andthen
identifies
the
workdone
by
Dr. E.
M.
Granger in
the
field
ofimage
quality
assessmentusing
SQF,
andsummarizesthe
findings.
Elliot
Harper has
published aMaster's
thesis
entitled"An
investigation Into
the
Relationship
between Contrast
andResolution
of aPrinting
System
Using
the
RIT
Contrast Resolution Test
Target.1 "The
hypothesis
ofthis
paper wasthat the
RIT
Contrast Resolution
could provide a method ofdiscriminating
the
Contrast Resolution
Volume
(CRV)
ofmarking
engines andscreening
methodsby
using
analysis methodsintended for
use withthe target.
The
RIT
Contrast Resolution Test Target has been
developed
to
measurethe
relationship between
contrast and resolution of aprinting
system.
The
target
is
shownin Appendix A. On
the
target,
there
are sixcontrast-resolution
quadrangles; two cyan,
two
magenta andtwo
black,
onefor
the
horizontal
(x)
imaging
axis,
andonefor
the
vertical(y)
imaging
axis.A
graph canbe
plottedto
show resolution as afunction
of contrastin
eitherthe
x ory
direction.
The
three
axes ofcontrast resolution volume are resolutionin
the
xdirection,
resolution
in
the
y
direction
and contrastin
the
zdirection.
In
this report,
Harper
was ableto
provethat the
RIT Contrast Resolution Target
couldbe
usedto
differentiate between
the
printing
systems.He
also showedthat
eventhough
different
observers assigndifferent CRV
numbersto
agivensystem,
there
is
good agreementbetween
the
different
observers as
to
whichsystemis better
comparedto
another system.The
correlation ofthe
results
from
the test
with subjectiveimpressions
ofimages
wasleft for further
studies.Yigal Gur
analyzed an approachto
describe
the
performancequality
ofprinting
systemsen
in his
papertitled
"Image
Quality
Contrast Transfer
andTone Reproduction
"
in
the
1989 TAGA
proceedings.The
paperfocuses
onhow
the
Contrast Transfer
Function
(CTF)
canbe
usedto
produce atone
reproduction curve(TRC)
for
anarbitrary
screen
frequency.
By
using
such aprocedure,
a scanner canbe
adjustedto
fit
a givenink/paper/press
performance.Gur
presents a modelfor
producing
aTRC from
a givenCTF
through
calculating
the
Modulation Transfer Function
(MTF),
which allowsthe
image
ofthe
known halftone dot
to
be
calculated.The
theory
was verifiedby
printing
aGURLAB
target
together
witha set of133
lpi
circulardot halftone
tints
on a single coloroffset
lithographic
press.From
this experiment,
it
was concludedthat two
approachesto
the
description
ofahalf
tone
system,
TRC
andCTF,
are equivalent.Yigal
Gur
andFrancis O'Donnel have
published a paper entitled"Image
Quality
O'Donnell
explainthat
anink-jet
printeris
abinary
machine which can either print adot
at a particular
location
on a sheet of paperorleave
it blank. It is
the
binary
nature ofthis
printing
process which preventsthe
use ofthe
classicalMTF
on aninkjet
print.Gur
andO'Donnell
identify
an alternative methodfor assessing
the
printquality
of anink-jet
printer
using
aReflectance
Transfer Function (RTF).
In
their
experiment,
Gur
andO'Donnell
obtainedthe
RTF
by
reflectance measurement oftest
target
containing
checkerboards ofvarious
frequencies.
The RTF is
cascaded withthe
MTF
ofthe
human
<