R E S E A R C H
Open Access
Diabetes-specific enteral nutrition formula
in hyperglycemic, mechanically ventilated,
critically ill patients: a prospective,
open-label, blind-randomized, multicenter study
Alfonso Mesejo
1*, Juan Carlos Montejo-González
2*, Clara Vaquerizo-Alonso
3, Gabriela Lobo-Tamer
4,
Mercedes Zabarte-Martinez
5, Jose Ignacio Herrero-Meseguer
6, Jose Acosta-Escribano
7, Antonio Blesa-Malpica
8and Fátima Martinez-Lozano
9Abstract
Introduction:Although standard enteral nutrition is universally accepted, the use of disease-specific formulas for hyperglycemic patients is still controversial. This study examines whether a high-protein diabetes-specific formula reduces insulin needs, improves glycemic control and reduces ICU-acquired infection in critically ill, hyperglycemic patients on mechanical ventilation (MV).
Methods:This was a prospective, open-label, randomized (web-based, blinded) study conducted at nine Spanish ICUs. The patient groups established according to the high-protein formula received were: group A,
new-generation diabetes-specific formula; group B, standard control formula; group C, control diabetes-specific formula. Inclusion criteria were: expected enteral nutrition≥5 days, MV, baseline glucose >126 mg/dL on admission or >200 mg/dL in the first 48 h. Exclusion criteria were: APACHE II≤10, insulin-dependent diabetes, renal or hepatic failure, treatment with corticosteroids, immunosuppressants or lipid-lowering drugs and body mass index≥40 kg/m2. The targeted glucose level was 110–150 mg/dL. Glycemic variability was calculated as the standard deviation, glycemic lability index and coefficient of variation. Acquired infections were recorded using published consensus criteria for critically ill patients. Data analysis was on an intention-to-treat basis.
Results:Over a 2-year period, 157 patients were consecutively enrolled (A 52, B 53 and C 52). Compared with the standard control formula, the new formula gave rise to lower insulin requirement (19.1 ± 13.1 vs. 23.7 ± 40.1 IU/day,
p<0.05), plasma glucose (138.6 ± 39.1 vs. 146.1 ± 49.9 mg/dL,p<0.01) and capillary blood glucose (146.1 ± 45.8 vs. 155.3 ± 63.6 mg/dL,p<0.001). Compared with the control diabetes-specific formula, only capillary glucose levels were significantly reduced (146.1 ± 45.8 vs. 150.1 ± 41.9,p<0.01). Both specific formulas reduced capillary glucose on ICU day 1 (p<0.01), glucose variability in the first week (p<0.05), and incidences of ventilator-associated
tracheobronchitis (p<0.01) or pneumonia (p<0.05) compared with the standard formula. No effects of the nutrition formula were produced on hospital stay or mortality.
Conclusions:In these high-risk ICU patients, both diabetes-specific formulas lowered insulin requirements, improved glycemic control and reduced the risk of acquired infections relative to the standard formula. Compared with the control-specific formula, the new-generation formula also improved capillary glycemia.
Trial registration:Clinicaltrials.gov NCT1233726.
* Correspondence:[email protected];[email protected]
1
Intensive Care Unit, Hospital Clínico Universitario, Avda Blasco Ibáñez 17, 46010 Valencia, Spain
2
Intensive Care Unit, Hospital Universitario 12 de Octubre, Avda de Cordoba s/n, 28041 Madrid, Spain
Full list of author information is available at the end of the article
Introduction
Critically ill patients show a stereotype metabolic response to injury that affects carbohydrate metabolism [1, 2], caus-ing hyperglycemia, which is boosted by the actions of counterregulatory hormones [3, 4]. This metabolic re-sponse makes the critically ill patient especially susceptible to infection and increases morbidity and mortality [5–7]. The control of blood glucose levels and adequate nutri-tional support contribute to metabolic improvement and help reduce the risk of infection.
Glycemic variability (GV) has been independently associated with mortality and a higher risk of intensive care unit (ICU)-acquired infection in critically ill pa-tients [8–11]. Accordingly, it has been proposed that this variability could be improved by modifying the compos-ition of the standard enteral nutrcompos-ition formula given to the patient [12]. In an effort to avoid the detrimental consequences of hypoglycemia [13–15], many ICUs have elevated their targeted lower limits for glucose levels. However, to date no consensus has been reached on the optimal target glucose range [16–19].
Hyperglycemia in the ICU patient can be treated with exogenous insulin [20, 21] and by the enteral administra-tion of diabetes-specific formulas [22]. Although the use of standard enteral nutrition (EN) products is widely accepted, the benefits of disease-specific or modified standard enteral formulas for hospitalized patients with diabetes remain controversial [23, 24]. When used as short- to medium-term treatment, a standard high-carbohydrate/low-fat diet may compromise glycemic con-trol [25, 26]. By modifying carbohydrate composition and adding monounsaturated fatty acids (MUFA) and fiber, studies have shown improved glycemic control compared with a standard diet [27–29]. However, few studies have examined the benefits of diabetes-specific formulas in crit-ically ill patients with hyperglycemia [30].
We hypothesized that in the hyperglycemic, critically ill patient, the use of a diabetes-specific nutrition formula might serve to improve glycemic control and reduce the risk of hospital-acquired infection. The aim of our study was to compare, in mechanically ventilated ICU patients with hyperglycemia, the use of three EN formulas: a standard EN formula, a widely used diabetes-specific for-mula and a new-generation diabetes-specific forfor-mula. This last formula contains high protein levels, MUFA, slowly absorbed carbohydrates, and omega-3 polyunsaturated fatty acids (PUFA), and is enriched with eicosapentaenoic acid (EPA), docosahexaenoic acid (DHA) and fiber.
Methods
Study design and data collection
A prospective, multicenter, open-label, blind-randomized, controlled clinical trial was conducted in medical-surgical ICUs in nine teaching hospitals in Spain. The study
protocol was approved by each hospital’s review board. A list of ethics committees that approved the study at each institution is provided as Additional file 1. Written informed consent was obtained from participating patients or closest relatives.
The primary endpoint was the amount of insulin re-quired to keep glucose levels in the range 110–150 mg/ dL (glycemia target). Secondary endpoints were glycemic control (plasma and capillary blood glucose, glycemic variability), ICU-acquired infection (catheter-related bloodstream infection, primary bloodstream infection, urinary tract infection, ventilator-associated tracheo-bronchitis incidence rate/1000 ventilator days and ventilator-associated pneumonia incidence rate/1000 ventilator days), days on mechanical ventilation (MV), ICU stay and mortality at 28 days post admission. After ICU discharge, patients were followed for 6 months to record hospital stay, hospital mortality, and 6-month mortality.
Patient assignment/randomization
The study was performed over the period April 2010 to May 2012. A website was constructed to record data and to randomize patients to each EN formula. Data were collected online using an electronic case report form. For randomization, the website assigned the formulas in a blinded, centralized fashion in blocks of six pa-tients, including at least three blocks stratified by par-ticipating center, according to the sequence: study group A, new-generation diabetes-specific high-protein formula (Diaba HP®, Vegenat, Badajoz, Spain); control group B, standard high-protein formula (Isosource Pro-tein Fibra®, Nestlé Health Science, Barcelona, Spain); control group C, widely used diabetes-specific high-protein formula (Glucerna Select®, Abbott Nutrition, Madrid, Spain). Patients were consecutively enrolled at each center by the responsible researcher. When enrol-ling a patient, the researcher was blind to the randomization sequence. All participants were followed at the ICU for a maximum of 28 days.
Patient eligibility
B-C), life expectancy ≤48 h, previous cardiac arrest, long-term therapy with corticosteroid, immunosuppres-sant or lipid-lowering drugs, pregnancy, body mass index (BMI)≥40 and parenteral nutrition (PN).
Administration protocol and formula composition
The study patients were started on EN through a nasogas-tric tube within 48 h of ICU admission. Enteral feeding was continued over 24 h each day and only interrupted for 8 h (from 12 p.m. to 8 a.m.) along with insulin infusion on days 3, 7, 14, 21 and 28 to obtain samples for complete blood tests. Patients were managed by the responsible re-searchers at each center. Gastric residual volume (GRV) was measured every 6 h for the first 2 days and every 24 h thereafter until EN was stopped. All patients received 10 mg metoclopramide every 8 h only for the first 3 days.
Prescribed caloric intake was 25 kcal/kg/day. Nutritional requirements were calculated by the responsible re-searchers. It was ensured that patients received their calculated requirements in the first 48 h of EN. Non-nutritional caloric constituents like glucose or propofol were included in caloric balance calculations. Insulin was administered in saline solution at a 1:1 ratio by continuous infusion using a 50-mL syringe pump. The nursing staff adjusted the dose guided by capillary blood glucose levels using a sliding-scale algorithm and a point-of-care glucose meter following a consensus protocol for the nine partici-pating centers (see Table S1 in Additional file 2).
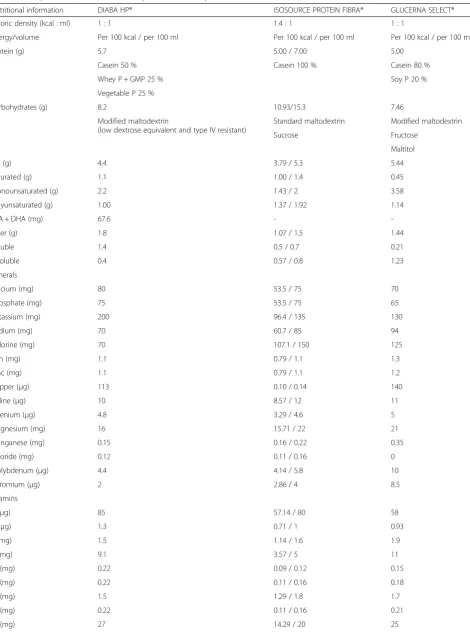
Patients were randomized to receive one of three dif-ferent nutrition formulas (Table 1). The two diabetes-specific formulas contain greater percentages of fat while the standard formula has a greater carbohydrate content and less fiber. The carbohydrates included in each for-mula are: low-dextrose-equivalent maltodextrin and type IV-resistant maltodextrin in the study formula; modified maltodextrin, fructose and maltitol in the control diabetes-specific formula; and maltodextrin and sacchar-ose in the standard high-protein formula. The two spe-cific formulas contain greater proportions of MUFA and the study diet also has higher ω-3, EPA and DHA con-tents. Due to their different caloric densities, formula volumes were calculated on the website to ensure pa-tients received similar caloric and nitrogenous support.
Variables and controls
Baseline data were collected before starting EN (Table 2). Both the Sequential Organ Failure Assessment (SOFA) and Homeostasis Model Assessment (HOMA2) [33] were repeated on days 3, 7, 14, 21 and 28 after ICU admission.
Variables were monitored for a maximum of 28 days. The variables MV days, EN days and ICU stay were recorded when the patient was discharged from the
ICU. Hospital stay and mortality were recorded at 28 days and 6 months.
Complete blood tests were conducted on a peripheral blood sample on ICU admission. Blood samples for simi-lar tests on days 3, 7, 14, 21 and 28 post admission were obtained at 8 a.m., 8 hours after stopping EN and insulin infusion.
The glycemic target was set at 110–150 mg/dL. For the present purposes, severe hypoglycemia was defined as a blood glucose level less than 50 mg/dL and moderate hypoglycemia as a level of 50–80 mg/dL. Insulin infusion was started when glucose levels reached≥150 mg/dL. To monitor daily plasma glucose levels, venous blood was withdrawn from each patient at 8 a.m.; capillary blood glucose levels were monitored every 1–4 h using a Gluc-ometer Elite XL from Bayer®, Barcelona, Spain. Plasma glucose levels were measured by the hexokinase method at each center’s main laboratory.
In each patient, we recorded mean and standard devi-ation (SD) plasma glucose levels. Daily mean (GluM) and
standard deviation (GluSD) capillary blood glucose levels
were obtained during their ICU stay. Insulin (in inter-national units) administered to each patient per day was also recorded.
The following glycemia control indices were recorded for each patient [8]: plasma glucose level on admission; mean and SD of capillary blood glucose levels recorded on ICU day 1; peak glucose during ICU stay; and GV during the first 7 days and during the 28 days of the study. Glycemic variability was measured as the mean SD of daily capillary glucose levels, the coefficient of variation (CV) according to the equation GluCV=
GluSD× 100/GluM, and the glycemic lability index (GLI).
The GLI was calculated using the Ryan equation [34] modified for critically ill patients and corrected for the number of blood extractions as follows:
GLI
mmol l
2
h day
−1
( )
¼XN n¼1
ðGlucn−Glucnþ1Þ2
ðN−1Þ ðhnþ1−hnÞ
where Glucnis the nth reading for the patient at time
n measured in mmol/L, N is the total number of read-ings performed that day, and hn is the time in hours of
the nth reading at time n.
Patients were examined daily to detect the presence of gastrointestinal complications. The following gastro-intestinal complications were defined according to cri-teria published by our group [35, 36]:
Table 1Composition of enteral formulas per 100 kcal and per 100 ml
Nutritional information DIABA HP® ISOSOURCE PROTEIN FIBRA® GLUCERNA SELECT®
Caloric density (kcal : ml) 1 : 1 1.4 : 1 1 : 1
Energy/volume Per 100 kcal / per 100 ml Per 100 kcal / per 100 ml Per 100 kcal / per 100 ml
Protein (g) 5.7 5.00 / 7.00 5.00
Casein 50 % Casein 100 % Casein 80 %
Whey P + GMP 25 % Soy P 20 %
Vegetable P 25 %
Carbohydrates (g) 8.2 10.93/15.3 7.46
Modified maltodextrin
(low dextrose equivalent and type IV resistant)
Standard maltodextrin Modified maltodextrin
Sucrose Fructose
Maltitol
Fat (g) 4.4 3.79 / 5.3 5.44
Saturated (g) 1.1 1.00 / 1.4 0.45
Monounsaturated (g) 2.2 1.43 / 2 3.58
Polyunsaturated (g) 1.00 1.37 / 1.92 1.14
EPA + DHA (mg) 67.6 -
-Fiber (g) 1.8 1.07 / 1.5 1.44
Soluble 1.4 0.5 / 0.7 0.21
Insoluble 0.4 0.57 / 0.8 1.23
Minerals
Calcium (mg) 80 53.5 / 75 70
Phosphate (mg) 75 53.5 / 75 65
Potassium (mg) 200 96.4 / 135 130
Sodium (mg) 70 60.7 / 85 94
Chlorine (mg) 70 107.1 / 150 125
Iron (mg) 1.1 0.79 / 1.1 1.3
Zinc (mg) 1.1 0.79 / 1.1 1.2
Copper (μg) 113 0.10 / 0.14 140
Iodine (μg) 10 8.57 / 12 11
Selenium (μg) 4.8 3.29 / 4.6 5
Magnesium (mg) 16 15.71 / 22 21
Manganese (mg) 0.15 0.16 / 0.22 0.35
Fluoride (mg) 0.12 0.11 / 0.16 0
Molybdenum (μg) 4.4 4.14 / 5.8 10
Chromium (μg) 2 2.86 / 4 8.5
Vitamins
A (μg) 85 57.14 / 80 58
D (μg) 1.3 0.71 / 1 0.93
E (mg) 1.5 1.14 / 1.6 1.9
C (mg) 9.1 3.57 / 5 11
B1(mg) 0.22 0.09 / 0.12 0.15
B2(mg) 0.22 0.11 / 0.16 0.18
B3(mg) 1.5 1.29 / 1.8 1.7
B6(mg) 0.22 0.11 / 0.16 0.21
stools in a 24-h period or an estimated stool volume equal or greater than 2000 mL/day.
If a complication required withholding the diet for >48 h or starting PN, the case was closed but included in the intent-to-treat analysis.
The volume ratio (VR) was estimated as a measure of the efficacy of daily nutritional administration and calcu-lated as follows: VR (%) = (volume administered/volume prescribed) × 100. Also calculated were calorie and nutri-ent (carbohydrates, fats and proteins) intakes per
patient/day based on daily infused volumes and formula composition.
[image:5.595.54.546.102.187.2]ICU-acquired infections were defined according to cri-teria for critically ill patients emerging from consensus conferences [37, 38]. An infection was recorded as ac-quired if starting 48 h after ICU admission. Biological samples for microbiological cultures were obtained when there was clinical suspicion of infection or at least once a week. The following variables were recorded: number of infected patients, infection rate/100 days of ICU stay, Table 1Composition of enteral formulas per 100 kcal and per 100 ml(Continued)
B12(μg) 0.32 0.26 / 0.36 0.3
Biotin (μg) 4 7.29 / 10.2 4
Pantothenic A. (mg) 0.8 0.31 / 0.44 0.75
K (μg) 5.2 5.71 / 8 10
Choline (μg) 37 - 43
Osmolarity (mOsm/L) 345 399 378
Pprotein,GMPglycomacropeptide,EPAeicosapentaenoic acid,DHAdocosahexaenoic acid,Aacid
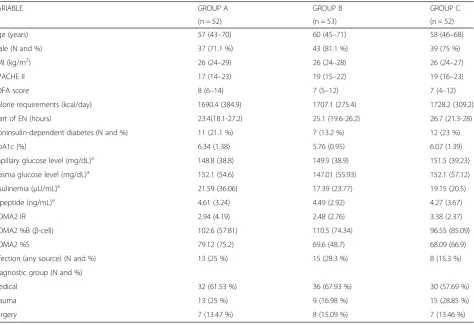
Table 2Demographics and baseline clinical characteristics of the study population
VARIABLE GROUP A GROUP B GROUP C
(n = 52) (n = 53) (n = 52)
Age (years) 57 (43–70) 60 (45–71) 58 (46–68)
Male (N and %) 37 (71.1 %) 43 (81.1 %) 39 (75 %)
BMI (kg/m2) 26 (24–29) 26 (24–28) 26 (24–27)
APACHE II 17 (14–23) 19 (15–22) 19 (16–23)
SOFA score 8 (6–14) 7 (5–12) 7 (4–12)
Calorie requirements (kcal/day) 1690.4 (384.9) 1707.1 (275.4) 1728.2 (309.2)
Start of EN (hours) 23.4(18.1-27.2) 25.1 (19.6-26.2) 26.7 (21.3-28)
Noninsulin-dependent diabetes (N and %) 11 (21.1 %) 7 (13.2 %) 12 (23 %)
HbA1c (%) 6.34 (1.38) 5.76 (0.95) 6.07 (1.39)
Capillary glucose level (mg/dL)a 148.8 (38.8) 149.9 (38.9) 151.5 (39.23)
Plasma glucose level (mg/dL)a 152.1 (54.6) 147.01 (55.93) 152.1 (57.12)
Insulinemia (μU/mL)a 21.59 (36.06) 17.39 (23.77) 19.15 (20.5)
C-peptide (ng/mL)a 4.61 (3.24) 4.49 (2.92) 4.27 (3.67)
HOMA2 IR 2.94 (4.19) 2.48 (2.76) 3.38 (2.37)
HOMA2 %B (β-cell) 102.6 (57.81) 110.5 (74.34) 96.55 (85.09)
HOMA2 %S 79.12 (75.2) 69.6 (48.7) 68.09 (66.9)
Infection (any source) (N and %) 13 (25 %) 15 (28.3 %) 8 (15.3 %)
Diagnostic group (N and %)
Medical 32 (61.53 %) 36 (67.93 %) 30 (57.69 %)
Trauma 13 (25 %) 9 (16.98 %) 15 (28.85 %)
Surgery 7 (13.47 %) 8 (15.09 %) 7 (13.46 %)
Values are provided as mean (SD), median (Q1-Q3) and percentages (%)
Nnumber,BMIbody mass index,APACHE II, Acute Physiology and Chronic Health Evaluation II,SOFASequential Organ Failure Assessment,ENenteral nutrition, HbA1cglycated hemoglobin,HOMA2Homeostasis Model Assessment,IRinsulin resistance,%Sinsulin sensitivity,%Bbeta cell functiona
[image:5.595.64.539.377.702.2]tracheobronchitis/1000 days of MV, ventilator-associated pneumonia/1000 days of MV, bacteremia and urinary tract infection.
Power calculations and data treatment
Based on the results of our previous study [30], an insu-lin requirement reduction of at least 20 % was consid-ered clinically meaningful. Assuming an α risk of 0.05 and aβrisk of 0.20 (power = 80 %), the required number of patients was estimated at 159. Each case was recorded in the electronic logbook by the responsible researcher, sent to the principal investigators for verification, and entered into a central database. Each case was checked to ensure that the patient met the inclusion/exclusion criteria, the study protocol had been adequately followed and all the required data had been provided. Discrepan-cies and transcription errors were discussed among the researchers and clarified by the principal investigators.
An intent-to-treat analysis was performed. Qualitative variables are expressed as absolute and relative frequen-cies and continuous variables as means (±SD) or as me-dians (quartile 1; quartile 3). Qualitative variables were compared using the chi-squared test or Fisher’s exact test. Continuous data were assessed for normality using the Kolmogorov-Smirnov test. The nonparametric Kruskal-Wallis and Mann-Whitney U tests were used when the data did not fit the assumptions of normality. If the dependent variable under examination was quantitative, we statistically assessed the comparability of the three treatment groups by one-way analysis of variance (ANOVA) and the corresponding multiple comparison of means test (Tukey’s HSD, Bonferroni). For the main outcome measures, a repeated measures generalized linear model (GLM) was used when considering mea-surements taken at different time points in a single patient.
For incidence rates, we used inference methods on variables recorded in two populations, obtaining a p value for the chi-squared test. The relationship between glucose variability and acquired infection complication rate adjusted for time was calculated using the linear correlation coefficient (Pearson’srtest).
All statistical tests were performed using the SAS stat-istical analysis system package (version 9.3, SAS Insti-tute, Cary, NC, USA) SPSS (version 21, IBM Corp., Armonk, NY, USA) and the epidemiological analysis program EPIDAT for tabulated data (version 3.1, Epi-Data Association, Odense, Denmark). Significance was set atp<0.05.
Results
Baseline characteristics
A total of 159 consecutive ICU patients fulfilling the inclusion criteria were initially recruited. Two patients
were excluded because of incorrect randomization (one group A, one group C) leaving a study population of 157 patients (52 group A, 53 group B, 52 group C) (Fig. 1). Fifteen patients did not complete the minimum of 5 days of treatment, but all 157 were included in the intent-to-treat analysis. The three patient groups were homoge-neous in terms of demographic and baseline clinical characteristics (Table 2).
Nutrition onset was targeted for within 24 h of ICU admission. Median values for EN onset after ICU admis-sion in hours were 23.4 (18.1–27.2), 25.1 (19.6–26.2) and 26.7 (21.3–28) for groups A, B and C, respectively (Table 2).
The calorie and protein intake values provided in Table 3 indicate isocaloric and isonitrogenous intakes across the three groups, with no differences in effective volume. The mean volume ratio was approximately 80 % of the prescribed ratio. Despite differences in fiber, carbohydrate and lipid intake arising from the different formula compositions, total intakes were within recom-mended limits. Propofol 2 % was administered in the first 7 days of ICU stay in six group A, seven group B, and five group C patients. The maximum dose received by these patients was 2.2 g/d and the kcal provided by this agent was included in the calorie intake calculations. The intravenous administration of glucose 5 % in three group A, two group B and two group C patients some time during their ICU stay was also taken into account as a source of calories.
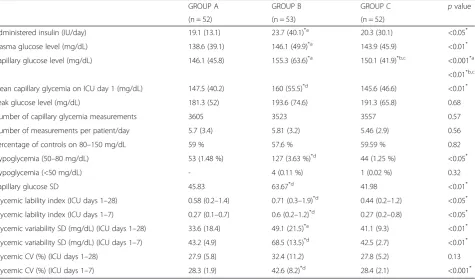
Glycemic and metabolic control
The variables recorded related to glycemic control are provided in Table 4. These data indicate that patients in group A needed less insulin (p<0.05) and showed lower plasma and capillary blood glucose levels than those in group B (p<0.01 and p <0.001 respectively). No differ-ences were detected in insulin dose between groups A and C; however, in the group A patients, capillary blood glucose was significantly lower (p <0.01). Both diabetes formulas achieved significant improvements in mean ca-pillary glycemia (MCG) on the first day of ICU stay compared with group B (p <0.01). No differences emerged among the three groups in peak glycemia, number of capillary glycemia measurements and number of measurements made per patient and day.
The rate of severe hypoglycemia episodes (≤50 mg/dL) was <1 %, with no clinical repercussions. Group B showed the greater frequency of moderate hypoglycemia (50–80 mg/dL).
the first week of ICU stay (GLI p <0.05, SD p <0.01, CV p <0.001). Over the 28 days of follow- up, re-ductions were also produced in GLI (p <0.05) and SD (p <0.01).
Plasma levels of cholesterol, triglycerides, albumin and prealbumin were similar across the three treatment groups.
Infection control
Infectious complications recorded in the study partici-pants are provided in Table 5. Numbers of infected pa-tients and incidences of any infection per 100 days of treatment were lower in the study group, but not signifi-cantly (p= 0.54 and p= 0.51 respectively). Catheter-associated bloodstream infection, primary bloodstream
6280 patients on artificial nutritional support assessed for eligibility
4820 excluded due to TPN, SPN or EN + PN
1460 eligible for EN
1304 ineligible
733 expected EN <5 days 27 immunosuppressive treatment 72 life expectancy <48 h 37 participation declined 94 dyslipidemia treatment 38 previous cardiac arrest 49 acute kidney failure 22 hepatic failure
89 insulin-dependent diabetes 56 morbid obesity
74 treatment with steroids 13 unknown reasons
159 underwent randomization
2 incorrect randomization 1 group A, 1 group C
157 underwent analysis
Group A Group B Group C
n=52 n= 53 n=52
6a 5b 4c lost post randomization
(<5 days of EN)
Group A Group B Group C Intention-to-treat analysis n=52 n=53 n=52
[image:7.595.61.537.90.591.2]Table 3Nutrients received
GROUP A GROUP B GROUP C pvalue
(n = 52) (n = 53) (n = 52)
Volume ratio (%) 79.8 (13.4) 81.1 (17) 82.4 (15) 0.71
Total calories received (kcal/day) 1349 (323) 1385 (454) 1423 (383) 0.17
(kcal/kg/day) 22.2 (4.1) 21.7 (4.8) 21.3 (3.8)
Protein (g/day) 76.8 (18.4) 69.2 (23.2) 71.1 (19.1) 0.11
(g/kg/day) 1.26 (0.32) 1.21 (0.27) 1.23 (0.18)
Carbohydrates (g/day) 110.6 (25.8) 151.3 (50.7)*a 106.1 (28.6) <0.001*
(g/kg/day) 1.6 (0.18) 2.1 (0.26) 1.5 (0.19)
Fat (g/day) 59.3 (16.4) 52.4 (17.5)*b 77.4 (20.8)*c <0.01*b
(g/kg/day) 0.8 (0.12) 0.71 (0.17) 0.96 (0.22) <0.001*c
Fiber (g/day) 19.1 (5.8) 13.4 (4.9)a* 15.7 (5.5)*d <0.01*d
(g/kg/day) 0.26 (0.09) 0.16 (0.05) 0.2 (0.06) <0.001*a
Values are provided as means (SD). Asterisks indicate statistical significance
a
Difference group B vs. groups A and C
b
Difference group A vs. group B
c
Difference group C vs. groups A and B
d
Difference group A vs. group C
Table 4Variables related to glycemic control
GROUP A GROUP B GROUP C pvalue
(n = 52) (n = 53) (n = 52)
Administered insulin (IU/day) 19.1 (13.1) 23.7 (40.1)*a 20.3 (30.1) <0.05*
Plasma glucose level (mg/dL) 138.6 (39.1) 146.1 (49.9)*a 143.9 (45.9) <0.01*
Capillary glucose level (mg/dL) 146.1 (45.8) 155.3 (63.6)*a 150.1 (41.9)*b,c <0.001*a
<0.01*b,c
Mean capillary glycemia on ICU day 1 (mg/dL) 147.5 (40.2) 160 (55.5)*d 145.6 (46.6) <0.01*
Peak glucose level (mg/dL) 181.3 (52) 193.6 (74.6) 191.3 (65.8) 0.68
Number of capillary glycemia measurements 3605 3523 3557 0.57
Number of measurements per patient/day 5.7 (3.4) 5.81 (3.2) 5.46 (2.9) 0.56
Percentage of controls on 80–150 mg/dL 59 % 57.6 % 59.59 % 0.82
Hypoglycemia (50–80 mg/dL) 53 (1.48 %) 127 (3.63 %)*d 44 (1.25 %) <0.05*
Hypoglycemia (<50 mg/dL) - 4 (0.11 %) 1 (0.02 %) 0.32
Capillary glucose SD 45.83 63.67*d 41.98 <0.01*
Glycemic lability index (ICU days 1–28) 0.58 (0.2–1.4) 0.71 (0.3–1.9)*d 0.44 (0.2–1.2) <0.05*
Glycemic lability index (ICU days 1–7) 0.27 (0.1–0.7) 0.6 (0.2–1.2)*d 0.27 (0.2–0.8) <0.05*
Glycemic variability SD (mg/dL) (ICU days 1–28) 33.6 (18.4) 49.1 (21.5)*a 41.1 (9.3) <0.01*
Glycemic variability SD (mg/dL) (ICU days 1–7) 43.2 (4.9) 68.5 (13.5)*d 42.5 (2.7) <0.01*
Glycemic CV (%) (ICU days 1–28) 27.9 (5.8) 32.4 (11.2) 27.8 (5.2) 0.13
Glycemic CV (%) (ICU days 1–7) 28.3 (1.9) 42.6 (8.2)*d 28.4 (2.1) <0.001*
Values are provided as mean (SD) and percentages (%). Asterisks indicate statistical significance IU, international units,ICUintensive care unit,SD, standard deviation,CVcoefficient of variation
a
Difference group A vs. group B
b
Difference group B vs. group C
c
Difference group A vs. group C
d
[image:8.595.63.539.404.684.2]infection and urinary tract infection did not vary across the groups. Rates of ventilator-associated tracheobron-chitis and pneumonia per 1000 days of MV were signifi-cantly lower for the study (p <0.01 and p <0.05 respectively) and control (p <0.01) diabetes formulas than the standard formula. No significant differences in infectious complications were produced in patients randomized to receive the study or control diabetes formulas.
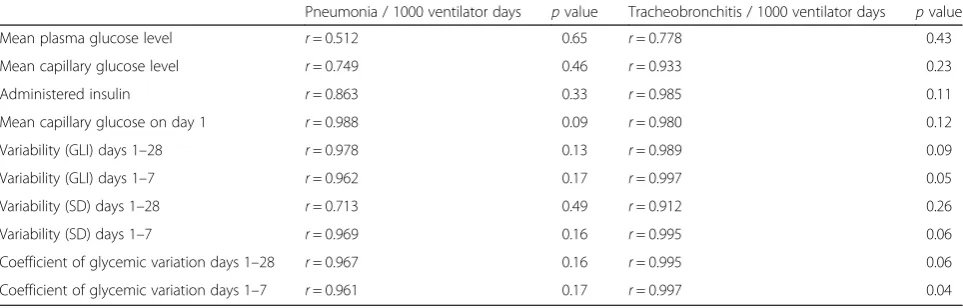
We also examined the relationship between glycemic variability and acquired infections (Table 6). Thus, the incidence of tracheobronchitis per 1000 days of MV showed high significant correlation with glycemic CV for the first week of ICU stay (r= 0.997; p= 0.04). This variable also showed high correlation, albeit without significance, with GLI recorded over 28 days (r= 0.989; p= 0.09) and 1 week (r= 0.997; p= 0.05) of follow-up, and with SD for 1 week (r= 0.995; p= 0.06) and CV for
28 days (r= 0.995; p= 0.06) of follow-up. The incidence of ventilator-associated pneumonia / 1000 days of MV only showed high correlation but without significance with the MCG recorded in the first ICU stay (r= 0.988; p= 0.09).
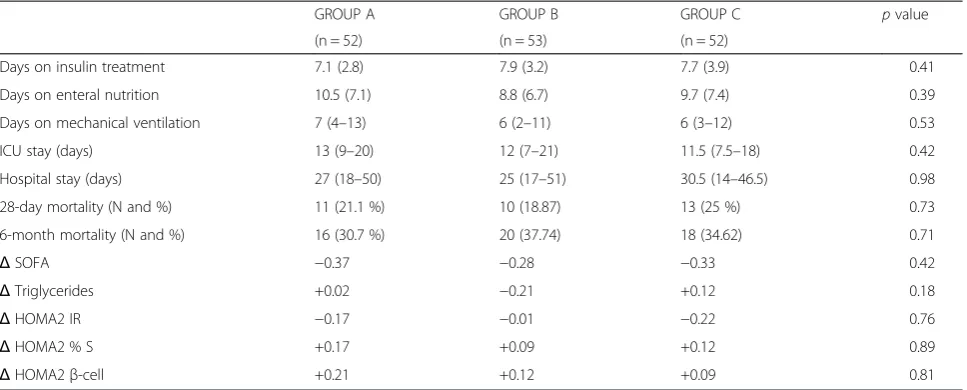
Other nutritional and clinical outcomes
[image:9.595.56.541.100.266.2]Diet tolerance was good in all three treatment groups. Only in 11 patients (7 %) did EN have to be interrupted for more than 48 h due to gastrointestinal complications. The complications observed were abdominal distension in one patient (group B), diarrhea in six patients (two group A, one group B and three group C) and high GRV in four patients (one group A, two group B and one group C). The remaining clinical outcomes are shown in Table 7. No significant differences among groups were produced in the number of days on insulin treatment or on enteral nutrition, number of days on MV, ICU and
Table 5Acquired infectious complications
GROUP A GROUP B GROUP C pvalue
(n = 52) (n = 53) (n = 52)
Number of infected patients 18/52 (34.6 %) 23/53 (43.4 %) 23/52 (44.2 %) 0.54
Odds ratio 1.4 (0.6–3.1)a 1.03 (0.4
–2.2)c
1.4 (0.6–3.3)b
Infectious complication incidence rate / % treatment days 22/546 (4.03) 24/470 (5.11) 24/505 (4.75) 0.51
Catheter-related bloodstream infection 1/52 (1.92 %) 1/53 (1.89 %) 2/52 (3.85 %) 0.53
Primary bloodstream infection 3/52 (5.77 %) 1/53 (1.89 %) 3/52 (5.77 %) 0.25
UTI 1/52 (1.92 %) 1/53 (1.89 %) 1/52 (1.92 %) 1.00
Tracheobronchitis incidence rate / 1000 ventilator days 7/460 (15.2)*a 10/392 (25.5) 7/424 (16.5)*c <0.01*
VAP incidence rate / 1000 ventilator days 8/460 (17.3)*a 10/392 (25.5) 6/424 (14.1)*c <0.05*a
< 0.01*c Values are provided as percentages (%) and incidence rate. Asterisks indicate statistical significance
UTIurinary tract infection,VAPventilator-associated pneumonia
a
Difference group A vs. group B
b
Difference group A vs. group C
c
[image:9.595.57.539.572.726.2]Difference group B vs. group C
Table 6Relationship between glycemic control and infectious complications determined through Pearson linear correlation (r)
Pneumonia / 1000 ventilator days pvalue Tracheobronchitis / 1000 ventilator days pvalue
Mean plasma glucose level r= 0.512 0.65 r= 0.778 0.43
Mean capillary glucose level r= 0.749 0.46 r= 0.933 0.23
Administered insulin r= 0.863 0.33 r= 0.985 0.11
Mean capillary glucose on day 1 r= 0.988 0.09 r= 0.980 0.12
Variability (GLI) days 1–28 r= 0.978 0.13 r= 0.989 0.09
Variability (GLI) days 1–7 r= 0.962 0.17 r= 0.997 0.05
Variability (SD) days 1–28 r= 0.713 0.49 r= 0.912 0.26
Variability (SD) days 1–7 r= 0.969 0.16 r= 0.995 0.06
Coefficient of glycemic variation days 1–28 r= 0.967 0.16 r= 0.995 0.06
Coefficient of glycemic variation days 1–7 r= 0.961 0.17 r= 0.997 0.04
hospital stay, and mortality at 28 days and at 6 months. Figure S1 in Additional file 3 provides the numbers of patients remaining in the study during the 28-day course of follow-up.
Discussion
This study shows that a diabetes-specific high-protein EN formula containing MUFA, slowly absorbed carbohy-drates and omega-3 PUFA enriched with EPA, DHA and fiber gives rise to better glycemic homeostasis than a standard high-protein formula and may also reduce the risk of acquired infections in ICU patients.
When comparing the diabetes-specific study formula (A) with a widely used diabetes-specific formula of dif-ferent composition (C), the only significant difference found was a lower mean capillary blood glucose level in patients given the study formula.
The similar 28-day and 6-month mortality rates re-corded for the three treatment groups could be related to an insufficient sample size for comparing these end-points. No effects of the different formulas were pro-duced on insulin resistance or sensitivity determined using the HOMA2 calculator.
Glycemic control
Continuous insulin infusion protocols help to main-tain plasma glucose levels within recommended ranges [14, 15, 18–20]. However, consistent with our findings, numerous studies have shown that insulin re-quirements and plasma and capillary blood glucose levels can be reduced using a diabetes-specific EN formula as an adjuvant to insulin [22, 25, 27, 29, 30] (Table 4). It there-fore seems that the composition of these formulas, both in
quantitative terms (smaller percentages of carbohydrates and higher fat percentages) and qualitative terms (including modified carbohydrates and MUFA, EPA and DHA), helps reduce insulin requirements, and this also reduces the risk of hypoglycemia. No prior studies in crit-ical patients have compared enteral feeding formulas with similar protein and fat contents but different carbohydrate sources and levels such that we cannot attribute the better blood glucose control observed here to the carbohydrate supply provided by the formula. Notwithstanding, recent clinical practice guidelines [23, 24] do not recommend the use of this type of formula and indicate a need for further studies.
For some years, GV has been associated with outcome in the critically ill patient. Thus, in a cohort of 7049 crit-ical patients, Egi et al. [8] observed a greater GV in pa-tients who died than in survivors. Similarly, Hermanides et al. [9], in 5728 critical patients, found a significant re-lationship between GV, measured as mean absolute glu-cose, and the likelihood of ICU death. In addition, Krinsley et al. [10], in an international, multicenter co-hort study conducted in 44,964 patients, noted that greater GV was independently associated with increased mortality in critical patients with no prior diabetes.
These studies on GV, however, failed to address the nutritional support or, in many cases, the amount of in-sulin administered to the patients. Thus, it is worth ask-ing what influence these diabetes-specific formulas could have in controlling both hyperglycemia and GV.
[image:10.595.57.541.100.295.2]Alish et al. [12] reported lower GV based on the mean amplitude of glycemic excursions (MAGE) in noncriti-cally ill patients with diabetes who were administered a diabetes-specific formula than in those administered a
Table 7Other clinical outcomes
GROUP A GROUP B GROUP C pvalue
(n = 52) (n = 53) (n = 52)
Days on insulin treatment 7.1 (2.8) 7.9 (3.2) 7.7 (3.9) 0.41
Days on enteral nutrition 10.5 (7.1) 8.8 (6.7) 9.7 (7.4) 0.39
Days on mechanical ventilation 7 (4–13) 6 (2–11) 6 (3–12) 0.53
ICU stay (days) 13 (9–20) 12 (7–21) 11.5 (7.5–18) 0.42
Hospital stay (days) 27 (18–50) 25 (17–51) 30.5 (14–46.5) 0.98
28-day mortality (N and %) 11 (21.1 %) 10 (18.87) 13 (25 %) 0.73
6-month mortality (N and %) 16 (30.7 %) 20 (37.74) 18 (34.62) 0.71
ΔSOFA −0.37 −0.28 −0.33 0.42
ΔTriglycerides +0.02 −0.21 +0.12 0.18
ΔHOMA2 IR −0.17 −0.01 −0.22 0.76
ΔHOMA2 % S +0.17 +0.09 +0.12 0.89
ΔHOMA2β-cell +0.21 +0.12 +0.09 0.81
Values are provided as mean (SD), median (Q1-Q3) and percentages (%)
standard formula. These results are in agreement with those of our study (Table 4) indicating similarly lower glucose variability for the diabetes-specific study and control formulas versus the standard formula, both in the first week of ICU stay and for 28 days of follow-up. In the first 7 days of ICU stay, stress hypermetabolism is at its maximum and its adequate control can impact short-term outcomes in critically ill patients. In our pa-tients, greatest differences among treatment groups were detected in MCG on the first ICU day and in GV and CV during the first ICU week. Given the important role of GV in critically ill patient outcomes, we recommend the use of such specific formulas in hyperglycemic ICU patients, at least during the first week of ICU stay.
Infection control
A relationship between hyperglycemia and infection has been established in several populations of critically ill pa-tients [39–41]. In a meta-analysis of data from 29 random-ized, controlled trials including 8432 patients, fewer septic complications were observed in patients subjected to strict glycemic control [18]. Similarly, Van den Berghe et al. [16] noticed fewer infections in surgical patients in whom a tight glycemic control protocol had been followed. How-ever, these findings were not confirmed in a subsequent study in medical patients [42], in the NICE-SUGAR study [14] or in a subsequent meta-analysis [15].
In our study, fewer ICU-acquired infections were ob-served in patients on both diabetes-specific high-protein formulas than those given the standard high-protein for-mula (Table 5). The differences in insulin needs and in plasma and capillary glycemia between these groups could only partially explain this reduction. We also ana-lyzed (Table 6) the relationship between glycemic con-trol and any significant infections identified in the group comparisons. Thus, as stated in the results section, high significant correlation (r>0.9) with tracheobronchitis ep-isodes per 1000 days of MV was detected for glycemic CV in the first week of ICU stay and a trend toward significance was noted for the other glycemia variability parameters. This correlation with infection was not observed for the other variables such as the amount of insulin administered or capillary blood and plasma glu-cose levels.
As far as we know, no similar data exist in the medical literature linking rates of infectious complications to the administration of diabetes-specific formulas in critically ill patients. In a retrospective study of 2782 patients ad-mitted to a medical-surgical ICU, Donati et al. [11] were the first to report close correlation between glycemic variability (GLI, SD, CV and MAGE) and acquired infec-tions in diabetic and nondiabetic patients, with higher discriminative values observed for GLI and CV. Our findings also point to this correlation though since it
was not a primary endpoint this correlation needs to be confirmed.
Many retrospective studies have revealed a relation-ship between high glycemic variability and poor out-comes in critically ill patients. To date, however, there are no sufficiently established standardized methods to control such variability. We could nevertheless speculate that, by reducing insulin requirements and plasma and capillary glucose levels, the use of specific formulas for diabetes would be useful for this purpose. Further pro-spective, randomized studies in large patient series are warranted to confirm this relationship and its potential therapeutic consequences.
Strengths and limitations
As strengths of this study, we should mention the idea that glycemic control can be modified using specific enteral nutrients in the critically ill patient; also the external validity of the methodology (prospective, blind-randomized, multicenter) and the generalizability of results. Its main limitations are that it was an open-label study, so some of its results (especially effects on infectious complications) need to be considered with caution. The use of capillary samples for blood glucose instead of arterial samples and use of the point-of-care glucose meter could be considered a further limitation. Consensus recommendations published in 2013 [43] highlight the need to obtain arterial rather than capil-lary blood samples. This was selected as the standard-ized method by the researchers at the nine hospitals given it was logistically nonviable to collect arterial blood samples at the frequency necessary at two of the centers. However, regardless of the greater or lesser reliability of absolute glycemia values, the use of capil-lary samples should not affect the comparisons made between the three groups of patients. As a final limita-tion, the sample size precluded reaching conclusions on outcome measures (such as mortality) other than those related to glycemic or infection control.
Although the components of a diabetic-specific formula are important, no marked differences were observed in the impacts of the two such formulas examined here. Thus, to confirm the present findings and further examine EN effects on glycemic variability and mortality, we recommend comparing the latest-generation diabetes-specific formula with a standard formula in a multicenter, double-blind trial in a large patient sample.
Conclusions
ICU-acquired ventilator-associated pneumonia and tracheo-bronchitis when compared with that of a standard high-protein formula. Similar findings were obtained for the use of another diabetes-specific formula of different composition.
Our results highlight the need for double-blind studies with glycemic variability as the primary endpoint in large critically ill patient populations to address the impacts of these enteral nutrition formulas on outcomes such as acquired infections, hospital stay and short- and medium-term mortality.
Key messages
Few studies have explored the possible benefits of diabetes-specific EN formulas in terms of controlling hyperglycemia, glucose variability and acquired infectious complications.
In our study, compared with a high-protein standard EN formula, a high-protein diabetes-specific formula reduced insulin requirements, glucose variability, and plasma and capillary glycemia in mechanically ventilated, hyperglycemic ICU patients.
Our results also point to beneficial impacts of such a formula on ICU-acquired infections such as venti-lator-associated tracheobronchitis and pneumonia. However, further efforts in the form of larger clinical trials are required to assess the capacity of these formulas to reduce the risk of acquired infections in these patients.
Additional files
Additional file 1:Ethics committees that approved the study at each institution.(DOC 24 kb)
Additional file 2: Table S1.Insulin therapy protocol. (DOCX 19 kb)
Additional file 3: Figure S1.Patient numbers per treatment group during the course of follow-up. (DOCX 12 kb)
Abbreviations
ANOVA:analysis of variance; APACHE: Acute Physiology and Chronic Health Evaluation; BMI: body mass index; CV: coefficient of variation;
DHA: docosahexaenoic acid; EN: enteral nutrition; EPA: eicosapentaenoic acid; GLI: glycemic lability index; GLM: generalized linear model; GRV: gastric residual volume; GV: glucose variability; HOMA: Homeostasis Model Assessment; ICU: intensive care unit; MAGE: mean amplitude of glycemic excursions; MCG: mean capillary glycemia; MUFA: monounsaturated fatty acid; MV: mechanical ventilation; PN: parenteral nutrition;
PUFA: polyunsaturated fatty acid; SD: standard deviation; SOFA: Sequential Organ Failure Assessment; VR: volume ratio.
Competing interests
The authors have previously participated in activities financed by the pharmaceutical industry for the marketing of nutritional products. These activities include participation in clinical trials and educational programs, as well as financial support for attending scientific events.
No pharmaceutical company participated in the preparation, discussion, writing and collection of results at any stage of this study.
The study was partially financed by Vegenat Nutrition Spain. Vegenat NS provided the study formula, web design for the study and support for statistical analysis by an independent company and for researcher meetings.
Authors’contributions
AM conceived of the study, participated in its design and coordination, participated in patient recruitment and helped to draft the manuscript. JCM conceived of the study, participated in its design and coordination, participated in patient recruitment and helped to draft the manuscript. CVA participated in the design of the study, participated in patient recruitment and helped to revise the manuscript. GL participated in the design of the study, participated in patient recruitment and helped to revise the manuscript. MZ participated in the design of the study, participated in patient recruitment and helped to revise the manuscript. JIH participated in the design of the study, participated in patient recruitment and helped to revise the manuscript. JAE participated in the design of the study,
participated in patient recruitment and helped to revise the manuscript ABM participated in the design of the study, participated in patient recruitment and helped to revise the manuscript. FML participated in the design of the study, participated in patient recruitment and helped to revise the manuscript. All authors read and approved the final manuscript.
Author details
1Intensive Care Unit, Hospital Clínico Universitario, Avda Blasco Ibáñez 17,
46010 Valencia, Spain.2Intensive Care Unit, Hospital Universitario 12 de
Octubre, Avda de Cordoba s/n, 28041 Madrid, Spain.3Intensive Care Unit,
Hospital Universitario de Fuenlabrada, Camino del Molino 2, 28942 Fuenlabrada, Madrid, Spain.4Clinic and Dietetics Nutrition Unit, Hospital
Virgen de las Nieves, Avda Fuerzas Armadas 2, 18014 Granada, Spain.
5Intensive Care Unit, Hospital Universitario de Donostia, Paseo Dr.
Beguiristain s/n, 20080 Donostia, Spain.6Intensive Care Unit, Hospital
Universitario de Bellvitge, C/ Feixa Llarga 1, 08907L’Hospitalet de Llobregat, Barcelona, Spain.7Intensive Care Unit, Hospital General Universitario, C/
Pintor Baeza s/n, 03005 Alicante, Spain.8Intensive Care Unit, Hospital Clínico
San Carlos, C/ Prof. Martín Lagos s/n, 28040 Madrid, Spain.9Intensive Care
Unit, Hospital General Universitario Reina Sofía, Avda Intendente Jorge Palacios 1, 30003 Murcia, Spain.
Received: 5 August 2015 Accepted: 19 October 2015
References
1. Mizock BA. Alterations in carbohydrate metabolism during stress: a review of the literature. Am J Med. 1995;98:75–84.
2. Mechanick JI. Metabolic mechanisms of stress hyperglycemia. J Parenter Enteral Nutr. 2006;30:157–63.
3. Finney SJ. Glucose control and mortality in critically ill patients. JAMA. 2003;290:2041–7.
4. Krinsley JC. Association between hyperglycemia and increased hospital mortality in a heterogeneous population of critically ill patients. Mayo Clin Proc. 2003;78:1471–8.
5. Corstjens AM, van der Horst IC, Zijlstra JG, Groeneveld AB, Zijlstra F, Tulleken JE, et al. Hyperglycaemia in critically ill patients: marker or mediator of mortality? Crit Care. 2006;10:R216.
6. Vincent JL, Rello J, Marshall J, Silva E, Anzueto A, Martin CD, et al. EPIC II Group of Investigators International study of the prevalence and outcomes of infection in intensive care units. JAMA. 2009;302:2323–9.
7. Freire AX, Bridges L, Umpierrez GE, Kuhl D, Kitabchi AE. Admission hyperglycemia and other risk factors as predictors of hospital mortality in a medical ICU population. Chest. 2005;128:3109–16.
8. Egi M, Bellomo R, Stachowski E, French CJ, Hart G. Variability of blood glucose concentration and short-term mortality in critically ill patients. Anesthesiology. 2006;105:244–52.
9. Hermanides J, Vriesendorp TM, Bosman RJ, Zandstra DF, Hoekstra JB, Devries JH. Glucose variability is associated with intensive care unit mortality. Crit Care Med. 2010;38:838–42.
11. Donati A, Damiani E, Domizi R, Botticelli L, Castagnani R, Gabbanelli V, et al. Glycaemic variability, infections and mortality in a medical-surgical intensive care unit. Crit Care Resusc. 2014;16:13–23.
12. Alish CJ, Garvey WT, Maki KC, Sacks GS, Hustead DS, Hegazi RA, et al. A diabetes-specific enteral formula improves glycemic variability in patients with type 2 diabetes. Diabetes Technol Therap. 2010;12:419–25.
13. Bagshaw SM, Bellomo R, Jacka MJ, Egi M, Hart GK, George C. The impact of early hypoglycemia and blood glucose variability on outcome in critical illness. Crit Care. 2009;13:R91.
14. NICE-SUGAR Study Investigators, Finfer S, Chittock DR, Su SY, Blair D, Foster D, et al. Intensive versus conventional glucose control in critically ill patients. N Engl J Med. 2009;360:1283–97.
15. Marik PE, Preiser JC. Toward understanding tight glycemic control in the ICU: a systematic review and metaanalysis. Chest. 2010;137:544–51. 16. Van den Berghe G, Wouters P, Weekers F, Verwaest C, Bruyninckx F, Schetz
M, et al. Intensive insulin therapy in the critically ill patients. N Engl J Med. 2001;345:1359–67.
17. Pittas AG, Siegel RD, Lau J. Insulin therapy for critically ill hospitalized patients: a meta-analysis of randomized controlled trials. Arch Intern Med. 2004;164:2005–11.
18. Wiener RS, Wiener DC, Larson RJ. Benefits and risks of tight glucose control in critically ill adults: a meta-analysis. JAMA. 2008;3008:933–44.
19. Ichai C, Preiser JC, for the Société Française d’Anesthésie-Réanimation (SFAR), Société de Réanimation de langue Française (SRLF) and the Experts group. International recommendations for glucose control in adult non diabetic critically ill patients. Crit Care. 2010;14:R 166.
20. Griesdale D, de Souza RJ, van Dam RB, Heyland D, Cook D, Malhotra A, et al. Intensive insulin therapy and mortality among critically ill patients: a meta-analysis including NICE-SUGAR study data. CMAJ. 2009;180:821–7. 21. Vaquerizo Alonso C, Grau Carmona T, Juan Díaz M. Guidelines for
specialized nutritional and metabolic support in the critically-ill patient. Update. Consensus SEMICYUC-SENPE: hyperglycemia and diabetes mellitus. Nutr Hosp. 2011;26 Suppl 2:46–9.
22. Elia M, Ceriello A, Laube H, Sinclair AJ, Engfer M, Stratton RJ. Enteral nutritional support and use of diabetes-specific formulas for patients with diabetes: a systematic review and meta-analysis. Diabetes Care. 2005;28:2267–79.
23. McMahon MM, Nystrom E, Braunschweig C, Miles J, Compher CH. A.S.P.E.N. Clinical guidelines: nutrition support of adult patients with hyperglycemia. J Parenter Enteral Nutr. 2013;37:23–36.
24. Canadian clinical practice guidelines. 2013. Available at http:// www.criticalcarenutrition.com. Accessed 30 September 2014. 25. Pohl M, Mayr P, Mertl-Roetzer M, Lauster F, Lerch M, Eriksen J, et al.
Glycaemic control in type II diabetic tube-fed patients with a new enteral formula low in carbohydrates and high in monounsaturated fatty acids: a randomised controlled trial. Eur J Clin Nutr. 2005;59:1221–32.
26. Voss AC, Maki KC, Garvey WT, Hustead DS, Alish C, Fix B, et al. Effect of two carbohydrate-modified tube-feeding formulas on metabolic responses in patients with type 2 diabetes. Nutrition. 2008;24:990–7.
27. Leon-Sanz M, Garcia-Luna PP, Sanz-Paris A, Gomez-Candela C, Casimiro C, Chamorro J, et al. Glycemic and lipid control in hospitalized type 2 diabetic patients: evaluation of 2 enteral nutrition formulas (low carbohydrate-high monounsaturated fat vs high carbohydrate). J Parenter Enteral Nutr. 2005;29:21–9.
28. Crespillo MC, Olveira G, de Adana MS R, Rojo-Martinez G, Garcia-Aleman J, Olvera P, et al. Metabolic effects of an enteral nutrition formula for diabetes: comparison with standard formulas in patients with type 1 diabetes. Clin Nutr. 2003;22:483–7.
29. Vaisman N, Lansink M, Rouws CH, van Laere KM, Segal R, Niv E, et al. Tube feeding with a diabetes-specific feed for 12 weeks improves glycaemic control in type 2 diabetes patients. Clin Nutr. 2009;28:549–55. 30. Mesejo A, Acosta JA, Ortega C, Vila J, Fernández M, Ferreres J, et al.
Comparison of a protein disease-specific enteral formula with a high-protein enteral formula in hyperglycemic critically ill patients. Clin Nutr. 2003;22:295–305.
31. Standards of medical care in diabetes. American Diabetes Association. Diabetes Care. 2013;36 Supp 1:S11–66.
32. Valencia E, Marin A, Hardy G. Nutrition therapy for acute renal failure: a new approach based on‘risk, injury, failure, loss, and end-stage kidney’ classification (RIFLE). Curr Opin Clin Nutr Metab Care. 2009;12:241–4.
33. HOMA calculator. Available at http://www.dtu.ox.ac.uk/homacalculator/ index.php. Accessed 30 September 2014.
34. Ryan EA, Shandro T, Green K, Paty BW, Senior PA, Bigam D, et al. Assessment of the severity of hypoglycemia and glycemic lability in Type 1 diabetic subjects undergoing islet transplantation. Diabetes. 2004;53:955–62. 35. Montejo JC. Enteral nutrition-related gastrointestinal complications in
critically ill patients: a multicenter study. The Nutritional and Metabolic Working Group of the Spanish Society of Intensive Care Medicine and Coronary Units. Crit Care Med. 1999;27:1447–53.
36. Montejo JC, Miñambres E, Bordejé L, Mesejo A, Acosta J, Heras A, et al. Gastric residual volume during enteral nutrition in ICU patients: the REGANE study. Intensive Care Med. 2010;36:1386–93.
37. Calandra T, Cohen J. The international sepsis forum consensus conference on definitions of infection in the intensive care unit. Crit Care Med. 2005;33:1538–48.
38. Horan TC, Andrus M, Dudeck MA. CDC/NHSN surveillance definition of health care-associated infection and criteria for specific types of infections in the acute care setting. Am J Infect Control. 2008;36:309–32.
39. Bochicchio GV, Bochicchio KM, Joshi M, Ilahi O, Scalea TM. Acute glucose elevation is highly predictive of infection and outcome in critically injured trauma patients. Ann Surg. 2010;252:597–602.
40. Hanazaki K, Maeda H, Okabayashi T. Relationship between perioperative glycemic control and postoperative infections. World J Gastroenterol. 2009;15:4122–5.
41. Hemmila MR, Taddonio MA, Arbabi S, Maggio PM, Wahl WL. Intensive insulin therapy is associated with reduced infectious complications in burn patients. Surgery. 2008;144:629–37.
42. Van den Berghe G, Wilmer A, Hermans G, Meersseman W, Wouters P, Milants I, et al. Intensive insulin therapy in the medical ICU. N Engl J Med. 2006;354:449–61.
43. Finfer S, Wernerman J, Preiser JCH, Cass T, Desaive T, Hovorka R, et al. Clinical review: consensus recommendations on measurement of blood glucose and reporting glycemic control in critically ill adults. Crit Care. 2013;17:R 229.
Submit your next manuscript to BioMed Central and take full advantage of:
• Convenient online submission
• Thorough peer review
• No space constraints or color figure charges
• Immediate publication on acceptance
• Inclusion in PubMed, CAS, Scopus and Google Scholar
• Research which is freely available for redistribution