City, University of London Institutional Repository
Citation
:
Botting, N., Jones, A., Marshall, C., Denmark, T., Atkinson, J. and Morgan, G.
(2017). Non-verbal executive function is mediated by language: A study of deaf and hearing
children. Child Development, 88(5), pp. 1689-1700. doi: 10.1111/cdev.12659
This is the published version of the paper.
This version of the publication may differ from the final published
version.
Permanent repository link:
http://openaccess.city.ac.uk/15000/
Link to published version
:
http://dx.doi.org/10.1111/cdev.12659
Copyright and reuse:
City Research Online aims to make research
outputs of City, University of London available to a wider audience.
Copyright and Moral Rights remain with the author(s) and/or copyright
holders. URLs from City Research Online may be freely distributed and
linked to.
City Research Online:
http://openaccess.city.ac.uk/
[email protected]
Nonverbal Executive Function is Mediated by Language: A Study of Deaf
and Hearing Children
Nicola Botting
City University of London
Anna Jones, Chloe Marshall, Tanya Denmark,
and Joanna Atkinson
University College London
Gary Morgan
City University of London and University College London
Studies have suggested that language and executive function (EF) are strongly associated. Indeed, the two are
dif-ficult to separate, and it is particularly difficult to determine whether one skill is more dependent on the other.
Deafness provides a unique opportunity to disentangle these skills because in this case, language difficulties have
a sensory not cognitive basis. In this study, deaf (n=108) and hearing (n =125) children (age 8 years) were
assessed on language and a wide range of nonverbal EF tasks. Deaf children performed significantly less well on
EF tasks, even controlling for nonverbal intelligence and speed of processing. Language mediated EF skill, but the reverse pattern was not evident. Findings suggest that language is key to EF performance rather than vice versa.
The association of executive function (EF) and lan-guage is one that is currently of fast growing inter-est to researchers and clinicians. EF is a term used to define the complex set of cognitive abilities which enable us to coordinate mental processes and manipulate information, solve novel problems, sequence information, and generate new strategies to accomplish goals in a flexible way (Elliott, 2003; Funahashi, 2001). In addition to storing information in short-term memory, children also need to be able to process information flexibly, inhibit nonuseful responses, and manage the input in order to achieve success on higher level cognitive tasks. In the Baddeley (2003) model of working memory, EFs are served by short-term phonological and visuospatial systems. EF development has been linked with several important associated domains, in particular, behavioral self-regulation and social-emotional competence (McClelland, Cameron,
Wanless, & Murray, 2007). Additionally, the impact of environmental factors, such as childhood pov-erty, indicates EF is malleable, especially in early childhood (Raver, Blair, & Willoughby, 2013).
Language is also a key developmental skill and it is well established that EF and language are highly interrelated. Work focusing on children with typical development confirms this association (see Kuhn, Willoughby, Wilbourn, Vernon-Feagans, & Blair, 2014 for a large prospective study), as does evidence from atypical groups such as those with developmen-tal language impairment (Henry, Messer, & Nash, 2012) and autism (Akbar, Loomis, & Paul, 2013).
It has been difficult to untangle the direction of influence in previous research. Some theories argue that language development is more important for EF abilities than the other way around. Zelazo et al.’s cognitive complexity and control theory (Zelazo & Frye, 1998; Zelazo et al., 2003), for exam-ple, argues that rules derived from language learn-ing enable manipulation of cognitive processes via internal representations. In the few existing longitu-dinal studies, early language appears to predict
The authors would like to thank all the children, families, and schools who took part in this study. The research was funded by the ESRC (Grant 620-28-600 Deafness, Cognition and Language Research Centre). Thanks also to Susan Gathercole and David Messer, who both generously discussed and commented on the contents of this article; to Michelle St Clair for statistical advice; and to Elena Toscano for additional help in preparing the manu-script for submission.
Correspondence concerning this article should be addressed to Nicola Botting, Language and Communication Science, City University London, Northampton Square, London EC1V0HB, United Kingdom. Electronic mail may be sent to nicola.botting. [email protected].
©2016 The Authors
Child Development published by Wiley Periodicals, Inc. on behalf of Society for Research in Child Development.
This is an open access article under the terms of the Creative Commons Attribution License, which permits use, distribution and reproduction in any medium, provided the original work is properly cited.
later self-regulation skills and EF in typically devel-oping children (Kuhn et al., 2014; Petersen, Bates, & Staples, 2015) more than the other way around. However, other schools of thought posit cognitive development, including executive memory skills, as a necessary component of language development in typical (Baddeley, 2003) and atypical (Pellicano, 2010) groups. Although language and EF are likely to be at least partially bidirectionally related during development, a model that identifies which is the stronger influence would be useful both theoreti-cally and clinitheoreti-cally.
One investigative approach that attempts to address this question is the comparison of typically developing children with individuals who have developmental disorders. Such populations present an opportunity to explore development when par-ticular skills are less than optimal. They therefore offer the potential to discover more about the direc-tion of reladirec-tions between different developmental skills that are not as visible when development is proceeding as expected. It is already well estab-lished, for example, that children with developmen-tal disorders such as autism (Hughes, Russell, & Robbins, 1994; Ozonoff, Pennington, & Rogers, 1991), attention deficit hyperactivity disorder (Gau & Shang, 2010; Geurts et al., 2004; Pellicano, 2010; Willcutt, Doyle, Nigg, Faraone, & Pennington, 2005), those at risk of dyslexia (Gooch, Thompson, Nash, Snowling, & Hulme, 2016), and those with developmental language impairment (Henry et al., 2012; Im-Bolter, Johnson, & Pascual-Leone, 2006) have poorer EF than their typical peers.
Research involving children with developmental disorders (rather than reduced sensory input as in deafness) goes someway to indicating that deficits in language and EF are associated. However, when considering whether one skill mediates the other, these designs are confounded by the potential cogni-tive difficulties seen in these populations. In Henry et al.’s (2012) study of children with language impairment, EF was found to relate directly to lan-guage skill, but at the same time EF showed unique predictive power for membership of the clinical developmental language group, even after control-ling for verbal IQ. The authors suggested that under-lying cognitive difficulties may be at least partly influential in language development rather than vice versa. However, it is not clear from studies of chil-dren with developmental disorder whether EF defi -cits lead to poor language or whether other cognitive factors are also at play, influencing the development of both EF and language development (Bishop, Nation, & Patterson, 2014).
In contrast, children who are deaf but otherwise typically developing are an interesting group to study in this respect. Deaf children offer a relatively “pure” way of exploring the association of EF and language because their language development is delayed by sensory factors rather than by a cogni-tive deficit per se. The majority of deaf children have normal cognitive ability, as measured by non-verbal IQ tasks, in contrast to their delayed lan-guage skills (Marschark & Hauser, 2008). Nevertheless, deaf children as a group have previ-ously been shown to perform more poorly on EF tasks (Beer, Kronenberger, & Pisoni, 2011; Figueras, Edwards, & Langdon, 2008; Hintermair, 2013; Kronenberger, Colson, Henning, & Pisoni, 2014) as well as having low scores on language tasks.
Thus far, the number of studies on deaf children that report both EF andlanguage data is very small. In those that exist, methodological limitations make it difficult to reach conclusions. For example, some studies have only used questionnaire data (Hinter-mair, 2013) and other studies have used a limited set of only one or two experimental tasks (e.g., Oberg & Lukomski, 2011). Some research has selected only certain groups of deaf children such as those with cochlear implants (e.g., Kronenberger et al., 2014) or with hearing aids (Stiles, McGregor, & Bentler, 2012). The hearing status of the parents is also sometimes not included despite affecting performance on language tasks, with children of deaf parents scoring better (e.g., Lederberg, 2006). In most of these articles, sample size is limited, restricting the use of complex analyses on the data sets. One exception is a study by Figueras et al. (2008), which used a larger sample of deaf children and a more extensive task battery than most and which came to the conclusion that language might mediate EF. However, their study still did not have a large enough number of participants to demon-strate this statistically.
especially true in groups where language diffi cul-ties are known to occur (Botting, Psarou, Caplin, & Nevin, 2013). Therefore, the question of whether EF mediates language development or whether lan-guage influences EF development remains open.
Present Study
This study investigates EF and language in typi-cally developing children and in children who are deaf (and are at risk of language delay caused by sensory difficulties). This is important because it separates out the confounding cognitive issues seen in studies of other atypical groups. We overcome many previous methodological limitations evident in existing literature by (a) reporting on a large group of deaf children selected to be widely repre-sentative of the whole population (n = 108), (b) including a carefully matched comparison group of hearing peers (n= 125), (c) using measures care-fully designed to be as explicitly and implicit non-verbal as possible and modality fair (across spoken and signed language), and (d) controlling for speed of processing and general nonverbal ability. The analyses aim to address the following questions:
1. Does atypical language experience (in this case being deaf) affect performance on nonverbal EF tasks compared to age-matched hearing peers? Is this true even after controlling for general cognitive ability and speed of process-ing?
2. Does language correlate with EF tasks in each group?
3. Does language mediate EF differences between the groups or vice versa?
Method
Participants
Children from two groups were recruited, those who were deaf and those with typical hearing. All children were living in the United Kingdom or Ire-land and had English or British Sign Language (BSL) as their primary language. Children with explicit additional diagnoses such as global intellec-tual disability, autism, cerebral palsy, or Down syn-drome were not recruited to the study.
In total, 108 deaf children took part, 49 (45%) girls and 59 (55%) boys with a mean age of 8;10 years (SD= 1;9; range = 5;9–11;8). Most of these groups were White British (72%) with 4 of the remaining participants being mixed race, 17 Asian,
and 9 from other backgrounds. Overall, 86 (84%) of these children were born deaf, and all deaf children were deaf before starting school at the age of 5. Forty-six (45%) of the families who responded to the questionnaire reported a genetic basis to the child’s deafness, 9 (9%) reported an illness-based cause, and for 48 (47%) the cause was unknown. Nineteen deaf children were born prematurely. Twenty-four (22%) children had deaf parents, and 16 of these 24 also had a deaf sibling. In terms of hearing level, 13 children were classed as mild/ moderately deaf in their better ear and the remain-der were severely or profoundly deaf in both ears. Overall, the mean unaided hearing levels were left ear: 90.4 db (SD= 20.0) and right ear: 88.7 db (SD= 20.1). Sixty-nine (64%) children wore hearing aids all or some of the time, and 42 (39%) children had cochlear implants. Of the children with cochlear implants, 12 had bilateral implants, and the average age of implant was 3;2 years (SD= 1;9). In the deaf group as a whole, 31 used BSL as their main form of communication, 56 pri-marily used spoken English, and 15 were using Sign Supported English (SSE), an adapted sign sys-tem using English grammar, as their main commu-nication mode. In order to gain a large, widely representative sample, we recruited from both spe-cialist deaf schools (11 children from residential and 19 from nonresidential deaf schools) and stream educational settings (50 children from main-stream schools with specialist classrooms/units for deaf children and 28 children from mainstream schools without such resources).
In total, 125 hearing children took part in the study. The children were recruited from a wide range of primary schools in rural and urban set-tings, and where possible from the same school as deaf participants to control for socioeconomic sta-tus. There were 57 (46%) girls and 68 (54%) boys with a mean age of 8;11 years (SD= 1;5; range = 6;5–11;11). As for the deaf children, the majority of the group were White British (85%), 6 were mixed race, 7 Asian, and 6 from other back-grounds.
subsequently controlled for in the analyses. As a group, the deaf children also scored below 1 SD
from the mean on vocabulary confirming that, on average, this group was language delayed.
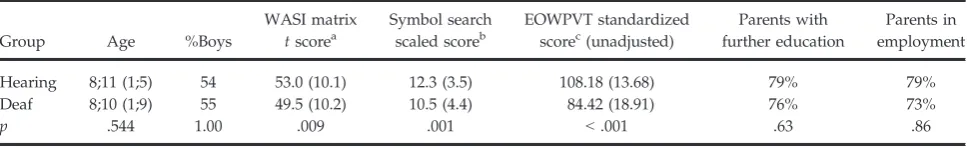
Table 1 shows the age, gender, parental educa-tion and job status, general cognitive ability, speed of processing, and estimated standard vocabulary score of each group. For vocabulary the standard score is an estimate based on standard administra-tion and using hearing norms. For analysis we use an adjusted raw score (see below).
Measures
Executive Function
Odd one out span (Henry, 2001) is a measure of
executive-loaded visuospatial working memory in which the child has to process which shape is the odd one out while storing the location of each odd shape in a grid. At the end of each trial of items, the child must recall the locations of the odd shapes in cor-rect sequence by pointing to the corcor-rect box on a series of empty grids. Trials gradually increase in number to a maximum of six locations to recall. After two errors within a block, the test is termi-nated. The total number of trials with locations cor-rectly recalled is then calculated.
In the backward spatial span task (Wechsler Non-verbal Scale of Ability, Wechsler & Naglieri, 2006), children are instructed to tap blocks in a sequence reversed from one shown by the experimenter. Tri-als gradually increase ranging up to a span of nine. After two errors at the same span length, the test is terminated and one point awarded for each correct sequence to give a score. This is also a test of execu-tive-loaded visuospatial working memory.
For design fluency (NEPSY, Korkman, Kirk, & Kemp, 1998), children are given a sheet of paper showing boxes containing dot arrays and instructed to produce as many different designs as possible, in 1 min, by joining two or more dots with a straight
line. The assessment measures visuospatial cognitive fluency.A score is calculated from the total number of unique designs created.
Children’s Color Trails Test 1 and 2 (Llorente, Williams, Satz, & D’Elia, 2003) is a test of cognitive shifting. In Test 1, children are required to draw a line connecting each numbered circle (from 1 to 15) as quickly as possible. All odd numbers are printed in a yellow circle and even numbers are printed in a pink circle. Test 2 contains two sets of encircled numbers: One set printed in a pink background and another printed in a yellow background. The child is instructed to connect numbers in ascending order, alternating between pink and yellow circles. In the present study, an interference score was cal-culated to give “additional time” taken in the sec-ond csec-ondition.
The Tower of London (ToL) is an executive plan-ning task in which colored disks are moved from their initial position, one at a time, to match a goal set. The ToL is a simplified version of the original Tower of Hanoi task (Shallice, 1982). The Psychology Experiment Building Language version 0.14 (Mueller & Piper, 2014) was presented via laptop. Instructions were presented verbally/in sign language with use of the first trial as an example. The children com-pleted seven remaining trials. The number of addi-tional moves taken to complete the task over the expected number was recorded.
[image:5.595.47.531.621.695.2]A computerized version of the Simon task, a mea-sure of cognitive inhibitory control, was administered via laptop. A fixation cross appeared in the center of the screen before each trial. On each trial, a pic-ture of a sun or an apple appeared, either left or right of center. The children were instructed to press the key marked with an apple sticker on the left-hand side of the keyboard when they saw an apple; and when a sun picture appeared, to press the key marked with a sun sticker on the right-hand side of the keyboard. Each stimulus appeared for 750 ms. The order of trials was randomized for each child and no feedback was given. There were
Table 1
Descriptive Characteristics of the Sample
Group Age %Boys
WASI matrix
tscorea
Symbol search scaled scoreb
EOWPVT standardized scorec(unadjusted)
Parents with further education
Parents in employment
Hearing 8;11 (1;5) 54 53.0 (10.1) 12.3 (3.5) 108.18 (13.68) 79% 79%
Deaf 8;10 (1;9) 55 49.5 (10.2) 10.5 (4.4) 84.42 (18.91) 76% 73%
p .544 1.00 .009 .001 <.001 .63 .86
Note.WASI=Wechsler Abbreviated Scale of Intelligence; EOWPVT=Expressive One-Word Picture Vocabulary Test.
a
a total of 32 trials, half congruent (picture on the
same side as the response) and half incongruent (picture on the opposite side of the response). The increased time to respond to incongruent items is known as the Simon effect (Simon, 1990), and an “interference score” was therefore created by sub-tracting congruent from incongruent scores.
Language
The Expressive One-Word Picture Vocabulary Test (EOWPVT; Brownell, 2000) was used to test sin-gle-word vocabulary production following standard basal and ceiling administration guidelines. The chil-dren must name single pictures (primarily simple nouns, e.g., train; but also some verbs, e.g., eating, and category labels, e.g., fruit). The EOWPVT was developed in the United States, and so three pictures were substituted to make the test more relevant for children in the United Kingdom (e.g.,raccoon? bad-ger). Kyle et al. (2006) have previously used this measure with groups of deaf children and have pre-determined acceptable signs for the items; however, in order to ensure that the EOWPVT could be used to assess the vocabulary of both hearing and signing deaf children, 15 test items that do not exist in BSL (e.g., cactus, banjo) were removed after administra-tion. These adjusted EOWPVT scores are used here for fairer assessment and analysis, but using the fully scored version made no difference to any of the overallfindings in this report, and the standardized means are given in Table 1 to give an indication of vocabulary level for both groups.
Control Tasks
The Matrix Reasoning subtest of the Wechsler Abbreviated Scale of Intelligence (WASI; Wechsler, 1999) was administered as a control measure for
nonverbal cognitive ability. The child is presented with a pattern with a missing section and must select the correct response from five choices. After 4/5 successive incorrect answers, the test is termi-nated.
Speed of processingwas measured using the Sym-bol Search subtest (Wechsler Intelligence Scale of Children, 3rd ed.; Wechsler, 1991). Children must identify whether the target symbol appears in rows of symbols as fast as possible.
Procedure
Ethical approval was granted from the UCL Research Ethics Committee. Children were recruited
all across the U.K. by contacting deaf schools, main-stream schools with provision for deaf children, or through the National Deaf Children’s Society. Informed written consent was obtained from par-ents/guardians prior to testing; children gave ver-bal consent at the beginning of the session and were told that they could opt out at any time.
Testing took place in a quiet room at school or at the child’s home. The session lasted between 60 and 75 min, and was video recorded. The children were able to take short breaks between tasks if nec-essary. Testing was carried out by two researchers. One was a hearing native user of BSL (i.e., an adult with deaf parents), who was highly experienced in communicating with deaf children. She used BSL in all instructions and as the main communication for testing children for whom this was the preferred language. A second experimenter, with good sign-ing skills, tested deaf children whose preferred lan-guage was spoken English or SSE, and the hearing children. In a small number of cases where children were bilingual/bimodal (n = 18), the main commu-nication mode identified by parents was not always the language chosen by the child at the point of testing. In these instances, the language chosen by the child was used as the testing language. The tasks were selected to require minimal verbal/ signed instruction, and sufficient practice trials were included to ensure that the tasks were well under-stood. The tests were administered in the same order for all participants.
Analysis
Simple group differences were examined using
specific assessments, but in all cases this was< 10% of the total cohort. Analysis was performed using SPSS v22.0. Armonk, NY: IBM Corp.
Results
Deaf and Hearing Group Comparisons
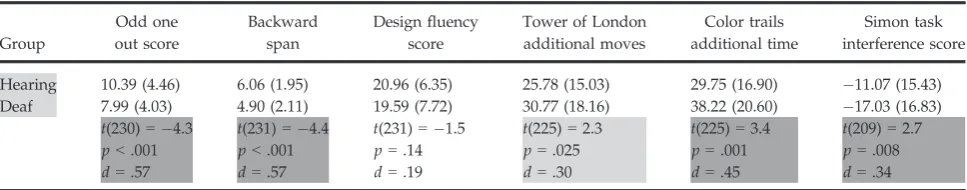
Deaf children scored less favorably on all of the tasks in the test battery except design fluency when compared to hearing peers. Raw vocabulary scores were also significantly different between groups, hearing group: M= 86.6, SD = 14.1; deaf group:
M = 64.2, SD= 19.2; t(230)= 10.18, p < .001
d = 1.3.
After controlling for group differences in nonver-bal intelligence (as measured by WASI matrix reasoning) and speed of processing (as measured by symbol search), highly similar results were obtained. However, differences between groups on the ToL task and the color trails disappeared once nonverbal ability and speed of processing were con-trolled for, and designfluency remained nonsignifi -cant (see Table 2 for details).
All EF scores were transformed into Z scores based on the hearing sample’s mean and SD to allow comparison across tests and to examine how many children scored in an impaired range. Because the definition of “normal range” varies across fields, we are using a statistically based norm threshold of 1 SD to designate impaired scores. ToL additional moves and color trails addi-tional time were calculated as (Z score91) to reverse scoring so that lower Z scores were less favorable in all cases. Figure 1 shows the pattern of the deaf group’s performance across all EF tasks. Although deaf children show a disadvantage on all tasks, none of the deaf group’s mean Z scores falls further than 1SD below the mean of the hearing
peers. However, a larger than expected proportion of deaf children fell into impaired ranges (1 and
2 SD from the hearing group mean; see Table 3 for details). Only a small group of deaf children scored above the normal range of the hearing group (maximum n = 15 for Design fluency). These
Z scores were used in all subsequent analyses and a composite EF score was created by summing these.
Correlations Between EF Tasks and Language
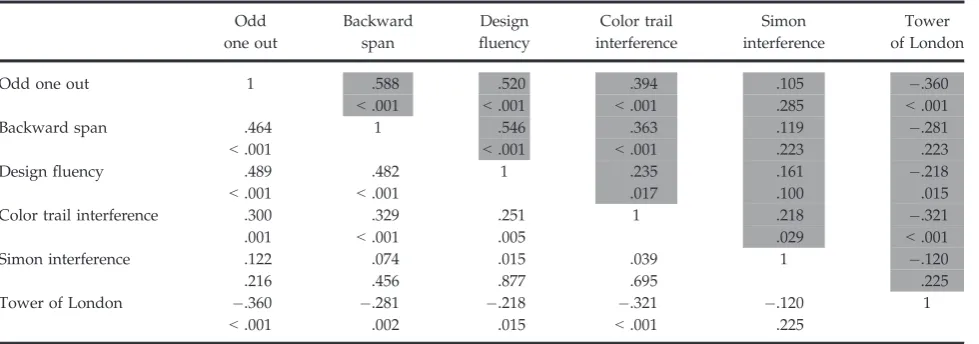
[image:7.595.301.528.318.497.2]Correlation analyses showed that EF tasks were all significantly correlated at p < .001 when the whole group (i.e., the deaf and hearing children combined) was considered (rvalues from .23 to .54) with the exception of inhibition (Simon task), which did not correlate significantly with fluency or plan-ning (ToL). All EF tasks correlated significantly
Table 2
Performance on Each Executive Function Measure (Raw Scores) by Group
Group
Odd one out score
Backward span
Designfluency score
Tower of London additional moves
Color trails additional time
Simon task interference score
Hearing 10.39 (4.46) 6.06 (1.95) 20.96 (6.35) 25.78 (15.03) 29.75 (16.90) 11.07 (15.43) Deaf 7.99 (4.03) 4.90 (2.11) 19.59 (7.72) 30.77 (18.16) 38.22 (20.60) 17.03 (16.83)
t(230)=4.3
p<.001
d=.57
t(231)=4.4
p<.001
d=.57
t(231)=1.5
p=.14
d=.19
t(225)=2.3
p=.025
d=.30
t(225)=3.4
p=.001
d=.45
t(209)=2.7
p=.008
d=.34
Note.Dark gray ( ) indicates differences that are significant before and after controlling for WASI (Wechsler Abbreviated Scale of
Intel-ligence) and symbol search. Light gray ( ) indicates differences that are significant before but not after controlling for WASI and sym-bol search. White (h) indicates no group differences before/after controlling for WASI and symbol search.
.20
.00
-.20
Mean Z-score -.40
-.60
-.80
[image:7.595.47.531.588.683.2]Odd One Out Backward Span Design Fluency Tower of London Colour Trails Simon Task
Figure 1. MeanZscore (95% CI) on each task for children in the
with the composite EF variable (r values from .4 to .77). Language was also significantly correlated with all individual measures (r values from .26 to .56, all p values < .001). Composite EF scores and vocabulary correlated strongly (r= .66,p < .001).
When groups were considered separately, the
hearing group showed significant correlations between all EF measures (r values from .22 to .49), between all EF measures and the composite variable (rvalues from .36 to .75), and between EF and lan-guage (rvalues from .34 to .57) except for inhibition (Simon task), which showed no relation to any indi-vidual EF task but still showed a significant correla-tion with the EF composite score (r = .36, p < .001). Inhibition also showed no correlation with vocabu-lary (r= .14, p = .15). Composite EF scores and lan-guage correlated strongly (r =.68,p < .001).
The deaf group showed significant associations between all measures of EF (r values from .22 to .59), between all EF measures and the composite variable (rvalues from .39 to .79), and between EF and vocabulary measures (rvalues from .23 to .48). Again inhibition (Simon task) was the only
exception and only showed an association with shifting (color trails; r= .22; p = .03), vocabulary (r= .23, p =.02), and the composite EF score (r= .39, p < .001). Again, composite EF scores and language correlated significantly (r= .57, p < .001; see Table 4 for within-group EF correlations).
Exactly the same pattern of results was seen when age was partialed out. There were two excep-tions for the deaf group where the correlation between inhibition and switching (color trails) became nonsignificant, but the correlation between inhibition and language became significant.
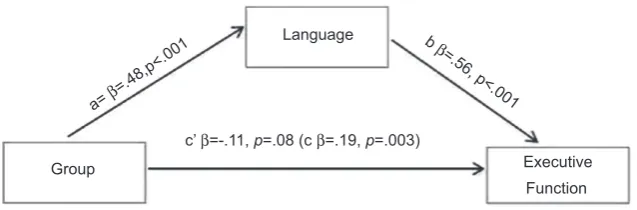
Mediation Analysis
[image:8.595.65.554.404.487.2]To test the hypothesis that language was mediat-ing the group difference in EF scores, a series of regression analyses were completed following Baron and Kenny (1986) who state that the effect of the mediator (Language) on the dependent variable (EF) must be greater than the effect of the indepen-dent variable (Group) on the DV and that the effect of the IV (Group) on the DV (EF) should be
Table 3
Number (%) of Deaf Children Outside of Normal Range
Threshold
Odd one out score
Backward span
Designfluency score
Tower of London additional moves
Color trails additional time
Simon task interference score
+2SD 2 (1.9) 3 (2.8) 6 (5.6) 0 (0) 0 (0) 1 (0.9)
+1SD 4 (3.7) 4 (3.7) 9 (8.3) 5 (4.9) 6 (5.8) 9 (8.5)
1SD 47 (43.5%) 52 (48.1%) 28 (25.9%) 20 (19.4%) 24 (23.3%) 44 (41.5%)
2SD 2 (1.9%) 11 (10.2%) 8 (7.4%) 10 (9.7%) 12 (11.7%) 14 (13.2%)
Note.Gray ( ) indicates differences that are significantly higher than expected from a normal distribution.
Table 4
Correlations Between Tasks for Deaf (Gray) and Hearing (White) Children
Odd one out
Backward span
Design fluency
Color trail interference
Simon interference
Tower of London
Odd one out 1 .588 .520 .394 .105 .360
<.001 <.001 <.001 .285 <.001
Backward span .464 1 .546 .363 .119 .281
<.001 <.001 <.001 .223 .223
Designfluency .489 .482 1 .235 .161 .218
<.001 <.001 .017 .100 .015
Color trail interference .300 .329 .251 1 .218 .321
.001 <.001 .005 .029 <.001
Simon interference .122 .074 .015 .039 1 .120
.216 .456 .877 .695 .225
Tower of London .360 .281 .218 .321 .120 1
[image:8.595.66.556.546.718.2]significantly reduced or absent after controlling for the mediator (Language). This is achieved by ini-tially running three regression analyses: (a) the direct effect of Group on Language, (b) the direct effect of Language on EF, and (c) the direct effect of Group on EF (see Figure 2). A mediation regression is then performed, examining the effect of Group (IV) on EF (DV) while controlling for Language (mediator). This is termed c0. Because groups were different on nonverbal ability and speed of process-ing, population norm-based z scores for these vari-ables were added in Step 1 as control varivari-ables for all regressions. For the final mediation regression, Step 2 contained the potential mediating variables (i.e., Language or EF composite Z score), and the
final step contained the dummy variable Group (hearing/deaf).
In our sample, the direct effect of Group on EF composite (c in Figure 2) showed an adj. R2 of .24 (b = .19;t = 3.0,p = .003); the direct effect of Group on Language adj. R2= .39 (a in Figure 2: b= .48; t= 8.9, p < .001); and the effect of Language on EF composite showed an adj. R2 of .46 (b in Figure 2:
b = .56;t = 9.5,p < .001). Thus, although all models are significant, the mediator (Language) shows a substantially larger predictive value for the depen-dent variable (EF) than group (IV).
The effect of Group on EF after controlling for language became nonsignificant (c0 in Figure 2:
b = .11; t =1.7, p = .08) and provided only 0.6% additional variance to the final model (adj.
R2= .47). To confirm the direction of this effect, the reverse regression was performed exploring the effect of Group (IV) on Language (DV) after con-trolling for EF (mediator). In this case, Group remained a highly significant predictor of language (b = .39; t= 7.9, p < .001) and added 13.4% of vari-ance to thefinal model (adj.R2= .58).
This suggests that language is mediating group differences seen in EF performance but not vice
versa. Removing Step 1 did not change the pattern of results.
Discussion
This study aimed to provide new information about the association between language and EF by inves-tigating these skills in deaf children, a population for whom language development is delayed by sen-sory rather cognitive disruption. The present research is to our knowledge the largest and most comprehensive study focusing on this population that has been conducted so far. The results of our investigation revealed two keyfindings.
First, even though this population presents with no primary cognitive disorder and some deaf chil-dren perform within the normal range, as a group deaf children score below hearing peers on the majority of EF tasks. Thefinding of lower EF in deaf children held even after accounting for speed of pro-cessing and nonverbal ability, and despite the tasks being carefully chosen for their nonverbal demands. As noted earlier, other studies have reported diffi -culties for deaf children on EF tasks, but these stud-ies have important limitations. Previous results have been drawn from small groups of deaf children (Marshall et al., 2015), often only recruited from selected deaf groups such as those with cochlear implants (Kronenberger et al., 2014) or with hearing aids (Stiles et al., 2012), that cross a wider age range (Luckner & McNeill, 1994), and which have used only one or two experimental tasks or tasks that are not genuinely comparable across deaf and hearing groups (Oberg & Lukomski, 2011; Remine, Care, & Brown, 2008; Surowiecki et al., 2002). Other studies (Hauser, Lukomski, & Samar, 2013; Hintermair, 2013) have relied entirely on parent and teacher questionnaires such as the Behavior Rating Inven-tory of Executive Function (Gioia, Isquith, Guy, &
Language
a= β
=.48,p<.001
b β
=.56, p<.001
Group Executive
c’ β=-.11, p=.08 (c β=.19, p=.003)
[image:9.595.128.447.575.680.2]Function
Figure 2. Illustration of mediation analysis a=Relation between Group and Language. b=Relation between Language and Executive
Kenworthy, 2000), which may measure different behaviors compared to direct assessments (Jahromi, Bryce, & Swanson, 2013). Therefore, the current study confirms earlier reports of poor EF in deaf children in a larger, more representative sample using“assessment-fair”tests of EF.
Second, our study sheds some light on whether language influences EF or whether the opposite is true. Some theorize that language is a driver in the development of EF abilities in children (e.g., Zelazo et al., 2003), whereas others describe working mem-ory and EF as a precursor for language develop-ment (e.g., Baddeley, 2003). The results from the current study support the former hypothesis: Lan-guage not only relates to EF but also has a role in mediating EF performance. The reverse association was not evident, suggesting that poorer EF does not lead to poorer language. However, longitudinal data are needed to confirm this and at this stage our cross-sectional data indicate only a concurrent relation.
Few studies comparing deaf and hearing chil-dren’s EF have included language measures. There are three notable exceptions: Remine et al. (2008), who found no association between lan-guage and EF; Figueras et al. (2008), who assessed EF tasks and language in a fairly large sample of deaf children (n= 47) and found that both were lower in the deaf group, and that EF and lan-guage were highly associated. Like the findings presented here, Figueras et al. concluded that EF impairment was a result of language delay; how-ever, their sample was not large enough to carry out a mediation analysis to investigate this fur-ther. Finally Stiles et al. (2012) noted in their small scale study (n= 18 deaf children) that indi-viduals with lower working memory scores also had lower vocabulary scores. A potential limita-tion of our study is that we have only one mea-sure of language skill, namely vocabulary. However, vocabulary was chosen for this study because it is one of the few ways in which the language of deaf and hearing participants can be directly compared, because the grammar of BSL is very different from that of spoken English (Sut-ton-Spence and Woll, 1999). We acknowledge that no vocabulary measure will ever enable perfect cross-language comparison between BSL and Eng-lish because items will have different lexical vari-ables in each language (e.g., frequency and age of acquisition); however, we argue that using vocab-ulary is the simplest available measure. Measures of receptive or productive language and syntax might reveal different relation.
Two obvious alternatives exist when considering possible reasons that language might affect EF skill. Either EF skills do not develop optimally in the context of poor language development or EF tasks (even nonverbal ones) are implicitly verbally encoded, and therefore low language skills impair performance on EF tasks. These scenarios are not mutually exclusive, and a combination of these is likely. A recent study on typically developing chil-dren and hearing chilchil-dren at risk of language/liter-acy difficulties suggested that EF and language were concurrently but not longitudinally related, which may support the latter explanation (Gooch et al., 2016). That is, deaf children’s EF performance may be affected by language at the time of testing, but language may not predict later EF develop-ment. In either case, however, we are confident that the results are not a simple artifact of our carefully chosen assessment-fair tasks.
Although this study involved a large sample of deaf participants over a wide geographical area within the UK, the vast majority of families were from a middle to high socioeconomic class. Future research is needed into atypical populations living with social disadvantage as recent work suggests that environmental factors may affect EF develop-ment (Raver, Blair, & Willoughby, 2013). Further-more, we have not included the specific language history of deaf children within these complex analy-ses because subsample sizes become too small. However, when native signers have been consid-ered in other studies, the same conclusion regard-ing language and cognition emerges: Native signers do not show the same working memory deficits as matched non-native signers when compared to hearing peers, suggesting that rich language envi-ronment matters for EF development (Marshall et al., 2015) rather than auditory input per se as suggested by some theorists (e.g., auditory scaffold-ing hypothesis; Conway, Pisoni & Kronenberger, 2009). Therefore, it is not the case that all deaf chil-dren have difficulties with language and EF. Our aim in the current study was to include the whole range of deaf children so that results were not skewed by using only the most severely EF-affected individuals.
McCann, Watkin, Worsfold, & Kennedy, 2010). Fur-ther studies are needed to investigate these links directly. However, establishing language as a medi-ator for EF has clinical and educational implica-tions: Language might be a useful predictor of a child’s wider abilities in classroom settings; and potentially, additional early and continued lan-guage training could also boost EF performance.
Examining the ways in which atypical early lan-guage experience relates to EF performance pro-vides us with a novel window onto possible developmental associations. Ongoing study of how language and EF are both related and separable is essential for a full understanding of both typical and atypical development, and may provide an evi-dence base for helping those with poorer perfor-mance in these important domains.
References
Akbar, M., Loomis, R., & Paul, R. (2013). The interplay of language on executive functions in children with ASD.
Research in Autism Spectrum Disorders, 7, 494–501. doi:10.1016/j.rasd.2012.09.001
Baddeley, A. (2003). Working memory: looking back and
looking forward.Nature reviews neuroscience,4(10), 829–
839.
Baron, R. M., & Kenny, D. A. (1986). The moderator–
medi-ator variable distinction in social psychological research:
Conceptual, strategic, and statistical considerations.
Jour-nal of PersoJour-nality and Social Psychology, 51, 1173. http:// psycnet.apa.org/doi/10.1037/0022-3514.51.6.1173 Beer, J., Kronenberger, W. G., & Pisoni, D. B. (2011).
Exec-utive function in everyday life: Implications for young
cochlear implant users. Cochlear Implants International,
12, S89–S91. http://dx.doi.org/10.1179/146701011X13
001035752570
Bishop, D. V., Nation, K., & Patterson, K. (2014). When words fail us: Insights into language processing from
developmental and acquired disorders. Philosophical
Transactions of the Royal Society B: Biological Sciences,369, 20120403. https://dx.doi.org/10.1098/rstb.2012.0403 Botting, N., Psarou, P., Caplin, T., & Nevin, L. (2013).
Short-term memory skills in children with specific
language impairment: The effect of verbal and
non-verbal task content. Topics in Language Disorders, 33,
313–327. https://dx.doi.org/10.1098/rstb.2012.0403
Brownell, R. (2000).Expressive One Word Picture Vocabulary
Test(3rd ed.). Novato, CA: Academic Therapy.
Dye, M. W., & Hauser, P. C. (2014). Sustained attention, selective attention and cognitive control in deaf and
hearing children. Hearing research, 309, 94–102.
doi:10.1016/j.heares.2013.12.001
Conway, C. M., Pisoni, D. B., & Kronenberger, W. G. (2009). The importance of sound for cognitive sequen-cing abilities the auditory scaffolding hypothesis.
Current Directions in Psychological Science, 18(5), 275–279. https://dx.doi.org/10.1111%2Fj.1467-8721.2009.01651.x Elliott, R. (2003). Executive functions and their disorders
imaging in clinical neuroscience.British Medical Bulletin,
65, 49–59. doi:10.1093/bmb/65.1.49
Figueras, B., Edwards, L., & Langdon, D. (2008).
Execu-tive function and language in deaf children. Journal of
Deaf Studies and Deaf Education, 13(3), doi:10.1093/ deafed/enm067
Funahashi, S. (2001). Neuronal mechanisms of executive
control by the prefrontal cortex. Neuroscience Research,
39, 147–165. doi:10.1016/S0168-0102(00)00224-8
Gau, S. S. F., & Shang, C. Y. (2010). Executive functions as endophenotypes in ADHD: Evidence from the Cambridge Neuropsychological Test Battery
(CAN-TAB). Journal of Child Psychology and Psychiatry, 51,
838–849. doi:10.1111/j.1469-7610.2010.02215
Geurts, H. M., Verte, S., Oosterlaan, J., Roeyers, H.,
Hart-man, C. A., Mulder, E. J., & Sergeant, J. A. (2004). Can
the Children’s Communication Checklist differentiate
between children with autism, children with ADHD,
and normal controls?Journal of Child Psychology &
Psychi-atry,45, 1437–1453. doi:10.1111/j.1469-7610.2004.00326
Gioia, G. A., Isquith, P. K., Guy, S. C., & Kenworthy, L. (2000). Behavior Rating Inventory of Executive
Func-tion. Child Neuropsychology, 6, 235–238. https://
dx.doi.org/10.1076/chin.6.3.235.3152
Gooch, D., Thompson, P., Nash, H. M., Snowling, M. J., & Hulme, C. (2016). The development of executive function and language skills in the early school years.
Journal of Child Psychology and Psychiatry, 57, 180–187. https://dx.doi.org/10.1111%2Fjcpp.12458
Hauser, P. C., Lukomski, J., & Samar, V. (2013). Reliability and validity of the BRIEF-A for assessing deaf college
students’executive function.Journal of Psychoeducational
Assessment,31, 363–374. doi:10.1177/0734282912464466
Marschark, M., & Hauser, P. C. (2012). How deaf students
learn. Oxford: OUP.
Henry, L. A. (2001). How does the severity of a learning
disability affect working memory performance?
Mem-ory, 9, 233–247. https://dx.doi.org/10.1080/096582100
42000085
Henry, L. A., Messer, D. J., & Nash, G. (2012). Executive
functioning in children with specific language
impair-ment. Journal of Child Psychology and Psychiatry, 53, 37–
45. doi:10.1111/j.1469-7610.2011.02430.x
Hintermair, M. (2013). Executive functions and behavioral problems in deaf and hard-of-hearing students at
gen-eral and special schools.Journal of Deaf Studies and Deaf
Education, 18, 344–359. https://dx.doi.org/10.1093/ deafed/ent003
Hughes, C., Russell, J., & Robbins, T. W. (1994). Evidence
for executive dysfunction in autism. Neuropsychologia,
32, 477–492. http://dx.doi.org/10.1016/0028-3932(94)
90092-2
Im-Bolter, N., Johnson, J., & Pascual-Leone, J. (2006).
Pro-cessing limitations in children with specific language
Development, 77, 1822–1841. doi:10.1111/j.1467-8624. 2006.00976
Jahromi, L. B., Bryce, C. I., & Swanson, J. (2013). The importance of self-regulation for the school and peer engagement of children with high-functioning autism.
Research in Autism Spectrum Disorders, 7, 235–246. http://dx.doi.org/10.1016/j.rasd.2012.08.012
Korkman, M., Kirk, U., & Kemp, S. (1998). NEPSY. A
developmental neuropsychological assessment. London, UK: Psychological Corporation.
Kronenberger, W. G., Colson, B. G., Henning, S. C., & Pisoni, D. B. (2014). Executive functioning and speech-language skills following long-term use of cochlear
implants. Journal of Deaf Studies and Deaf Education, 19,
456–470. http://doi.org/10.1093/deafed/enu011
Kuhn, L. J., Willoughby, M. T., Wilbourn, M. P., Vernon-Feagans, L., & Blair, C. B. (2014). Early communicative gestures prospectively predict language development
and executive function in early childhood. Child
Devel-opment, 85, 1898–1914. https://dx.doi.org/10.1111/ cdev.12249
Kyle, F. E., & Harris, M. (2006). Concurrent correlates and predictors of reading and spelling achievement in
deaf and hearing school children.Journal of Deaf Studies
and Deaf Education,11(3), 273–288.
Lederberg, A. R. (2006). Language development of deaf
children with hearing parents. In E. Lieven (Ed.),
Ency-clopedia of language and linguistics (2nd ed., pp. 361– 367). Oxford, UK: Elsevier.
Llorente, A. M., Williams, J., Satz, P., & D’Elia, L. (2003).
Children’s Color Trails Test. Lutz, FL: Psychological Assessment Resources.
Luckner, J. L., & McNeill, J. H. (1994). Performance of a group of deaf and hard-of-hearing students and a comparison group of hearing students on a series of
problem-solving tasks.American Annals of the Deaf, 139,
371–377. doi:10.1353/aad.2012.0290
Marshall, C., Jones, A., Denmark, T., Mason, K., Atkinson,
J., Botting, N., & Morgan, G. (2015). Deaf children’s
non-verbal working memory is impacted by their language
experience. Frontiers in Psychology, 6, 527. https://
dx.doi.org/10.3389/fpsyg.2015.00527
Marschark, M., & Hauser, P. C., 2008. Cognitive under-pinnings of learning by deaf and hard-of-hearing stu-dents. in Marschark & Hauser (eds) Deaf cognition:
Foundations and outcomes, pp. 3–23. Oxford: OUP.
McClelland, M. M., Cameron, C. E., Wanless, S. B., & Murray, A. (2007). Executive function, behavioral
self-regulation, and social-emotional competence. In
Con-temporary Perspectives on Social Learning in Early Child-hood Education,1, pp. 113–137. Charlotte, NC: IAP Mueller, S. T., & Piper, B. J. (2014). Psychology
Experi-ment Building Language and PEBL test battery.Journal
of Neuroscience Methods, 222, 250–259. https:// dx.doi.org/10.1016/j.jneumeth.2013.10.024
Oberg, E., & Lukomski, J. (2011). Executive functioning and the impact of a hearing loss: Performance-based measures and the Behavior Rating Inventory of
Executive Function (BRIEF). Child Neuropsychology, 17,
521–545. https://dx.doi.org/10.1080/09297049.2011.
555760
Ozonoff, S., Pennington, B. F., & Rogers, S. J. (1991).
Executive function deficits in high-functioning autistic
individuals: Relationship to theory of mind. Journal of
Child Psychology and Psychiatry, 32, 1081–1105. doi:10.1111/j.1469-7610.1991.tb00351
Pellicano, E. (2010). The development of core cognitive
skills in autism: A 3-year prospective study.Child
Devel-opment, 81, 1400–1416. https://dx.doi.org/10.1111/ j.1467-8624.2010.01481.x
Petersen, I. T., Bates, J. E., & Staples, A. D. (2015). The role of language ability and self-regulation in the
devel-opment of inattentive–hyperactive behavior problems.
Development and Psychopathology, 27, 221–237. http:// dx.doi.org/10.1017/S0954579414000698
Raver, C. C., Blair, C., & Willoughby, M. (2013). Poverty
as a predictor of 4-year-olds’ executive function: New
perspectives on models of differential susceptibility.
Developmental Psychology, 49, 292. https://dx.doi.org/ 10.1037/a0028343
Remine, M. D., Care, E., & Brown, P. M. (2008). Language ability and verbal and nonverbal executive functioning in deaf students communicating in spoken English.
Journal of Deaf Studies and Deaf Education, 13, 531–545. https://dx.doi.org/10.1093/deafed/enn010
Shallice, T. (1982). Specific impairments of planning.
Philosophical Transactions of the Royal Society B,298, 199– 209. doi:10.1098/rstb.1982.0082
Simon, J. R. (1990). The effects of an irrelevant directional cue on human information processing. In R. W. Proctor
& T. G. Reeve (Eds.), Stimulus-response compatibility: An
integrated perspective (pp. 31–86). Amsterdam, The Netherlands: North-Holland Press.
Stevenson, J., McCann, D., Watkin, P., Worsfold, S., & Kennedy, C. (2010). The relationship between language development and behaviour problems in children with
hearing loss. Journal of Child Psychology and Psychiatry,
51, 77–83. https://dx.doi.org/10.1111/j.1469-7610.2009.
02124.x
Stiles, D. J., McGregor, K. K., & Bentler, R. A. (2012).
Vocabulary and working memory in children fit with
hearing aids. Journal of Speech, Language, and Hearing
Research, 55, 154–167. https://dx.doi.org/10.1044/1092-4388(2011/11-0021)
Surowiecki, V. N., Sarant, J., Maruff, P., Blamey, P. J., Busby, P., & Clark, G. M. (2002). Cognitive processing in children using cochlear implants: The relationship between visual memory, attention, and executive
functions and developing language skills. Annals of
Otology, Rhinology and Laryngology Supplement, 189,
119–126. http://hdl.handle.net/11343/27605
Sutton-Spence, R., & Woll, B. (1999).The linguistics of
Brit-ish Sign Language: an introduction. Cambridge: Cam-bridge University Press.
Wechsler, D. (1991).Wechsler Intelligence Scale for Children
Wechsler, D. (1999). Wechsler Abbreviated Scale of Intelli-gence. San Antonio, TX: Psychological Corporation.
Wechsler, D., & Naglieri, J. A. (2006). Wechsler Nonverbal
Scale of Ability. San Antonio, TX: Harcourt Assessment. Willcutt, E. G., Doyle, A. E., Nigg, J. T., Faraone, S. V., &
Pennington, B. F. (2005). Validity of the executive
func-tion theory of attenfunc-tion-deficit/hyperactivity disorder:
A meta-analytic review. Biological Psychiatry, 57, 1336–
1346. https://dx.doi.org/10.1016/j.biopsych.2005.02.006
Zelazo, P. D., & Frye, D. (1998). Cognitive complexity and control: II. The development of executive function
in childhood.Current Directions in Psychological Science,
7(4), 121–126. doi:jstor.org/stable/20182520
Zelazo, P. D., M€uller, U., Frye, D., Marcovitch, S., Argitis,
G., Boseovski, J., & Carlson, S. M. (2003). The
develop-ment of executive function in early childhood.
Mono-graphs of the Society for Research in Child Development, 68