1 TITLE
Developing a Mobile Application Customer Experience Model (MACE) - Implications for Retailers.
ABSTRACT
This paper examines the customer experience in relation to retailers’ m-commerce mobile
applications. The research aims to understand the variables capable of influencing the customer experience during use of retailers’ m-commerce mobile applications, resulting in the development of a Mobile Application Customer Experience Model (MACE). Through the use of structural equation modelling on a sample of 1,024 consumers, the findings of the research highlight the importance of utilitarian factors in driving an effective customer experience. In contrast to the e-commerce environment with regard to flow theory, this research highlights that customers are conscious of the length of time spent completing an activity on an m-commerce mobile application, thus should customers perceive to spend longer than necessary using the application, it will result in a negative customer experience. Additionally, the findings illustrate that gender and smartphone screen-size play a moderating role on the customer experience. The findings provide key managerial implications for
retailers on how to provide an excellent customer experience through mobile applications as a service delivery channel.
KEYWORDS
2 INTRODUCTION
Mobile applications (apps) continue to emerge as a powerful and ubiquitous service delivery channel enabling retailers to offer consumers a variety of products and services on the go (Garg and Telang, 2013). The rapid advancement of mobile technology and the subsequent service innovation deriving from it is causing consumer behaviour to evolve in terms of how consumers interact and utilise service delivery channels that are accessible to consumers anytime, anywhere (Shankar et al., 2016). The number of smartphone users is expected to continuously grow with 5.5 billion people expected to be using smartphone devices by 2022
(WARC, 2017), while at the same time, consumers’ willingness to use mobile commerce (m-commerce) is witnessing rapid growth beyond expectations (Chaffey, 2017). Due to the increase in the number of smartphone users and the willingness to adopt mobile commerce, marketers are increasingly using the mobile service delivery channel to meet the demands of such consumers (Shankar et al., 2016; Ono et al., 2012). Retailers, in particular, are allocating large percentages of their marketing budget to enhance the customer experience through mobile applications (WARC, 2015).
Traditional retailers (brick and mortar) have encountered numerous strategic challenges and opportunities over recent years (Blazquez, 2014). First was the introduction of e-commerce websites that challenged the existence of many retailers with numerous well-known brands exiting the market (Reynolds, 2000). However, over the years, retailers who have continued to compete have adapted their strategy to include an online presence through an e-commerce website (Martin et al, 2015). The Internet continues to be an essential factor in the evolution of the retail landscape. Numerous retailers have taken significant advantage of what the channel has to offer (Klaus and Nguyen, 2013) including the expanded reach, reduced costs, lower geographical barriers, as well as 24/7 availability (Christodoulides et al., 2012).
Following the adoption of the Internet, numerous retailers have further adapted to an Omni-channel retail strategy, Omni being the Latin for ‘every’, where retailers operate multiple service delivery channels including, in-store, website and on mobile app (Piotrowicz and Cuthbertson, 2014). The term ‘mobile app’ has become a popular abbreviation for mobile
applications amongst industry professionals, academics and consumers over recent years. Mobile applications are associated with software that is downloaded to a smartphone’s
3
apps are defined as a software that is downloadable to a mobile device, which prominently displays a brand identity, often via the name of the app and the appearance of a brand logo or icon, throughout the customer experience while using the app (Bellman et al., 2011). The added benefit for retailers, unlike websites, is that mobile apps can utilise the hardware and features of the smartphone to deliver a tailored experience to users, i.e. scanning of bar codes through the use of the built in camera function or offering location specific content through the use of GPS. Thus, mobile apps are also seen as end-user software applications that are designed for a mobile phone operating system and extend the phone’s capabilities by
enabling users and app providers to perform specific tasks (Purcell et al, 2010).
However, due to the nature of mobile devices, consumers are now presented with a different interface and size of device to interact with. Thus, during an experience with mobile devices, interfaces have shifted from computer mice to touchscreens (Brasel and Gips, 2014).
Therefore, the interface change may subsequently alter the response of consumers using and viewing content with a different set of variables influencing the customer experience. Retailers are adopting ‘m-commerce’ at an exhilarant rate and part of an Omni-channel strategy (Brynjolfsson et al., 2013). Mobile applications can be seen as an important part of m-commerce, yet we have little understanding on what influences the customer experience during use of m-commerce mobile applications. Previous research has focused on the scope of mobile marketing (Shankar and Balasubramanian, 2009), mobile service delivery
(Kleijnen et al., 2007), the mobile interface (Venkatesh et al., 2012), mobile browsing (Adipat et al., 2011), how mobile applies to retailing (Shankar et al., 2010), the demand for mobile apps (Garg and Telang, 2013), mobile advertising (Andrews et al., 2015) and mobile shopping (Wang et al., 2015).
This paper aims to add to our theoretical understanding of mobile applications through exploring the variables capable of influencing the customer experience during use of
retailers’ m-commerce mobile apps. Mobile apps offer consumers an alternative channel for browsing and shopping and are unique in terms of the functions they can offer consumers and retailers (Wang et al, 2015), hence, understanding the variables that influence the customer’s
experience is of significant value. In particular, traditional retailers offer an interesting area of study due to their continued adaptation to new, digital, service delivery channels. As a result, two research objectives stem from our aim (1) to develop an understanding of the key
4
develop a Mobile Application Customer Experience Model (MACE), providing a theoretical understanding of the customer experience with m-commerce mobile applications.
LITERATURE REVIEW Customer Experience
The theoretical foundation of the customer experience is based on the concept that a
customer’s experience is the combination of all cues and touch-points a customer has with an organisation, which in turn creates an overall experience (McLean and Wilson, 2016;
Homburg et al., 2015; Payne et al., 2008). Meyer and Schwager (2007, p.18) define the customer experience as, ‘the internal and subjective response that customers have to any direct or indirect contact with a company’. However, more recently, Homburg et al (2015, p.8) follow on from Verhoef et al (2009) and suggest that ‘the customer experience is the evolvement of a person’s sensorial, affective, cognitive, relational and behavioural responses
to a brand by living through a journey of touchpoints along pre-purchase, purchase and post-purchase and continually judging this journey against response thresholds of co-occurring experiences’. As a result, the customer experience can be seen as a holistic process and
combination of both cognitive and affective, components leading to take away impressions (McLean and Osei-Frimpong, 2017; Verhoef et al, 2009; Edvardsson, 2005; Schembri, 2006). A key distinction between the customer experience and service quality is the
acknowledgement of customer emotions within the experience (Edvardsson, 2005; Schembri, 2006). Customer emotions are often vividly recalled, yet difficult to describe, thus numerous researchers have applied psychology theories adopting the PAD model (Mehrabian and Russell, 1974), the PANAS theory (Watson et al, 1988) as well as the differential emotion theory (Izard, 1977) to assist in understanding and measuring the customer experience. Some research studies have focused on the measurement of the cognitive dimension of the customer experience (Lemke et al, 2010) through only assessing satisfaction with the experience, however it is important that researchers include customer emotions as part of the
measurement of the customer experience (McLean and Wilson, 2016; Juttner et al, 2013; Verhoef, 2009; Edvardsson, 2005).
5
customers always have an experience; this experience may be good, bad or indifferent and occurs whenever a customer buys a product or encounters service from a retailer (Berry et al., 2002). The focus on the online customer experience has emerged due to the transition from static websites to dynamic and interactive e-commerce sites (Klaus, 2013). Similarly, mobile applications provide a further dynamic channel to browse and purchase products, yet little is known on what influences the customers experience with such software (Pousttchi et al., 2015). A number of variables are capable of influencing the cognitive and affective components of a customer’s experience in the offline and online environment. In order to
provide the study with further theoretical understanding, the following section will provide an overview on the variables outlined as influencing the customer experience during use of the
online web environment.
Variables influencing the Customer Experience
A comprehensive review of the literature spanning over the last fifteen years finds numerous key variables that are capable of influencing the customer experience in the online web environment namely, ease of use, customisation/personalisation, convenience/usefulness, web aesthetics, enjoyment, telepresence, time distortion and flow (see: Zeithaml et al., 2000, Yoo and Douthu, 2001; Loiacono et al., 2002;; Yang et al., 2003; Gounaris et al., 2005; Lee and Lin, 2005; Parasuraman et al., 2005; Kim et al., 2006; Loiacono et al., 2007; Song and Zinkhin 2008; Hoffman and Novak, 2009; Lee and Jeong, 2010; Lee and Cranage 2011; Rose et al., 2012; Mcgrath and McCormick, 2012; Klaus, 2013, Faiola et al., 2013; Martin et al., 2015; McLean and Wilson 2016). More recently, Bilgihan et al. (2015), Hsiao et al. (2016), Wang et al. (2015), Kang et al. (2015) and Kim et al. (2014) suggest that both utilitarian and hedonic variables influence consumer behaviour during use of mobile applications. A review of such variables from both Information Science and Marketing literature may help us gain an understanding into the potential variables capable of influencing the customer experience with retailers’ m-commerce mobile applications.
Utilitarian Factors of Technology
Deriving from the Technology Acceptance Model (TAM) (Davis, 1989), Rose et al (2012) outline ease of use as an important variable capable of influencing customer emotions within the online retail environment. Based on the Theory of Reasoned Action, the TAM continues to be an important foundation in understanding customers’ use of technology (Yang, 2013).
6
the basic functions, while avoiding error during their activity (Davis, 1989). Further to this, the ease of use of a technological system is based on how the system allows the customer to perform tasks, increase productivity, performance and efficiency (Chau and Lai, 2003). The TAM outlines the perceived usefulness of the technology influencing consumer use of a technological system (Davis, 1989). The usefulness of the technology relates to the
technology’s convenience and compatibility for the task (DeLone and McLean, 2003), which
in turn, Bhattacherjee et al. (2001) assert that the usefulness of the technology is influential on satisfaction and continued use of the technology.
Moreover, in further enhancing the ease of use of a technological function, Bilgihan et al. (2016) suggest that customisation is a utilitarian variable capable of influencing the customer experience. The development of technology in service delivery has seen an increase in the use of technology to provide customised services (Truel and Connelly, 2013). Customisation refers to the personalisation or individualising of services and content to a customer’s own preferences and interests (Lee and Cranage, 2013), as well as a retailer’s ability to personalise
the delivery of the right content, to the right person at the right time (Tam and Ho, 2005). Thus, customisation can influence feelings of control and the ability to be an active part in creating the customer’s unique experience (Cheng et al, 2010). Retailers’ offering of a
customised experience can aid in reducing a level of uncertainty that exists during Internet shopping and can further improve efficacy and make the technology easy for the customer to use (Magrath and McCormick, 2012). Therefore, offering customers the ability to filter content, favourite content and be provided content relevant to them, can result in positive customer emotions (Rose et al., 2012). However, research highlights that customisation is not as critical on the customer experience as ease of use within the online web environment (Martin et al., 2015). In spite of this, the distinctive nature of smartphone apps that allow customers to store data in a unique manner (Hsiao et al., 2016) and the ability of retailers to utilise such data for location awareness, context sensing and product personalisation
(Alnawas and Aburub, 2016), may increase the importance of customisation as a utilitarian
variable capable of influencing the customer experience.
In line with the ability to use mobile apps to provide customers with a customised experience, previous research has highlighted that customers can access mobile applications anytime, anywhere (Shankar et al., 2016; Andrews et al., 2015) leading to a convenient way to shop. Customers often use mobile applications ‘on the go’ (Wang et al., 2015), thus convenience,
7
comparison to what research has shown within e-commerce (Rose et al., 2012). Previous research acknowledges overlapping features of convenience, compatibility, ease of use, effort expectancy, personalisation and customisation drawing upon the technology acceptance model and the information system success model (Kim and Baek, 2017; Yun et al., 2013; Alnawas and Aburb, 2016; Ozturk et al., 2016). Kim and Baek (2017) further suggest that customisation within a mobile application underpins a more convenient way to shop reducing a customer’s effort, which is described as conceptually related to perceived ease of use.
Further to this, Magrath and McCormick (2012) conceptualise that ease of use, customisation
and convenience are all interlinked, however, such a hypothesis has not been empirically tested. Thus, we hypothesise:
H1: A relationship exists between the variables of ease of use, convenience and customisation
to combine together as a higher order utilitarian factor.
Flow Theory and Timeliness
Novak et al. (2000) introduced the concept of flow within the online environment in relation to the customer experience. The key premise of the concept of flow is based on a cognitive state where an individual is completely absorbed in an activity to the extent that they are fully immersed and engaged in the task while experiencing time distortion and a loss of self-consciousness (Csikszentmihalyi, 1997). Flow within the online environment has been defined as ‘a cognitive state experienced during online navigation’ (Novak et al., 2000, p.24).
Therefore, flow can be considered as a motivational variable influencing the customer’s experience (Hoffman and Novak, 2009). However, recent literature has revealed much debate around the concept of flow (Trevinal and Stenger, 2014; Mollen and Wilson, 2011) with regard to antecedents and consequences of flow. As well as enjoyment, telepresence and time distortion have been highlighted as both antecedents and consequences of flow (Hoffman and Novak, 2009).
Lee and Crange (2011) outline that telepresence is the feeling of being present within a virtual environment that is more dominant than the real life environment that the individual
8
consumers become completely immersed and engaged in the shopping activity they are completing and experience a distorted sense of time and positive emotions. Within this virtual environment, consumers loose the connection with real time, while it slowly fades away into the background of consciousness (Martin et al., 2015).
Similar to telepresence, time distortion is highlighted as a key part of flow (Hoffman and Novak, 2009). Time distortion, refers to the point in which consumers are so involved in the task that time elapses quickly without knowledge (Fan et al., 2013). Hoffman and Novak (2009) highlight that the time distortion experienced by consumers, where time passes
un-consciously to the consumer, results in positive customer emotions and subsequently a positive customer experience.
Despite this, the usefulness of flow and the variables of time distortion and telepresence have been called into question (Mclean and Wilson, 2016; Klaus, 2013). McLean and Wilson (2016) and Klaus (2013) outline that the customer experience is context specific. Thus, due to the nature of the smartphone device and the use of mobile apps often used ‘on the go’ in a utilitarian manner (Wang et al, 2015), consumers may in-fact be conscious of time spent on an activity and thus, the ability to complete shopping activities in a timely manner may lead to an effective customer experience within this context. Resource allocation theory (Kahneman, 1973; Zakay and Hornik 1991) highlights that individuals are occupied with the passage of time and often make time estimations during their activity. Therefore, while customers use apps on the go and often for convenience (Wang et al., 2015), the time spent using the app could be conscious to the individual. Therefore, in contrast to the traditional e-commerce environment (Rose et al., 2012) customers may be time conscious during use of m-commerce mobile applications. Thus we hypothesise:
H2: The utilitarian factor made up of ease of use, customisation and convenience will
influence customers’ perception of being able to complete tasks in a timely manner.
H3: should customers be unable to complete tasks in a timely manner then they will have a
negative customer experience with negative emotions.
Enjoyment
9
is referred to as the activity of using a specific system that is enjoyable in its own right, aside from any performance consequences resulting from system use (Venkatesh, 2000). Previous research within the online web environment highlights that those customers who do not experience enjoyment during their online shopping activity will seek to complete the activity at an alternative provider (Faiola et al., 2013; Lee et al., 2011). More recently, Hsiao et al. (2016) suggest that customers will not be satisfied while using mobile applications without the hedonic element of enjoyment. Thus, during the online shopping encounter, previous research suggests that customers will not achieve the optimal experience should they not
experience enjoyment in their activity (Hoffman and Novak, 2009). Mcgrath and McCormick (2012) suggest that ease of use, customisation and convenience may lead to high levels of
customer enjoyment. Thus we hypothesise:
H4: the utilitarian factors drive a customer’s level of enjoyment during use of a retailer’s
mobile application.
H5: The level of enjoyment a customer has during use of a retailer’s mobile application will
influence a customer’s level of satisfaction with the experience and a customer’s emotions.
Moreover, while we hypothesise that enjoyment and timeliness may mediate the relationship between the utilitarian factor made up of customisation, convenience, ease of use, and the customer experience, in line with work on the Technology Acceptance Model (Davis, 1989) and the Expectancy Confirmation Theory with Information Technology (ECT-IT)
(Bhattacherjee, 2001), we suggest a relationship between the utilitarian factor and the customer experience exists. Thus we hypothesise:
H6: There is a direct relationship between the utilitarian factor and the customer experience.
Lastly, in line with previous studies by Shobeiri et al. (2015) and Verhoef et al. (2009), research within the e-commerce environment highlights that an effective customer experience can result in increased re-visit intention, thus in a mobile app context we hypothesise:
H7: The overall customer experience will have an effect on how frequent customers use
retailers’ mobile applications.
METHODOLOGY
10
we employed a market research agency to recruit participants. After data cleansing, a total of 1,024 usable questionnaires were obtained from the original 1,410, which is an adequate sample size for structural equation modelling (SEM) with analysis of moment structures (AMOS) (Byrne, 2013). In order, to ensure valid responses we used the trap questions technique (e.g. The trap question was: Answer the following question ‘agree’), reversed question wording and time filters to reduce ‘speedy’ respondents (Smith, 2013).
Four traditional retailers’ mobile applications with presence in the UK were selected in this study, namely H&M, Next, John Lewis and Marks & Spencer. From the 1,024 responses,
data was equally distributed across all four mobile apps; further details can be found in Appendix 1. Thus, due to the use of four different retailers’ mobile apps, the research is able to produce generalisable results. In order to conduct analysis on the data set, the data were pooled from all four retail apps following Configuarl invariance tests.
Moreover, to gain an understanding on what influences the customer experience during the use of retailers’ mobile applications, respondents must have used the smartphone app for a minimum of 6 months, thus the respondents are in an adequate position to rate their experience with the app. Additionally, respondents are relatively frequent users of their corresponding app (further details available in Appendix 1). Therefore, due to the extensive period of time respondents have used the app, the research is able to offer practical
implications for retailers on how to provide an excellent customer experience.
In order to ensure an appropriate sample for the study, common method bias tests were conducted, which is explained in the preliminary analysis. The results of such tests highlight no bias within the sample. In addition, demographic details of respondents were collected; the sample achieved a relatively even split between males (47%) and females (53%). In terms of age group, the study achieved a broad representation, 18-24 (10%), 25-34 (34%), 35-44 (27%), 45-54 (18%) and 55-65 (11%). Education level of the sample found 13% had graduated from high-school, 47% graduated from further education (College) and 40% had graduated from higher education (University). In terms of occupation status, the majority of the sample is working full time, 73%, with 17% working part time, 7% unemployed with 3%
11
Structural equation modelling (SEM) was used using AMOS graphics 23. The benefit of structural equation modelling is that the hypothesised model can be tested simultaneously in an analysis of the whole model of variables. Thus, the statistical technique allows the research to produce a Mobile Application Customer Experience Model (MACE).
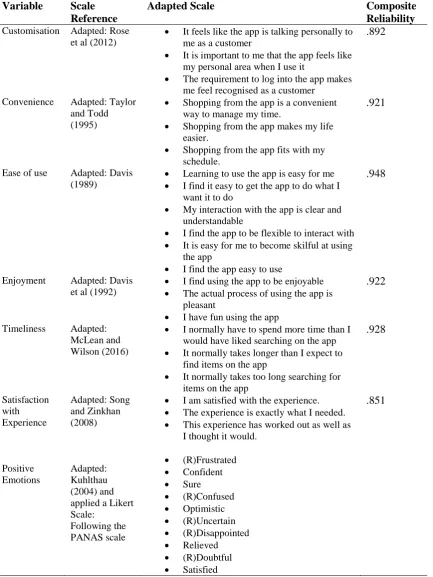
The questionnaire scales were adapted from established scales within the literature. 35 items on a 7 point Likert scale ranging from (1) Strongly Disagree to (7) Strongly Agree were used to measure customisation, convenience, timeliness, ease of use, enjoyment, customer
emotions and satisfaction with the experience. Table 1.0 outlines the scales and the items
used in this research.
****Insert Table 1.0 Measurement Scales Here****
RESULTS Preliminary analysis
A number of analyses were conducted before estimating the model using structural equation modelling. First of all, composite reliability tests were calculated as seen in table 1.0. Each of the composite variables were above the critical value of .7 (Fornell and Larcker, 1981) and therefore can be considered reliable.
Secondly, Harman’s (1967) one-factor test was conducted to assess the method variance in the data. Due to the fact that an online questionnaire was conducted and this data were self-reported for each variable, common method bias could occur (Podsakoff et al, 2003).
Harman’s (1967) one factor test suggests that if common method bias exists, one single factor
will explain more than 50% of the variance within a principal component factor analysis performing no rotation. Through constraining the factor analysis to one factor, the single factor fell below this benchmark. Therefore, the test found that no single factor explained more that 50% of the variance, as a result common method bias is unlikely to occur in this
study.
12
significant difference with regard to occupation status, Wilks’ Lambda .945 f (42, 4745) p = .06 or frequency of use between each app Wilks’ Lambda .973 f (24, 2040) p = .352.
However, a significant difference was found with regard to gender, Wilks’ Lambda .979 f (6,
1017) p = .002. In addition, a significant difference was found between large screen size 4.7 inch and above (e.g. iPhone 7 – iPhone 7+) and small screen size 4.6 inch and below (e.g. iPhone 5 – Samsung Galaxy A5), Wilks’ Lambda .979 f (6, 1017) p = .001. Thus, both gender and screen size will be further discussed in the structural model. Additionally, as we used a mix between department store retailers (Debenhams, Next, Marks and Spencer) and an
apparel retailer (H&M), in order to assess potential differences in customer behaviour between each type of app(Department Store or Apparel), we conducted an ANOVA in
relation to customer behaviour in the form of purchase frequency through each app. While the results detail a significant difference between the four apps in relation to purchase frequency [f(3, 1023) = 3.99, p = .008], further post-hoc comparisons using the Tukey HSD test indicated that there was no significant difference in customer behaviour between the department store retailers and the apparel retailer in relation to purchase frequency.
Structural Equation Modelling
Structural Equation Modelling (SEM) with an analysis of moment structures is one of the most common and robust statistical techniques that can be used in order to undertake analysis on structural theory with a confirmatory approach (Tabachnick and Fidell, 2007). This study used AMOS graphics 23 in order to conduct the analysis. SEM involves two important parts (1) the casual process that is under examination is represented by a set of structural equations and (2) the relationships can be modelled pictorially to illustrate a clear representation of the theory being studied.
The first step however in structural equation modelling is to test the CFA measurement model. The CFA measurement model highlights the causal relationships between each of the
observed variables and their underlying latent variables. Thus, the CFA measurement model was specified and estimated, the fit statistics of the model were considered ‘good fit’ (see Lie and Wu (2007) for fit statistics critical values), CFI = .978, NFI = .970, GFI = .945, RMSEA = .052 and SRMR = .035. In line with the fit statistics, all loadings were adequate and
13
In addition, convergent and discriminant validity were supported due to the following, (1) all loadings were significant (p < .001), (2) the composite reliability for each construct exceeded the recommended level of .7, and (3) the average variance extracted (AVE) for each construct fulfilled the recommended benchmark of .50, and also meets the requirement of above the maximum shared variance (MSV) (Hair et al., 2010). Furthermore, the discriminant validity is assessed, by calculating the square root of the AVE for each construct, where it should exceed the inter-correlation for each construct (Hulland, 1999; Hair et al., 2010), as seen table 2.0
****Insert Table 2.0 Average Variance Extracted Here****
In addition to the CFA model, the pooled data was tested for Configural invariance following Byrne’s (2016) procedure. The purpose of Configural invariance is to assess the assumption
that the fixed factor loadings are the same across groups and should be established in order for pooled data analysis to be meaningful (Vandenberg and Lance, 2000; Horn and McArdle, 1992). In this regard, a CFA was conducted for each app where the goodness of fit values were assessed to evaluate the fit of the model for each app. The results revealed that each of the CFA measurement models achieved goodness of fit (John Lewis: x2 = 1.968; RMSEA =. 061; CFI = .969; M&S: x2 = 2.145; RMSEA = .066; CFI = .970; Next: x2 = 1.817; RMSEA = .056; CFI = .973; H&M = x2 = 2.085; RMSEA = .069; CFI = .954), which also signifies that the factor structure of each of the groups are similar (Byrne, 2016). Thus, we can conclude the data fits well across each group. Furthermore, the measurement and structural invariance assessment was performed to evaluate model equivalence across groups at the measurement and structural level. This test was conducted by assigning constraints to the groups and then calculating the difference in the CFI value from the Configural model and the constrained model, the results illustrated a CFI difference of < .01, affirming equivalence across each mobile application (Cheung and Rensvold, 2002). In addition, the comparison of the
Configural and constrained model showed an insignificant p value >.05 further affirming no differences between each mobile application and the appropriateness of the pooled data.
Therefore, due to the CFA measurement model providing goodness of fit, the study can proceed to the second step by specifying and estimating the hypothesised structural model. The structural model in comparison to the measurement model examines the causal
14
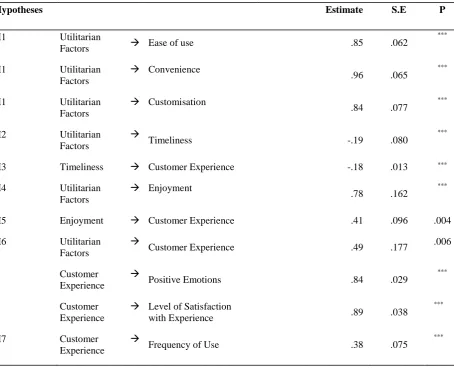
among endogenous variables. The fit statistics of the structural model showed goodness of fit (x2(159)= 589.64 p < .05 x2/df = 3.7, CFI = .977, GFI = .943, NFI = .969, SRMR = .047, RMSEA = .051) and supports each of the hypothesised relationships. The standardised path coefficient regression weights, standard error and statistical significance are outlined in table 3.0 and figure 1.0.
***Insert Table 3.0 Path Regression Coefficients Here****
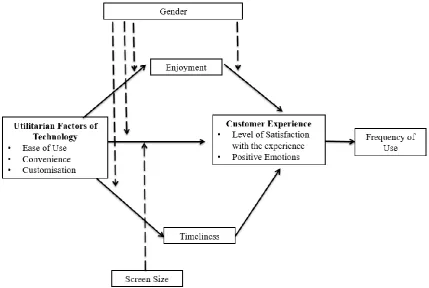
****Insert Figure 1.0 Structural Model Here****
Following on from the MANOVA tests conducted in the preliminary analysis, after
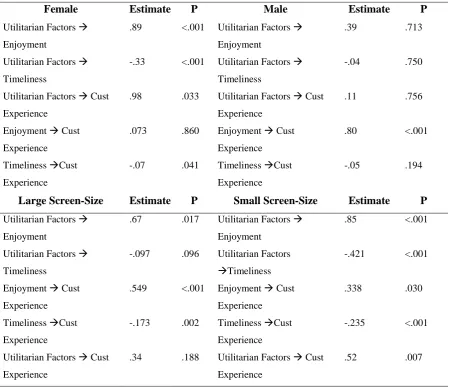
estimating the structural model as seen in figure 1.0, multi-group moderation was calculated in AMOS graphics to explore the moderating role of gender and screen size. The results outlined that with regard to gender, females’ customer experience is significantly influenced by utilitarian factors whereas males’ customer experience is significantly influenced by the
hedonic enjoyment factor. With regard to size, those customers with a smaller screen-size highlight more importance towards utilitarian factors of ease of use, convenience and customisation directly influencing the customer experience (p = .007), whereas those with a large screen-size do not outline utilitarian factors as having a significant direct effect on the customer experience (p =.188). However, further multi-group analysis within AMOS graphics shows that when using a smaller screen mobile device, utilitarian factors remain insignificant in directly influencing males’ experience p = .120. However, the utilitarian factors do have a significant effect on males’ level of enjoyment when using a small screen-size mobile device p = .000, thus the hedonic element of enjoyment continues to play a significant role for males and acts as a mediator between the utilitarian factors and the experience when using a small screen-sized device. In contrast, utilitarian factors do not influence males using a large screen-sized device. No significant differences were found between females and screen size, the utilitarian factors continued to drive the experience,
regardless of screen-size. Table 4.0 outlines the regression weights and statistical significance between each path with regard to gender and screen-size.
15
In order to further assess the differences between males and females use of retailers’
m-commerce mobile applications, we conducted further multi-group analysis in AMOS graphics with males and females on their purpose of use from the categories of: (1) shopping to make a purchase, (2) searching/browsing and (3) keeping up to date with news. The results found that there was no significant difference between males and females with regard to the
variables influencing the experience in the purpose of using retailers’ mobile applications. In addition, multi-group analysis was carried out with both large and small screen-size
smartphone users on the purpose of using a retailer’s mobile application with the same set of
categories and found a significant difference on the customer experience.The results
illustrated that those customers with a large screen-size smartphone find enjoyment important
across all three categories (Enjoyment Experience with large screen smartphone: (1) β = .47, p < .001 (2) β = .41, p < .001 (3) β = .39, p < .001; Enjoyment Experience with small screen smartphone (1) β = .21, p= .186 (2) β = .17, p= .161 (3) β = .20, p= .097), however the utilitarian factor and timeliness is more important than enjoyment for small screen-size smartphone users across all three categories (Timeliness Experience with small screen smartphone: (1) β = -.31, p < .001 (2) β = -.42, p < .001 (3) β = -.29, p= .016; Timeliness Experience with large screen smartphone (1) β = -.25, p= .055 (2) β = -.27, p= .048 (3) β =-.18, p= .084; Utilitarian Factor Experience with small screen smartphone: (1) β = .67, p < .001 (2) β = .69, p < .001 (3) β = .47, p= .031; Utilitarian Factor Experience with large screen smartphone (1) β = .43, p= .009 (2) β = .49, p < .001 (3) β =.31, p= .048)
Overall, the results provide interesting findings and support each of the research hypotheses. In support of H1, the findings outline a relationship between the variables of ease of use, convenience and customisation creating a utilitarian variable. Previous research (Magrath and McCormick; Kim and Baek, 2017; Yun et al, 2013; Alnawas and Aburb, 2016; Ozturk et al, 2016) drawing upon the Technology Acceptance Model (TAM) (Davis, 1989) and the information system success model (DeLone and McLean, 2003) outlined the overlapping features of ease of use, convenience and customisation, this research affirms previous
conceptualisations within the mobile context.
16
spending time on the app, which in turn influences a positive customer experience. Therefore, we affirm based on previous conceptualisations (Wang et al., 2015) that the ability to
complete shopping tasks in a timely manner on a mobile application results in a positive customer experience.
In support of H4 and H5 the results indicate that the utilitarian factor of ease of use, convenience and customisation influences a customer’s level of enjoyment during use of a retailer’s mobile application. Such enjoyment subsequently influences a customer’s
satisfaction with their experience. The importance of enjoyment is illustrated in later versions of the technology acceptance model building upon the utilitarian factors of technology
(Vankatesh and Bala, 2008; Vankatesh et al., 2012), as well as being outlined as leading to satisfaction with the experience in the e-commerce environment (Hsiao et al., 2016). This research further supports such a relationship with retailers’ m-commerce mobile applications.
Furthermore, in support of H6, we find that there is a direct relationship between the utilitarian factors and the customer experience. Our findings are in line with the theoretical foundations of the Expectancy Confirmation Model with Information Technology (ECM-IT) (Bhattacherjee, 2001) in which utilitarian factors influence a customer’s satisfaction with a technological system. Lastly, in support of H7 and in line with previous work within the e-commerce environment on re-visit intention (Shobeiri et al., 2015; Verhoef et al., 2009) the results of this research outline that a positive customer experience increases how frequent customers use a retailer’s mobile application. However, despite the support of the research
hypotheses, further analysis finds that gender and smartphone screen-size play a moderating role on the variables that influence the experience with mobile applications. The following section will provide a discussion on these results.
DISCUSSION
Due to advances in digital technology, retailers continually face new challenges, and thus in order to compete and meet the growing expectations of consumers; retailers need to adapt their strategy (Donthu and Eroglu, 2014). Consumers have ever evolving expectations during their service encounters with retailers, therefore due to the emergence of new channels of service delivery, namely mobile applications, it is imperative that we have an understanding
17
Over recent years, more and more consumers are shopping through mobile applications, yet we have little understanding on what influences the customer experience during use, this research takes the initial steps and provides a Mobile Application Customer Experience Model (MACE) as shown in figure 2.
Previous research (Wang et al., 2015; Shankar et al., 2016; Andrews et al., 2015) highlighted that mobile applications are often used ‘on the go’ and therefore provide a unique experience
in comparison to e-commerce websites and in-store shopping and thus can be influenced by their own set of unique variables. Wang et al. (2015) highlighted the utilitarian nature of
m-commerce applications, yet purchase within such a channel remains lower than both in store and online (e-commerce websites). Therefore, establishing the variables that can influence a customer’s experience during use of such a channel is important for all retailers to
understand.
The findings of the research highlighted the importance of the utilitarian factors of technology involving ease of use, convenience and the ability to customise the experience. Ease of use refers to the ability to easily move through the app and complete tasks in a trouble-free manner. Convenience refers to the ability to efficiently complete tasks, in a way that suits the customer’s situation. Customisation refers to the ability to filter content, favourite content and have an experience that is unique to the customer. These utilitarian factors of technology drive the customer’s perception of their experience. Importantly, it is these utilitarian factors (ease of use, convenience and customisation) that drive a customer’s level of enjoyment during use of a retailer’s mobile application. Customers who are unable to complete tasks with ease, customise their experience and use the app in a convenient manner will not experience high levels of enjoyment in the shopping activity. The level of enjoyment that customers’ experience during use of the app plays a mediating role between the utilitarian factors and the customer’s overall experience. Thus, should customers not have positive perceptions of the utilitarian factors then they are unlikely to experience enjoyment in the activity which will result in customers becoming dissatisfied and experience negative emotions of frustration, uncertainty, anxiety and disappointment.
18
utilitarian factors, which can be understood based on Wang et al. (2015), Shankar et al. (2016) and Andrews et al. (2015) research outlining that mobile applications are often used ‘on the go’, anytime and anywhere, with mobile shopping considered a convenient way to
shop. Previous research (Hoffman and Novak, 2009; Martin et al., 2015) within the e-commerce environment highlight enjoyment and flow as key drivers of an effective customer experience during a hedonic shopping experience. Thus, in contrast we find that m-commerce mobile applications may be used in a more utilitarian manner, with the customer’s experience driven by utilitarian factors.
Several authors including Hoffman and Novak (2009) outlined flow and cognitive absorption theory (Agarwal and Karahanna, 2000) as leading to the optimal customer experience. However, Klaus (2013) and McLean and Wilson (2016) outlined that the customer experience is context specific, and thus flow theory may not be relevant in all searching and buying contexts. The findings of this research illustrate that in contrast to previous research within the e-commerce environment involving flow theory where customers become unconscious of time passing, customers are conscious of the length of time spent using m-commerce mobile applications. Consequently, being able to complete tasks in a timely manner becomes an important part of a customer’s experience. The results indicate, should
customers be unable to complete their shopping activity in a timely manner it will result in them becoming dissatisfied, experiencing further emotions of frustration, uncertainty and disappointment. However, the utilitarian factors of ease of use, convenience and customisation can reduce the length of time customers perceive to spend on an m-commerce mobile application. Thus, again the utilitarian factors prove to be an important driver of a positive customer experience. These results are in line with resource allocation theory, which asserts that customers are aware of time passing while completing a task and make time estimations throughout their activity. Therefore, the absence of stimulus such as customisation tools allowing customers to filter content, which can reduce the frequency of customers conducting time estimations, may result in customers perceiving to spend longer
than necessary on the app and in turn result in a negative customer experience.
19
The results indicate that the level of enjoyment females gain from using the app does not have a significant effect on their experience, rather utilitarian factors are of significant importance. In contrast however, the results outline that males use retailers’ mobile applications for enjoyment. The level of enjoyment males’ gain from their service encounter has an effect on their experience, yet utilitarian factors do not have an effect on the level of enjoyment, the time spent on the app or the overall experience. Thus, we can conclude from this that females use retailers’ m-commerce mobile applications in a utilitarian manner in order to complete particular activities, whereas males use such channels for hedonic value
and to experience a level of enjoyment.
In addition, figure 2 outlines the moderating effect of a smartphone’s screen-size. As previously mentioned we categorised screen-size as a large screen-size = 4.7 inch and above (e.g. iPhone 7 – iPhone 7+) and small screen-size = 4.6 inch and below (e.g. iPhone 5). The results indicate that those with a small screen-size put emphasis on utilitarian factors of ease of use, convenience and customisation as significantly influencing the customer experience directly, whereas the results find that the experience for those with a larger screen size is not as significantly influenced by utilitarian factors. Interestingly, the results further illustrate that those with a small screen-size use retailers’ mobile applications more for browsing than those with large screen-sizes. In contrast, those with large screen-size devices use the retailer’s m-commerce mobile application for shopping (making purchases) more than customers with smaller screen-sizes. Additionally, the results pertain that enjoyment becomes the most important variable influencing the experience for large screen-size users when the app is used for (1) shopping, (2) browsing and (3) keeping up to date with news. Yet, on the other hand, for small screen-size users the utilitarian factor and timeliness is the most important variable influencing the experience across all three aforementioned categories. The results also indicate that despite males’ experience not being influenced by utilitarian factors, should males’ access retailers’ mobile applications with a small screen-size device, utilitarian factors have an effect on males’ level of enjoyment. Thus, as shown in figure 2, gender and screen
size play an important moderating role between the variables influencing the customer experience.
20
Previous research highlights numerous outcomes from an effective customer experience, including re-visit intention, loyalty, and trust. The results further indicate, should customers have an effective experience they will use the app more frequently. Thus, providing an effective customer experience will result in customers actively using the app, rather than retaining the app on their smartphone device and not using it or simply deleting the app.
Prior research indicated that consumer behaviour has changed due to the emergence of new mobile channels for service delivery (Alnawas and Aburub, 2016). However, a lack of research within the area had left many questions unanswered. The findings indicate the
unique set of variables capable of influencing the customer experience with retailers’ m-commerce applications. As mobile applications are often used ‘on the go’, utilitarian factors appear to drive the variables influencing the customer experience and directly on the customer’s level of satisfaction with the experience and the customer’s emotions, while
gender and screen size play a moderating role. Subsequently, managerial implications arise from this research; the following section discusses these implications in detail.
Managerial Implications
This study offers retailers numerous managerial implications. First of all, the research highlights the unique nature of the customer experience with mobile applications. The utilitarian factors of ease of use, customisation and convenience appear to drive the level of satisfaction with the experience and positive customer emotions. Accordingly, retailers should ensure that customers are able to complete tasks trouble-free, being able to easily move through the app. In addition, retailers ought to provide functionality that allows customers to customise their experience, unique to their activity, i.e. being able to filter content, favourite content, apply parameters to search and be presented with customised information, while utilising customer’s data, such as age, gender and location. In line with this, it is important that retailers provide an app that is convenient and allows customers to carry out activities within their own schedule, with ease and in an efficient manner. Thus,
retailers should seek regular feedback on the customer experience through continued usability testing on these variables as customer expectations may continue to evolve as a result of their experiences with other mobile applications.
21
Increasing the level of enjoyment customers’ experience will increase a customer’s level of satisfaction with the experience and overall positive emotions.
Moreover, the results of this study outline the time-conscious nature of consumers during use of a retailer’s m-commerce mobile application. Previous research within the e-commerce environment, outlined flow, the loss of self-consciousness, while experiencing time distortion as leading to the optimal experience. However, this research further highlights the context specific nature of the customer experience and outlines to retailers that customers are conscious of the length of time they are spending during use of the app. Previous research highlighted that customers often use mobile applications ‘on the go’, therefore, spending
longer than perceived necessary will result in a negative customer experience with negative emotions of frustration, disappointment and uncertainty. Thus, retailers who focus on the utilitarian factors of ease of use, convenience and customisation will increase the customer’s perception of spending an appropriate length of time using the app to complete tasks. Retailers should incorporate the assessment of the length of time it takes customers to complete tasks on their mobile applications within usability testing to ensure customers can carry out their activities in a timely manner.
In addition, retailers should note the important moderating role of gender. Females are influenced by the utilitarian factors outlined. The utilitarian factors drive females’ level of enjoyment with the app, the appropriateness of the length of time spent using the app and the overall customer experience. In contrast, for males, utilitarian factors are not significant in influencing the customer experience, the appropriateness of the length of time spent using the app and the level of enjoyment with the app. Rather, males are influenced by the level of enjoyment experienced during the service encounter. Thus, retailers offering services to both males and females should take account of these factors when developing and providing services through such a channel. Therefore, retailers that deliver services specifically to particular genders (e.g. Topshop - Females; Topman - Males) should note the factors influencing the customer experience for both males and females. In turn, retailers’ can take into account the utilitarian nature of females’ use with m-commerce mobile applications and
22
Furthermore, it is interesting for retailers to consider the screen size of a customer’s mobile device. Analytics packages outline the device that customers use to access a retailer’s mobile application, thus identifying the most popular device can provide insight into the variables that influence the customer’s experience during use. Thus, the experience of those customers
with a small screen-size smartphone device is influenced by utilitarian factors, whereas the experience of those with a large screen-size device is more significantly influenced by the level of enjoyment a customer experiences. As a result, retailers ought to ensure that their mobile application renders appropriately on different types of mobile devices to provide an
effective customer experience. In addition, the research illustrates to retailers that customers with smaller screen-size smartphones use the mobile app more for browsing compared to
those with larger screens, while larger screen-size customers use the app to shop more than smaller screen-size customers. Such insight provides mangers with an explanation for varying consumer behaviour with m-commerce applications and provides retailers with insightful information for developing consumer personas.
Lastly, managers are often unaware of the reasons as to why customers do not use their mobile app despite the app being retained on a customer’s smartphone device. Retailers should note that paying attention to the variables that influence a positive customer experience will result in customers using the m-commerce app more frequently.
LIMITATIONS AND FUTURE DIRECTIONS
The findings and implications of this study are somewhat constrained by certain limitations, some of which provide opportunities for future research. This study investigated the variables influencing the customer experience during use of apparel and department store retailers’ mobile applications, while it would seem reasonable that the findings would extend to different types of m-commerce applications, it would be useful to test the model with other types of m-commerce mobile applications to further validate the model.
While it was our intention to develop a comprehensive model explaining the customer experience with m-commerce mobile applications, we have taken the initial steps, thus the
23
explore customers’ perceptions of privacy in mobile applications and its influence on the
customer experience
Additionally, the moderating role of screen size presents an interesting finding, while we provide two categories of screen size, future research could explore this variable further and offer insights into consumer behaviour on a wider range of screen-sizes.
Lastly, while interesting findings are reported, as this research was conducted solely within the UK, we encourage future research to extend this research by testing the MACE model in other geographical locations with different cultural settings to conduct cross-cultural comparison of our results.
CONCLUSION
This research has advanced our theoretical understanding of the customer experience with retailers’ m-commerce mobile applications. With the continued advancement in technology and the need for retailers to continually adapt to evolving consumer demands and new channels of service delivery, this research provides retailers numerous managerial
implications in relation to the customer experience with their mobile applications. The paper has taken the initial steps in developing a customer experience with m-commerce mobile applications model. The key variables influencing the customer experience have been established, with utilitarian variables driving the customer experience. In contrast to flow theory and its positive effect on the customer experience within the e-commerce
24 APPENDIX 1
Respondent Characteristics Frequency (n) %
Gender Male Female 481 543 47 53
Age (in years) 18 – 24 25 – 34 35 – 44 45 – 54 55 – 65
102 348 277 184 113 10 34 27 18 11 Education High School
College Graduate (FE) University Graduate (HE) No Qualifications 133 481 410 0 13 47 40 0 Occupation Full Time Part Time Unemployed Retired
Responses per App John Lewis
Marks and Spencer Next H&M 748 174 73 29 265 265 263 231 73 17 7 3 26 26 26 22
Main Use of the App Shopping to make a purchase Browsing
Keeping up to date with news
Frequency of Use Daily
Weekly Monthly
A few times per year
Purchase Frequency through App Daily
Weekly Monthly
A few times per year Less often
Preferred form of shopping Through Retailer’s Application Through Website
In store
25 REFERENCES
Adipat, B., Zhang, D. & Zhou, L. (2011) The effects of tree-view based presentation adaptation on mobile web browsing, MIS Quarterly, 35, 99-122.
Alnawas, I. & Aburub, F. (2016) The effect of benefits generated from interacting with branded mobile apps on consumer satisfaction and purchase intentions. Journal of Retailing and Consumer Services, 31, 313-322.
Andrews, M., Luo, X., Fang, Z., Ghose, A. (2015) Mobile Ad Effectiveness: Hyper-Contextual Targeting with Crowdedness. Marketing Science, 35, 218-233. Baxendale, S., Macdonald, E. K. & Wilson, H. N. (2015) The Impact of Different
Touchpoints on Brand Consideration. Journal of Retailing, 91, 235-253.
Bellman, S., Potter, R. F., Treleaven-Hassard, S., Robinson, J. A. & Varan, D. (2011) The Effectiveness of Branded Mobile Phone Apps. Journal of Interactive Marketing, 25, 191-200.
Berry, L., Carbone, L. & Haeckel, S. (2002) ‘Managing the total customer experience’, MIT Sloan Management Review, 43, 3, 85-89.
Bhattacherjee, A. (2001) Understanding Information Systems Continuance: An Expectation-Confirmation Model, MIS Quarterly, 25, 351-370.
Bilgihan, A., Kandampully, J., and Zhang, T. (2015) Towards a unified customer experience in online shopping enviornments- Anticedents and Outcomes, International Journal of Quality and Service Sciences, Vol.8, No.1, pp. 102-119.
Blazquez, M. (2014) Fashion Shopping in Multichannel Retail: The Role of Technology in Enhancing the Customer Experience, International Journal of Electronic Commerce, Vol . 18, No. 4, pp. 97-116.
Brasel, S. A. & Gips, J. (2014) Tablets, touchscreens, and touchpads: How varying touch interfaces trigger psychological ownership and endowment, Journal of Consumer Psychology, 24, 226-233.
Bryne, B. M. (2013) Structural Equation Modeling with AMOS, Basic concepts, applications and programming, 3rd Ed., Taylor and Francis Group LLP, New York.
Chaffey, D. (2017) Mobile Marketing Statistics, Smart Insights Online, Available From:
https://www.smartinsights.com/mobile-marketing/mobile-marketing-analytics/mobile-marketing-statistics/ [Accessed 22/10/2017]
Chang, W. L., Yuan, S. T., & Carol, W. (2010) Creating the experience economy in e-commerce, Communications of the AMC, 53, 7, 122-127.
Chau, P. Y. K., & Lai, V. S. K. (2003) An empirical investigation of the determinants of user acceptance of internet banking. Journal of Organizational Computing and Electronic Commerce, 13(2),123-145.
Cheung, G. W., and Rensvold, R. B. (2008) Evaluating Goodness of fit Indexes for Testing Measurement Invariance. Structural Equation Modeling: A Multidisciplinary Journal, 9, 233-255.
Criteo. (2014) State of Mobile Commerce Q4 2014 [Online]. Available:
http://www.criteo.com/media/1427/criteo_mobile_commerce_report_2014.pdf [Accessed] 20/04/17].
26
Davis, F. D. (1989) Perceived Usefulness, Perceived Ease of Use, and User Acceptance of Information Technology, MIS Quarterly, 13, 319-340.
Davis, F. D., Bagozzi, R. P. & Warshaw, P. R. (1992) Extrinsic and Intrinsic Motivation to Use Computers in the Workplace, Journal of Applied Social Psychology, 22, 1111-1132.
Edvardsson, B. (2005) ‘Service Quality: Beyond congnitve assessment’. Managing Service Quality, 15, 2, 127-131.
Delone, W. H., Mclean, E. R. (2003) The DeLone and McLean Model of Information Systems Success: A ten-year update, Journal of Management Information Systems, 19, 9-30.
Ericsson (2015) Ericsson Mobility Report: 70 percent of world's population using smartphones by 2020 [Online]. Ericsson. Available:
http://www.ericsson.com/news/1925907 [Accessed].
Faiola, A., Newlon, C., Pfaff, M., & Smyslova, O. (2013) ‘Correlating the effects of flow and telepresence in virtual worlds: Enhancing our understanding of user behaviour in game-based learning’. Computers in Human Behaviour, 29, 1113-1121.
Fan, Q., Lee, J. Y., & Kim, J. I. (2013) The impact of website quality on flow related online shopping behaviours in C2C marketplaces, Managing Service Quality, 23, 5, 364-387. Felt, A. P., Egelman, S., Finifter, M., Akhawe, D., and Wagner, D. (2012) How to ask for
permission, Proceedings of the USENIX Conference on Hot Topics in Security (HotSec), Bellevue, WA, USA.
Garg, R. & Telang, R. (2012) Inferring app demand from publicly available data, MIS Quarterly, Forthcoming.
Grönroos, C. (2008). Service logic revisited: who creates value? And who co-creates? European Business Review, 20(4), 298–314.
Gounaris, S., Dimitriadis, S., and Stathakopoulos, V. (2005) Antecedents of perceived quality in the context of Internet retail stores. Journal of Marketing Management, 21, 7, pp. 669-682.
Gu, J., Xu, Y., Xu, H., Zhang, C., and Ling, H. (2017) Privacy concerns for mobile app download: An elaboration likelihood model perspective, Decision support systems, 94, 19-28.
Hair, J. F., Black, W., Babin, B. and Anderson, R. (2010) Multivariate Data Analysis, Prentice Hall.
Hoffman, D. L., & Novak, T. P. (2009) ‘Flow Online: Lessons Learned and Future Prospects’. Journal of Interactive Marketing, 23, 23-34.
Homburg, C., Danijel, J., and Kuehnl, C. (2015) ‘Customer Experience Management: Toward implementing an evolving marketing concept’. Journal of Academy of Marketing Science, 43, 1 – 25
Hsiao, C.-H., Chang, J.-J. & Tang, K.-Y. (2016) Exploring the influential factors in continuance usage of mobile social Apps: Satisfaction, habit, and customer value perspectives, Telematics and Informatics, 33, 342-355.
Hulland, J. (1999) Use of partial least squares (PLS) in strategic management research: a review of four recent studies, Strategic Management Journal, 20, 195-204. Izard, E. (1977) ‘Human Emotions’, Plenum Press, New York, NY.
Jonathan, R. (2000) eCommerce: a critical review. International Journal of Retail & Distribution Management, 28, 417-444.
Juttner, U., Schaffner, D., Windler, K., and Maklan, S. (2013) Customer Service Experience- Developing and applying a sequential incident laddering technique. European Journal of Marketing, 47, 5/6, 738-768.
27
Kang, J.-Y. M., Mun, J. M. and Johnson, K. K. P (2015) In-store mobile usage: Downloading and usage intention toward mobile location-based retail apps. Computers in Human Behavior, 46, 210-217.
Kim, J., Fiore, A. M. & Lee, H.-H (2007) Influences of online store perception, shopping enjoyment, and shopping involvement on consumer patronage behavior towards an online retailer, Journal of Retailing and Consumer Services, 14, 95-107.
Kim, M., Kim, J-H., and Lennon, S. J. (2006) Online service attributes available on apparel retail web sites: An E-S-QUAL approach. Managing Service Quality, 16, 1, pp. 51- 77.
Kim and Baek (2017) Examining the antecedents and consequences of mobile app engagement, Telematics and Informatics, In Press.
Klaus, P. (2013) ‘The case of Amazon.com: towards a conceptual framework of online customer service experience (OCSE) using the emerging consensus technique (ECT)’. Journal of Services Marketing, 47, 6, 433-457.
Kuhlthau, C.C. (2004) Seeking meaning: a process approach to library and information services, 2nd Edition, Libraries Limited, Westport.
Lee, A. S., & Jeong, M. (2010) ‘Effects of e-servcescape on customers flow experiences’. Journal of Hospitality and Tourism Technology, 3, 47-59.
Lee, C. H., & Crange, D. A. (2011) ‘Personalisation - privacy paradox: The effects of personalisation and privacy assurance on customer responses to travel web sites’, Tourism Management, 32, 987-994.
Lee, G., G. & Lin, H., F. (2005) ‘Impact of organisational learning and knowledge
management factors on e-business adoption’, Management Decision, 43, 2, 171-188. Lee, Y., Chen, A. N. K., and llie, V. (2010) Can online wait be managed? The effect of filler interfaces and presentation modes on perceived waiting time online, MIS Quarterly, 36, 2, 365-394.
Lemke, F., Clark, M. & Wilson, H. (2011) ‘Customer experience quality: an exploration in business and consumer contexts using repertory grid technique’, Journal of Academy of Marketing Science, 39, 6, 846-869.
Loiacono, E. T., Watson, R. T. and Hoodhue, D. L. (2002) WEBQUAL: Measure of web site quality. Marketing Educators Conference: Marketing Theory and Applications, 13, pp. 432-437.
Loiacono, E. Watson, R. and Goodhue, D. (2007) "WebQual: An Instrument for Consumer Evaluation of Web Sites" International Journal of Electronic Commerce, Vol. 11, No. 3, pp. 51-87.
Magrath, V., and McCormick, H. (2013) Marketing design elements of mobile fashion retail apps, Journal of Fashion Marketing and Management: An International Journal, 17, 1, 115-134.
Martin, J., Mortimer, G., and Andrews, L. (2015) ‘Re-examining online customer experience to include purchase frequency and perceived risk’. Journal of retailing and consumer services, 25, 81 – 95.
Mathwick, C., Malhotra, N. & Rigdon, E (2001) Experiential value: conceptualization, measurement and application in the catalog and Internet shopping environment, Journal of Retailing, 77, 39-56.
Mclean, G., and Wilson, A (2016) Evolving the online customer experience … is there a role for online customer support? Computers in Human Behavior, 60, 602-610.
28
Mehrabian, A. & Russell, J. (1974) ‘Approach to Environmental Psychology’, MIT Press, Cambridge, MA.
Meyer, C., & Schwager, A. (2007) ‘Understanding Customer Experience’. Harvard Business Review, 85, 2, 116-126.
Mollen, A., & Wilson, H. (2010) ‘Engagement, Telepresence and Interactivity in online consumer experience: Reconciling Scholastic and Managerial Perspectives’. Journal of Business Research, 63, 919-925.
Novak, T. P., & Hoffman, D. L., & Yung, Y. F. (2001) ‘Measuring the customer experience in online environments: A structural equation approach’. Marketing Science, 19, 1, 22-42.
Ono Akinori, Nakamura, A., Okuno, A., and Sumikawa M. (2012) Consumer Motivations in Browsing Online Stores with Mobile Devices, International Journal of Electronic Commerce, 16, 4, pp. 153-178.
Ozturk, A. B., Bilgihan, A., Nusair, K., Okumus, F. (2016) What keeps the mobile hotel booking users loyal? Investigating the roles of self-efficany, compatibility, perceived ease of use and perceived convenience, International Journal of Information
Management, 36, 1350-1359.
Pallant, J. (2013) SPSS Survival Manual: A step by step guide to data analysis, 5th Ed., Open University Press, New York.
Parasuraman, A., Zeithaml, V. A., and Berry, L. L. (1988) SERVQUAL: A multiple-item scale for measuring consumer perceptions of service quality, Journal of Retailing, 64, 1, 12-40.
Parasuraman, A., Zeithaml, V. A., and Malhotra, A. (2005) ‘E-S-QUAL: a multiple-item scale for assessing electronic service quality’. Journal of Service Research, 7, 3, 213-233.
Payne, A., Storbacka, K. & Frow, P. (2008), ‘Managing the co-creation of value’, Journal of the Academy of Marketing Science, 36, 83-96.
Piotrowicz, W. & Cuthbertson, R. (2014) Introduction to the Special Issue Information Technology in Retail: Toward Omnichannel Retailing, International Journal of Electronic Commerce, 18, 5-16.
Podsakoff, P. M., Mackenzie, S. B., Lee, J. Y., and Podsakoff, N. P. (2003) Common Method Biases in Behavioural Research: A critical review of the literature and recommended remedies, Journal of applied Psychology, 88, 5, 897 – 903.
Pousttchi, K., Tilson, D., Lyytinen, K., Hufenbach, Y. (2015) Introduction to the special issue on mobile commerce: Mobile Commerce Research Yesterday, Today, Tomorrow- What remains to be done? International Journal of Electronic Commerce, 19.4, 1-20. Reinartz, W. and Ulaga (2008) How to sell services more profitably, Harvard Business
Review, 86, 5, 90-96.
Rose, S., Clark, M., Samouel, P. & Hair, N. (2012) Online Customer Experience in e-Retailing: An empirical model of Antecedents and Outcomes, Journal of Retailing, 88, 308-322.
Schembri, S. (2006) Rationalizing service logic, or understanding services as experience? Marketing Theory, Vol. 6 No. 3, pp. 381-92.
Shankar, V. (2016) Mobile Marketing: The Way Forward, Journal of Interactive Marketing, 34, 1-2.
29
Shankar, V., Venkatesh, A., Hofacker, C. & Naik, P. (2010) Mobile Marketing in the Retailing Environment: Current Insights and Future Research Avenues, Journal of Interactive Marketing, 24, 111-120.
Shobeiri, S., Mazaheri, E., and Laroche, M. (2015) ‘Creating the right customer experience online: The influence of culture’. Journal of Marketing Communications, 1 – 21. Smith (2016) 4 Ways to ensure Valid responses for your online survey, Qualtrics, Available
From: https://www.qualtrics.com/blog/online-survey-valid-responses/ Accessed [29/05/16]
Song, J. H. & Zinkhan, G. M. (2008) Determinants of Perceived Web Site Interactivity. Journal of Marketing, 72, 99-113.
Tabchnick, B. G., and Fidell, L. S. (2007) Using Multivariate Statistics, 5th Ed. Boston: Allyn and Bacon.
Tam, K. Y. and Ho, S. Y. (2005) Web personalization as a persuasion strategy: An
elaboration likelihood model perspective, Information Systems Research, 16, 3, 271 – 291.
Trevinal, A. M., and Stenger, T. (2014) Toward a conceptulization of the online shopping experience, Journal of Retailing and Consumer Services, 314-326.
Truel, O., & Connelly, C.E. (2013): ‘Too busy to help: Antecedents and outcomes of interactional justice in web-based service encounters’. International Journal of Information Management, 33, pp.674-683.
Van Ittersum, K., Wansink, B., Pennings, J. M. & Sheehan, D. (2013) Smart Shopping Carts: How Real-Time Feedback Influences Spending, Journal of Marketing, 77, 21-36. Vargo, S. L., & Lusch, R. F. (2006) ‘Service-dominant logic: what it is, what it is not, what it
might be’, in Lusch, R. F. and Vargo, S. L. (Eds), The Service-Dominant Logic of Marketing: Dialog, Debate, and Directions, M.E. Sharpe, New York, NY, pp. 43-56. Venkatesh, V. and Bala, H. (2008) Technology Acceptance Model 3 and a Research Agenda
on Interventions, Decision Science, 39, 2, 273-312.
Venkatesh, V., Thong, J. Y. & Xu, X. (2012) Consumer acceptance and use of information technology: extending the unified theory of acceptance and use of technology, MIS Quarterly, 36, 157-178.
Verhoef, P. C., Kannan, P. K. & Inman, J. J. (2015) From Multi-Channel Retailing to Omni-Channel Retailing: Introduction to the Special Issue on Multi-Omni-Channel Retailing, Journal of Retailing, 91, 174-181.
Verhoef, P., Lemon, K., Parasuraman, A., Roggeveen, A., Schlesinger, L. & Tsiros, M. (2009) Customer experience: determinants, dynamics and management strategies, Journal of Retailing, 85, 1, 31-41.
Wan Rashid, W. E., Muda, M., Pindeh, N., Suki, N. M. & Suki, N. M. (2016) The Fifth International Conference on Marketing and Retailing (5th INCOMaR) 2015 User Acceptance on Mobile Apps as an Effective Medium to Learn Kadazandusun Language. Procedia Economics and Finance, 37, 372-378.
Wang, R J.-H., Malthouse, E. C. & Krishnamurthi, L. (2015) On the Go: How Mobile Shopping Affects Customer Purchase Behavior, Journal of Retailing, 91, 217-234. WARC (2015) Mobile Apps are the future of media, WARC Online, Available From
www.warc.com/mobile-apps-are-the-future-of -media/ [Accessed 26/05/2017] WARC (2017) 5.5bn people will use mobile devices by 2022, WARC Online, Available
From:https://www.warc.com/NewsAndOpinion/News/5.5bn_people_will_use_mobile _devices_by_2022/39021 [Accessed 26/10/2017]