Application of a MW-Scale Motor-Generator Set to
Establish Power-Hardware-in-the-Loop Capability
Qiteng Hong
1, Ibrahim Abdulhadi
2, Andrew Roscoe
1, and Campbell Booth
11Institute for Energy and Environment,2Power Networks Demonstration Centre, University of Strathclyde
Glasgow, G1 1XW, UK Email: [email protected]
Abstract—This paper presents a Power-Hardware-in-the-Loop (P-HiL) testbed coupled to a MW-scale Motor-Generator (MG) set. The P-HiL configuration interfaces an 11 kV physical distribution network with a transmission network modeled in a Real Time Digital Simulator (RTDS) through the MG set. Uniquely, and in contrast with other P-HiL arrangements, the MG set used is equipped with a proprietary frequency controller with an inherent response that does not provide the desired characteristics to cater for a P-HiL interface. The paper describes a methodology to tackle this problem associated with undesirable response of the MG set’s existing controller by introducing additional frequency and phase control loops. Experimental results are presented and show that the P-HiL testbed is capable of maintaining a high level of synchronization during disturbances and allows the power interaction between the model and physical network. The testbed offers a realistic and flexible testing environment for prototype systems connected to distribution networks with a specific focus on testing systems that control demand side resources for frequency response during loss of generation events.
Index Terms—Power-Hardware-in-the-Loop (P-HiL), real-time simulation, control design, system testing.
I. INTRODUCTION
Hardware-in-the-Loop (HiL) is a technique for testing pro-totype systems by interfacing the physical Hardware-under-Test (HuT) with wider virtual systems modeled in a Real Time Simulator (RTS). Compared to pure simulation-based tests, HiL offers a more realistic testing environment as the actual devices are tested directly, which avoids any inaccuracy due to potential defects in the device models and allows the detection of potential issues with the hardware platform. Compared to tests using a pure a physical environment, HiL offers a more flexible and economic testing solution as the models can be easily changed, extended, and operated under a wide range of scenarios [1].
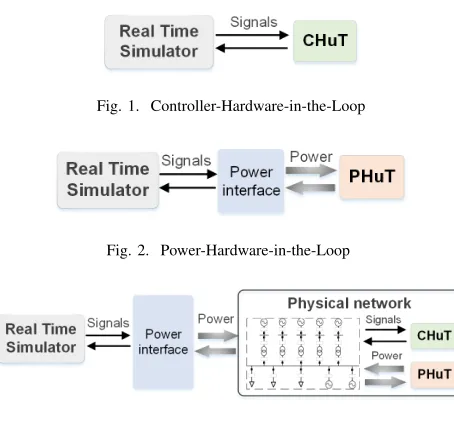
There are two main categories of HiL, i.e. Controller-Hardware-in-the-Loop (C-HiL) and Power-Hardware-in-the-Loop (P-HiL). C-HiL, as illustrated in Fig. 1, is widely used for testing secondary equipment, e.g. protection relays and controllers [2], [3]. The interaction between the simulation and the physical devices is typically through analogue/digital signals. The devices being tested, also referred as Controller-Hardware-under-Test (CHuT), receive measurement signals from real time simulation, process them and send command
Fig. 1. Controller-Hardware-in-the-Loop
[image:1.612.322.549.201.414.2]Fig. 2. Power-Hardware-in-the-Loop
Fig. 3. Network-in-the-Loop
signals to the network model to allow the effect of the control actions to be observed in simulation.
devices can also be tested in this arrangement, as the physical network is coupled to the model, which allows the emulation of a wide range of operational conditions in simulation and applying them to the PHuT through the power interface to test its reaction to these conditions. This paper presents such a P-HiL testbed that interfaces an 11 kV physical network with a GB transmission network model through a MW-scale MG set. The key element for establishing the P-HiL capability is the control of the P-HiL interface. In [4], a review of various available P-HiL interfaces is provided, along with methods for the analysis of stability issues at the power interfaces. In [6], different power amplifiers that can be used for P-HiL setup are introduced and compared. These publications provide useful information for establishing a P-HiL testbed, but detailed control of the power interface is not comprehen-sively discussed. In [7], a P-HiL setup using voltage source amplifier at a MW scale is presented. However, the method is not readily applicable to the cases where MG sets are used as the power amplifier. In [5] and [8], P-HiL setups using MG sets are reported and the associated control tuning methods are presented. However, the presented control algorithm is only applicable to the scenarios where the direct control of generators input mechanical power is readily accessible. In many cases, especially for commercially-available MG sets equipped with proprietary controllers, there is a lack of flexibility in the development of the control strategy to achieve the desired dynamic responses in a P-HiL configuration.
In this paper, the MG set being used as the P-HiL interface is rated at 1 MW and is equipped with a frequency controller that does not inherently provide adequate responses to frequency commands for the purposes of establishing a P-HiL interface. A methodology has been developed to tackle this problem by introducing augmented frequency and phase control loops using measurements from the models of Phasor Measurement Units (PMUs) which are readily available in the RTDS. The P-HiL setup interfaces a GB transmission network model with an 11 kV physical network including a number of loads. While the testbed can be used for testing various systems connected to the distribution network, this paper will specifically focus on testing Wide-Area Monitoring and Control Systems (WAMCS) that deploy frequency response using demand side resources during frequency disturbances. More detail about the motiva-tion of the work is presented in Secmotiva-tion II-A.
This paper is structured as follows: Section II presents the motivation of the work and an overview of the P-HiL testbed. Section III introduces the implementation of the P-HiL setup using the MG set. Section IV presents experimental results to demonstrate the capability of the testbed. Section V concludes the paper and highlights future work.
II. CONTEXT OF THEWORK ANDOVERVIEW OF THE P-HIL TESTBED
A. Context and Motivation of the work
The GB transmission network has seen an increase in the penetration of renewables in recent years and this trend is expected to continue in the coming decades [9]. This
brings significant operational challenges as faster responses to frequency disturbances become more critical due to the decrease in overall system inertia. WAMCS systems that allow fast detection of grid events and deployment of suitable frequency responses are considered as potentially effective solutions for these challenges [10]. One example of such WAMCS schemes is termed “Enhanced Frequency Control Capability (EFCC)” scheme [11]. This system takes real-time synchronized measurements from PMUs installed across the transmission network and instructs fast and coordinated responses from a variety of controllable resources (e.g. wind, PV, demand side resource, etc.) within one second.
Such systems require relatively complex algorithms and constitute various distributed control devices and communi-cation links. Any design defects or hardware problems could potentially lead to the deterioration of the control system performance, posing a significant risk of instability to the grid. Therefore, prior to rolling out such schemes in the actual networks, a comprehensive validation of their performance under realistic test conditions is necessary.
To test such a system, ideally, the actual hardware should be interfaced with physical resources as it allows the validation of the algorithm, the hardware, the interfaces, along with communication links in the most realistic manner. Emulation of frequency disturbances events is also needed for creating testing scenarios. Furthermore, the effectiveness of the control actions to restore the frequency also need to be validated. P-HiL provides an ideal option for meeting these requirements as it allows the interface between simulation and physical network with power exchanges. The control hardware can be connected to the actual resource in the physical network and the model of the wider network can be created for emulating various frequency disturbance events. The power interface between the model and the physical network allows the effectiveness of the control action in restoring frequency to be tested. This paper presents such a P-HiL testbed.
The P-HiL testbed not only allows the validation of the WAMCS controllers’ capability to detect frequency events and instruct the correct amount of response from distributed resource, but also enables the evaluation of the capability of the distributed resources in responding to the control command to provide desired frequency response. In this paper, the distributed resource being used is loads, which presents the most challenging scenario for the testbed due to the step change in active power.
B. Overview of the P-HiL configuration
Fig. 4. Overview of the P-HiL configruarition
current from the MG set (IM G) to control a current source connected to the associated bus in the model (Ibus).
When the testbed is being used for testing WAMCS sys-tems that deploy fast frequency response using demand side resources, frequency events (e.g. loss of generation) can be simulated using the RTDS network model. The load banks are used for emulating resources that provide a frequency response through load curtailment (or increase depending on the response required). When a frequency event is triggered, the P-HiL configuration allows testing the WAMCS systems capability to detect the events in a timely manner and instruct the correct amount of resource to respond. Furthermore, the effect of the control actions (i.e. load curtailment) will be re-flected to the overall system frequency through the current fed back to the simulation, and thereby allowing the effectiveness of control actions from the systems being tested.
[image:3.612.57.295.50.165.2]A 5-region GB transmission network model has been con-structed in RTDS and is shown on the left hand side of Fig. 4. Each region represents part of the GB network in a certain geographical area. The model is constructed based on data published in [12]. Each of the regions contains a synchronous generator, a transformer and an aggregated load. The regions are interconnected through transmission line models. By properly tuning the governor control, configuring associated parameters of the generators and adjusting power flow levels, the model has been validated against a number of real historical frequency disturbance events.
The 11 kV physical network and the MG set used in this setup is at the Power Networks Demonstration Centre (PNDC) [13]. The PNDC test network is composed of 11 kV and 415 V underground and overhead line distribution circuits with industry standard switchgear, protection, control and SCADA equipment and a distribution management system. Load banks are used to emulate customers (e.g. a data center) and are used in this testbed to emulate a demand side resource to be controlled in response to frequency disturbance events.
III. IMPLEMENTATION OF THEP-HIL TESTBED
[image:3.612.337.539.51.147.2]When implementing the P-HiL testbed, there are two main objectives. Firstly, the MG set should be controlled to be synchronous with the simulated network, which is important for emulating the disturbances events simulated in the model. Secondly, any changes in the power flow from the MG
Fig. 5. MG sets proprietary frequency controller
Fig. 6. MG set’s performance in following the frequency signal from simulation
set should be reflected in the model, so that the effect of the control actions applied to the load banks to the wider simulated network model can be examined. In this section, the methodology adopted to achieve the above objectives is presented.
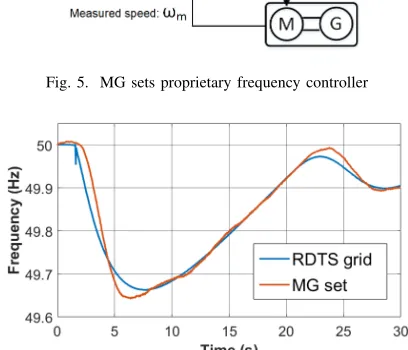
A. The MG set’s proprietary frequency controller
As mentioned previously, the MG set being used is equipped with a proprietary unchangeable frequency controller for reg-ulating its frequency as illustrated in Fig. 5. It takes a speed reference signal and feeds it into a rate of change limiter block (typically set as 5 Hz/s) and a saturation limiter block (typically set as 1.2 pu) to avoid the MG set operating beyond its design limits. The resulting reference signal from the limiter blocks is then compared to the measured rotating speed of the generator to calculate the speed error, which is subsequently fed to a Proportional and Integral (PI) controller. The output is the torque that is applied to the motor to drive the generator to achieve the targeted speed.
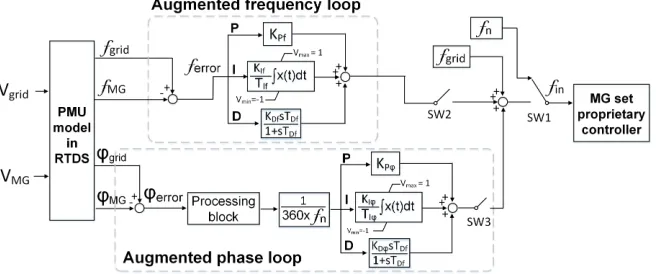
[image:3.612.334.538.124.299.2]P-HiL setups not only frequency tracking is required, but also the phases of the simulation and the MG set should also be locked.
B. Enhanced control of the MG set for P-HiL interface
To tackle the frequency control problem as described in Section III.A, augmented frequency and phase control loops integrated with the MG set’s existing controller, as illustrated in Fig. 7, have been developed and the values for the associated parameters are listed in Table I. The MG set is initially com-manded to run at the nominal frequency (i.e. fn= 50 Hz) so that it is at its steady state before being commanded to follow the frequency signal from simulation to avoid undesirable oscillation.fgridis the frequency measured from the target bus that the MG is supposed to be synchronized with in simulation. Once the simulation and the MG set have reached their steady states, the input signal fin will be switched to fgrid, where the MG set will rely purely on its own frequency controller to follow the frequency of the simulation. As mentioned previously, the MG sets controller is not capable of providing satisfactory frequency tracking during disturbances and there is no phase tracking between the simulation and the MG set. When the MG set reaches its steady state, the augmented frequency loop will be closed. This control loop aims to eliminate overshoot and oscillation problems that are inherent in the MG sets existing controller when striving to track frequency. Different from the work presented in [5], [8], the new frequency control loop does not have access to the direct control of input mechanical power to the generator for frequency tracking. Instead, it uses the error (ferror) between
fgrid and the MG set frequencyfM G during disturbances to adjust the frequency command signal fin that is input to the MG set’s existing controller, which itself contains control loop that manipulates generator’s input mechanical power for fre-quency control. fM G andfgrid are measured using the PMU model that is available in RTDS. The blocks taking ferror are a Proportional-Integral-Derivative (PID) controller. The term (KDfsTDf)/(1 +sTDf) is the RTDS implementation of the derivative controller and it was suggested by RTDS Technologies Inc. that KDf should be set large compared to
TDf in order for it to be mathematically stable. In this work,
KDf is chosen 100 times ofTDf as listed in Table I. The augmented phase loop is closed when the frequency error between the MG set and simulation falls below 0.01 Hz for 3 s. The frequency error threshold of 0.01 Hz and holding time of 3 s are manually configurable, and in this case, the values have been chosen empirically. This control loop is designed to lock the phases between the simulation and the MG set.φgridandφM Gare the phases of voltages at the target bus in simulation and the MG set terminal respectively, and they are also measured using the PMU model in RTDS. The phase error signals are firstly fed into a processing block to pre-process the data (e.g. ensuring the error ranges within±π
and is expressed in degrees). Before feeding the output to the PID controller, the phase error signal is transformed into in the form of frequency error. The output of the PID controller
TABLE I
VALUES OFPARAMETERSUSED IN THEPROPOSEDCONTROLLOOPS
Parameter Description Value
KP f Frequency loop proportional controller gain 3
KIf Frequency loop integral controller gain 1
TIf Frequency loop integral controller time constant 1
KDf Frequency loop derivative controller gain 5
TDf Frequency loop derivative controller time
con-stant
0.05
KP φ Phase loop proportional controller gain 10
KIφ Phase loop integral controller gain 3
TIφ Phase loop integral controller time constant 1
KDφ Phase loop derivative controller gain 5
TDφ Phase loop derivative controller time constant 0.05
is used for adjusting fin so as to minimize the phase error between the simulation and the MG set.
In any P-HIL simulation, the relative path delays (phase lags) in all the current and voltage measurement/simulation paths must be assessed [5], [8]. In this P-HiL setup, one of the main sources of delay is caused by the measurements using PMUs. However, since the same PMU block is used for measuring all frequency and phase quantities in the control loop, the relative loop delays caused by PMU measurements are eliminated, thereby largely simplifying the control loop implementation. Nevertheless, there is still a level of delay (typically in the order of 50 µs or multiples thereof) in the production of the simulatedVgrid from the RTDS simulation process. This can be compensated by inserting a matching time delay in the VM G path. In this work, this delay has not been fully quantified and taken into account and will be investigated in future activities. The experimental results presented in Section IV show a high level of accuracy in frequency and phase tracking and power exchange between simulation and physical network can still be achieved when this delay is neglected.
C. Current feedback loop
In order to reflect the power flow changes from the MG set to the simulated network, a current feedback loop is required. As shown in Fig. 8, this is achieved by taking the instantaneous 3-phase current signal at the MG set terminal to drive a 3-phase controllable current source connected to a targeted bus in the model. Compared to the total demand of the overall transmission network, the capacity of the load banks in the physical network is relatively small (up to 600 kVA). Therefore, a scaling factor (GI) is applied to amplify the feedback current signal so that the capacity of the physical network can be scaled to a desired level. The total level of power amplificationGP is: GP =
Vgrid
VM G ×GI.
IV. EXPERIMENTALRESULTS
Fig. 7. Enhanced control of MG set for synchronizing it with the RTDS simulation
Fig. 8. Current feedback for the P-HiL configuration
A. Experimental setup
Fig. 9 illustrates the configuration of the implemented P-HiL testbed. In the ultimate tests, the WAMCS system to be tested will receive real time monitoring signal from both RTDS model and the physical network. The demand side resource, i.e. the load bank, will also periodically update its availability information to the WAMCS system. When a frequency event is detected, the WAMCS system will send a command to the load bank to trigger the demand side response to provide frequency support. In this section, as the purpose is to evaluate the capability of the testbed, the WAMCS system has not been installed and the control action will be emulated.
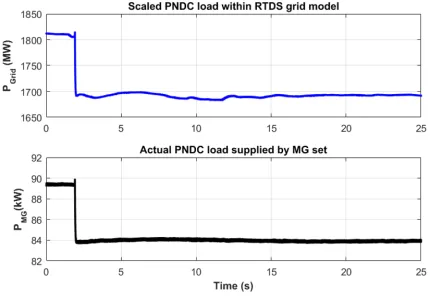
The augmented MG set control algorithm is implemented in RTDS. The MG set contains an analogue input/output interface, which is connected to the RTDS through a fiber link for sending control signals and receiving measurement signals. The PMU model in RTDS is used for measuring the frequency and phase from simulation and the MG set terminal voltage. The MG set is connected to the 11 kV network through an 11/11 kV isolation transformer and supplies around 90 kW resistive load through an 11 kV cable circuit and a 11/0.4 kV step-down transformer.
To test the capability of the testbed, a frequency event that leads to a loss of generation of 1 GW (a typical size of loss of generation event in the GB transmission network) in RTDS is triggered as a testing case. An emulated control action was sent to decrease the load by 5 kW at around 0.5 s following
Fig. 9. Experimental setup for the described P-HiL testbed
the frequency disturbance in the physical network to provide frequency response.
B. Test results
The performance of the frequency and phase tracking are shown in Fig. 10 and Fig. 11 respectively. The maximum frequency error occurs right after the frequency event and that’s the most severe condition for the testbed. As shown in Fig. 10, the maximum frequency tracking error is slightly below 0.04 Hz and the controller react promptly to the error and managed to bring the error to below 0.01 Hz after around 1 s after the event and maintained the level of accuracy for the remaining of the event duration. The phase tracking performance is also very promising as shown in Fig. 11, with a maximum error around 10degand steady state error smaller than 3deg.
[image:5.612.319.556.237.366.2]Fig. 10. Experimental setup for the proposed P-HiL testbed
Fig. 11. Experimental setup for the proposed P-HiL testbed
Fig. 12. Experimental setup for the proposed P-HiL testbed
system that deploys frequency response using demand side resources.
V. CONCLUSIONS ANDFUTUREWORK
This paper has presented a P-HiL setup that interfaces a GB transmission network model in RTDS with an 11 kV physical network using a MW-scale MG set. One key challenge for
establishing the P-HiL configuration is that the MG set’s own proprietary frequency controller does not provide the desired characteristics for the P-HiL interface. A methodology has been presented to overcome the problem by introduc-ing additional frequency and phase control loops to adjust the input control signal to the MG set’s built-in controller. The P-HiL configuration has been tested and experimental results show it is capable of maintaining a high level of synchronization between simulation and physical network, and allowing the change in load in the physical network to be reflected in the wider simulated model. The P-HiL configuration offers a realistic testbed for WAMCS systems that enable frequency response using demand side resources during frequency disturbances. Future work will focus on the implementation of the WAMCS system to be validated in the testbed and conduct comprehensive tests of the performance of the WAMCS system using the established P-HiL testbed.
ACKNOWLEDGEMENT
This work is sponsored by National Grid under the Network Innovation Competition (NIC) scheme.
REFERENCES
[1] DERlab, “European White Book on Real-Time Powerhardware-in-the-Loop Testing,” Tech. Rep., 2011.
[2] B. Lu, X. Wu, H. Figueroa, and A. Monti, “A low-cost real-time hardware-in-the-loop testing approach of power electronics controls,” IEEE Trans. on Industrial Electronics, vol. 54, no. 2, pp. 919–931, April 2007.
[3] J. Tang, J. Liu, F. Ponci, and A. Monti, “Adaptive load shedding based on combined frequency and voltage stability assessment using synchrophasor measurements,”IEEE Trans. on Power Systems, vol. 28, no. 2, pp. 2035–2047, May 2013.
[4] W. Ren, M. Steurer, and T. Baldwin, “Improve the stability and the accu-racy of power hardware-in-the-loop simulation by selecting appropriate interface algorithms,” IEEE Trans. on Industry Applications, vol. 44, no. 4, pp. 1286–1294, July 2008.
[5] A. Roscoe, A. Mackay, G. Burt, and J. McDonald, “Architecture of a Network-in-the-Loop Environment for Characterizing AC Power-System Behavior,” IEEE Trans. on Industrial Electronics, vol. 57, no. 4, pp. 1245–1253, April 2010.
[6] F. Lehfuss, G. Lauss, P. Kotsampopoulos, et al., “Comparison of multiple power amplification types for power hardware-in-the-loop applications,” in 2012 Complexity in Engineering (COMPENG). Proceedings, June 2012, pp. 1–6.
[7] M. Steurer, C. Edrington, M. Sloderbeck, W. Ren, and J. Langston, “A megawatt-scale power hardware-in-the-loop simulation setup for motor drives,”IEEE Trans. on Industrial Electronics, vol. 57, no. 4, pp. 1254– 1260, April 2010.
[8] A. Roscoe, I. Elders, J. Hill, and G. Burt, “Integration of a mean-torque diesel engine model into a hardware-in-the-loop shipboard network sim-ulation using lambda tuning,”IET Electrical Systems in Transportation, vol. 1, no. 3, pp. 103–110, September 2011.
[9] National Grid, “System Operability Framework 2016,” Tech. Rep., 2016. [10] D. Wilson, S. Clark, S. Norris, et al., “Advances in Wide Area Moni-toring and Control to address Emerging Requirements related to Inertia, Stability and Power Transfer in the GB Power System,” inCIGRE Paris Session, 2016.
[11] P. Wall, N. Shams, V. Terzija, et al., “Smart frequency control for the future gb power system,” in 2016 IEEE PES ISGT-Europe, Oct 2016, pp. 1–6.
[image:6.612.67.282.443.591.2]