City, University of London Institutional Repository
Citation
:
Henkin, R. ORCID: 0000-0002-5511-5230 and Turkay, C. ORCID:
0000-0001-6788-251X (2018). Towards Multimodal Data Analytics: Integrating Natural Language into
Visual Analytics. Paper presented at the Multimodal Interaction for Data Visualization
Workshop at AVI 2018, 29 May 2018, Grosseto, Italy.
This is the published version of the paper.
This version of the publication may differ from the final published
version.
Permanent repository link:
http://openaccess.city.ac.uk/20111/
Link to published version
:
Copyright and reuse:
City Research Online aims to make research
outputs of City, University of London available to a wider audience.
Copyright and Moral Rights remain with the author(s) and/or copyright
holders. URLs from City Research Online may be freely distributed and
linked to.
Towards Multimodal Data Analytics:
Integrating Natural Language into
Visual Analytics
Rafael Henkin
giCentre, City, University of London
Northampton Square EC1V 0HB, London, UK [email protected]
Cagatay Turkay
giCentre, City, University of London
Northampton Square EC1V 0HB, London, UK [email protected]
Permission to make digital or hard copies of part or all of this work for personal or classroom use is granted without fee provided that copies are not made or distributed for profit or commercial advantage and that copies bear this notice and the full citation on the first page. Copyrights for third-party components of this work must be honored. For all other uses, contact the owner/author(s). MultimodalVis 18 Workshop at AVI 2018, May 29, 2018, Grosseto, Italy. https://multimodalvis.github.io
c
2018 Copyright is held by the owner/author(s).
Abstract
The continuous interaction between users and the system in visual analytics can be considered a dialogue. We propose the use of multiple two-way channels facilitated by a multimodal interface as a central aspect of
interactive visualization design, in particular, the use of natural language with interactive visualization. We discuss key related concepts, potential benefits, challenges and opportunities that emerge as a research agenda for multimodal data analysis.
ACM Classification Keywords
Human-centered computing [Interaction design]: Interaction design theory, concepts and paradigms
Introduction
The continuous interaction between users and systems in visual analytics can be considered adialogue [10]. From the user side, the dialogue often happens through multiple one-way channels – selecting items with direct
manipulation or modifying parameters with menus. The feedback that the system then returns, however, is mostly restricted to a one-way channel in the form of
we address in this ongoing work; our focus at this stage is on the use of natural language in interactive visualization.
By envisioning the use of multiple two-way channels facilitated by a multimodal interface, we argue that there are benefits to systems and users; maximizing these benefits requires design choices that depend on the context of the exchange of information, such as the type of information, user tasks and roles and the stages of analysis.
Figure 1: Example of multi-channel dialogue.
We discuss potential benefits and underlying challenges related to this context, setting up a research agenda for the integration of natural language into visual data analysis.
Concepts for multimodality in analytical
pro-cesses
Regarding natural language and multimodality, natural language has seen a recent surge of interest in interactive visualization, with researchers focused on the
implementation of common visualization interactions in natural language interfaces [2,8]. To move beyond replication of interactions from the information
visualization literature, we suggest that it is essential to identify therole of users at different stages of analysis. On this topic, Meignan et al. [5] described five user roles for intelligent systems in operations research, which are based on various aspects of interacting with algorithms, but primarily, the target of the user interaction. In visual analytics, equivalent roles can be defined for the targets that match the stages and elements of analytical workflows, as follows:
Adjust/enrich: when the user modifies theinputs used by algorithm, such as the data items or classes used in
classification problems;
Assist: when the user mimics the algorithm by correcting
outputs, which can be fed back to the system for improvement;
Guiding: when the user modifies thefeatures used by algorithms, such as including or excluding attributes that are used for a clustering method, or steers algorithms;
Tuning: when the user modifies supportingparameters of algorithms, such as the number of clusters;
Depending on the tasks and expertise, users can take on one or more of these roles at any stage of the analysis. With this in mind, the different channels through which information is sent can be assigned or limited to different roles: a system can enable the user totune algorithms only using menus andassist it using natural language. At the same time, the system might show the outputs only through visual encodings, reporting back its current state with natural language. Figure1shows an example of a multi-channel dialogue based on this design.
On the potential of multimodal analytics
This new paradigm of multimodal analytics has several potential benefits for both users and algorithmicapproaches. This section describes these two categories of benefits, as well as the underlying challenges that must be addressed to maximize them.
For the algorithm
Learning more than outputs
Active learning is an established technique through which users can provide examples of correct results to
in this type of interaction.
Quality of results
Although algorithm-specific solutions to improve results by learning from users have been investigated [3], the challenge in multimodality is maximizing the
improvements by considering not only the appropriate channels butwhatfeedback is passed on to users. Amershi et al. [1] demonstrated that users can train better models when presented withhigh-value inputs.
Targeting inputs and features
High-value inputs can also help users tosteer algorithms by targeting these inputs in the data, in a mixed role of enriching and guiding the system. A key aspect for this is presenting users with incomplete results and enabling the algorithm to be steered [10].
For the user
Comprehension
User interaction can lead to better algorithm results when they improve their understanding of the methods with the appropriate feedback [6] and new generated knowledge [7]. For this, the methods must be adapted forextracting the new knowledge and converting them into explanations.
Transparency
Systems can also communicate decisions to users without necessarily bringing new knowledge. Greater transparency was shown to to lead to increased satisfaction with results [4], also leading to an increased trust.
Challenges and opportunities
Based on these benefits, we see the following challenges and opportunities as the way forward to achieve them:
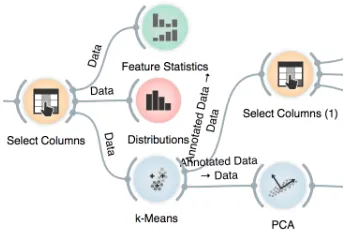
[image:4.792.494.666.236.352.2]Empirically-evidenced multimodal analytics workflows and vocabularies: Designing workflows, such as the one in figure2, enables systematic design of studies based on different user roles and stages of analysis, leading to structured vocabularies for improved active learning. At the same time, state-of-the-art AI methods facilitate extending the vocabulary with new utterances after deployment. These can then be used in explanations for increased user comprehension and transparency.
Figure 2: Example of a clustering workflow using Orange1
Establishing & evaluating user behaviour in different roles: User interaction and system feedback must match the different user roles and aims. If users intend to tweak parameters of algorithms, they must sufficiently informed byhow the parameters will change the results. This requires the development of new evaluation approaches that are targeted to elicit the role of the user and the algorithm in each step of an analytical workflow.
Visualization designs for multimodal analytics:
Although auto-completion and suggestions are commonly used to instruct users about available interactions, speech
needs an altogether different approach – visual cues might be used as hints for interaction targets. The same
principle applies to conveying feedback when the visualization does not radically change after an interaction.
Conclusion
With the increasing adoption of complex algorithmic approaches in data analysis, methods to enable analysts to effectively utilise algorithms and action on their results are of critical importance. With this paper, we argue that multimodal analytics offers novel opportunities to specifically enhance the experience and the value at this intersection of humans and algorithms. With this paper, we present an initial position to approach multimodal analytics with a discussion on open challenges and opportunities to motivate further work in this emerging area.
Acknowledgements
This work was supported by the EPSRC under grant number EP/P025501/1.
References
[1] Amershi, S., Fogarty, J., Kapoor, A., and Tan, D. Overview based example selection in end user interactive concept learning. InProceedings of the 22nd annual ACM symposium on User interface software and technology - UIST ’09, ACM Press (New York, New York, USA, 2009), 247.
[2] Hoque, E., Setlur, V., Tory, M., and Dykeman, I. Applying Pragmatics Principles for Interaction with Visual Analytics. IEEE Transactions on Visualization and Computer Graphics 24, 1 (jan 2018), 309–318. [3] Kim, B., Khanna, R., and Koyejo, O. Examples are
not Enough, Learn to Criticize! Criticism for
Interpretability. Nips, Nips (2016), 2280–2288. [4] Kulesza, T., Stumpf, S., Burnett, M., and Kwan, I.
Tell me more? The Effects of Mental Model Soundness on Personalizing an Intelligent Agent.
Proceedings of the 2012 ACM annual conference on Human Factors in Computing Systems - CHI ’12
(2012), 1.
[5] Meignan, D., Knust, S., Frayret, J.-M., Pesant, G., and Gaud, N. A Review and Taxonomy of Interactive Optimization Methods in Operations Research. ACM Transactions on Interactive Intelligent Systems 5, 3 (2015), 1–43.
[6] Rosenthal, S. L., and Dey, A. K. Towards maximizing the accuracy of human-labeled sensor data.
International Conference on Intelligent User Interfaces, Proceedings IUI (2010), 259–268. [7] Samek, W., Wiegand, T., and M¨uller, K.-R.
Explainable Artificial Intelligence: Understanding, Visualizing and Interpreting Deep Learning Models. [8] Srinivasan, A., and Stasko, J. Orko : Facilitating
Multimodal Interaction for Visual Exploration and Analysis of Networks. InfoVis TVCG 24, SI (2017), 11.
[9] Stumpf, S., Rajaram, V., Li, L., Wong, W. K., Burnett, M., Dietterich, T., Sullivan, E., and Herlocker, J. Interacting meaningfully with machine learning systems: Three experiments. International Journal of Human Computer Studies 67, 8 (2009), 639–662.
[10] Turkay, C., Kaya, E., Balcisoy, S., and Hauser, H. Designing Progressive and Interactive Analytics Processes for High-Dimensional Data Analysis. IEEE Transactions on Visualization and Computer