City, University of London Institutional Repository
Citation
:
Kohl, C., Spieser, L., Forster, B. ORCID: 0000-0001-5126-7854, Bestmann, S. and Yarrow, K. ORCID: 0000-0003-0666-2163 (2019). The Neurodynamic Decision Variable in Human Multi-Alternative Perceptual Choice. Journal of Cognitive Neuroscience, 31(2), pp. 262-277. doi: 10.1162/jocn_a_01347This is the accepted version of the paper.
This version of the publication may differ from the final published
version.
Permanent repository link:
http://openaccess.city.ac.uk/20549/Link to published version
:
http://dx.doi.org/10.1162/jocn_a_01347Copyright and reuse:
City Research Online aims to make research
outputs of City, University of London available to a wider audience.
Copyright and Moral Rights remain with the author(s) and/or copyright
holders. URLs from City Research Online may be freely distributed and
linked to.
City Research Online: http://openaccess.city.ac.uk/ [email protected]
1
The Neurodynamic Decision Variable in Human Multi-Alternative
Perceptual Choice
Carmen Kohl 1,2,*, Laure Spieser 1,2, Bettina Forster 2, Sven Bestmann 3, Kielan Yarrow 2
1
These authors contributed equally
2
Department of Psychology, Cognitive Neuroscience Research Unit,
City, University of London, UK
3
Sobell Department of Motor Neuroscience and Movement Disorders, UCL Institute of Neurology, University
College London, UK
* Correspondence: Carmen Kohl
City, University of London
Northampton Square
London
EC1V 0HB
+44 (0)20 7040 8530
Funding: This work was supported by a Leverhulme Trust Research Project Grant (RPG-2014188).
2
Abstract
The neural dynamics underpinning binary perceptual decisions and their transformation into actions are
well studied, but real-world decisions typically offer more than two response alternatives. How does
decision-related evidence accumulation dynamically influence multiple action representations in
humans? The heightened conservatism required in multiple compared to binary choice scenarios
suggests a mechanism which compensates for increased uncertainty when multiple choices are present
by supressing baseline activity. Here, we tracked action representations using corticospinal excitability
during four and two-choice perceptual decisions, and modelled them using a sequential sampling
framework. We found that the predictions made by leaky competing accumulator models in order to
accommodate multiple choices (i.e. reduced baseline activity to compensate increased uncertainty)
were borne out by dynamic changes in human action representations. This suggests a direct and
continuous influence of interacting evidence accumulators, each favouring a different decision
alternative, on downstream corticospinal excitability during complex choice.
Keywords: accumulator model, Hicks’ law, leaky competing accumulator, motor evoked potentials,
3
Making the right decision quickly is a fundamental evolutionary objective, because being slow, or
being wrong, can be fatal. Most real-world decisions offer several possible responses. Given the
existence of capacity limitations and joint speed and accuracy constraints, how do humans adapt as the
complexity of a decision scenario increases? Hick’s law (Hick, 1952) illustrates how the number of
choice alternatives can profoundly affect the speed of response, but the neurocognitive basis of this
effect has only recently begun to be elucidated (Churchland & Ditterich, 2012).
Many researchers now agree that to make a decision, sensory evidence from the environment is
accumulated over time until it becomes sufficient to trigger a response. This process has been
formalised in models involving sequential sampling (Brown & Heathcote, 2008; Forstmann, Ratcliff, &
Wagenmakers, 2016; Ratcliff & McKoon, 2008; Smith & Ratcliff, 2004; Usher & McClelland, 2001;
but see Thura, Beauregard-Racine, Fradet, & Cisek, 2012; Thura & Cisek, 2016). Such models make
the putative mechanisms underlying changes in behaviour more concrete. For example, the increased
reaction time found when response alternatives proliferate might result from a change in either the
quantity of evidence required to reach a decision, or the rate at which information accumulates.
Behavioural assays help distinguish these accounts, and some models, including the physiologically
plausible leaky competing accumulator (LCA) model (Usher & McClelland, 2001) can account for
multi-alternative decision-making in various settings (Bogacz, Usher, Zhang, & McClelland, 2007;
Brown, Steyvers, & Wagenmakers, 2009; Ditterich, 2010; McMillen & Holmes, 2006; Tsetsos, Usher,
& Chater, 2010; Tsetsos, Usher, & McClelland, 2011). However, only by marrying the quantitative
precision of sequential sampling models with appropriate neurodynamic signals can a biologically
compelling description of complex choice behaviour emerge.
Much of the neural evidence supporting sequential sampling models comes from experiments
using binary choices. For example, single-cell recording in monkeys, a method with sufficient temporal
resolution to track the decision variable, has shown that firing rates of neurons in the lateral
intraparietal area (LIP), but also the frontal eye field (FEF), and the superior colliculus (SC) display
accumulation-to-bound characteristics in two-choice saccadic tasks (Gold & Shadlen, 2000, 2003;
4
2001). In humans, a number of electroencephalographic (EEG) signals have been suggested to reflect
the decision variable, but only in the context of binary decisions (Donner, Siegel, Fries, & Engel, 2009;
O’Connell, Dockree, & Kelly, 2012; Siegel, Engel, & Donner, 2011).
Despite the prevalence of the two-choice task in research settings, some studies have also
investigated the neural dynamics of multi-alternative decision-making, at least in non-human primates.
Seminal work by Basso and Wurtz (1997, 1998) showed that activity of monkey SC neurons decreased
with increased possible targets in a saccadic multi-target task. This finding was explored more
thoroughly and in the context of sequential sampling models by Churchland, Kiani, and Shadlen (2008)
who presented two monkeys with both two and four-choice random dot motion displays. Both kinds of
decision showed the same stereotyped levels of LIP activity at the time of response. However, firing
rates differed at the beginning of the decision-making process, as four-choice decisions showed
reduced firing rates. In sequential sampling models such as the LCA, lower activity in a given
accumulator at the beginning of the decision necessitates larger excursions, i.e., more evidence will be
required to reach a response boundary. Such heightened conservatism in multiple compared to binary
choice scenarios can be interpreted as a mechanism which compensates for increased uncertainty.
Decreased baseline activity has since been supported by a number of single-cell recording
studies (Balan, Oristaglio, Schneider, & Gottlieb, 2008; Cohen, Heitz, Woodman, & Schall, 2009; Lee
& Keller, 2008). Does this result generalise to humans and/or different sensorimotor pathways? Given
that other plausible mechanisms accounting for changes in behaviour with the number of choice
alternatives can be formulated, via either sequential sampling models (e.g. changes in the rate of
evidence accumulation) or alternative perspectives (e.g. Hick’s original information-theoretic account)
this question holds theoretical importance. However, we are not aware of any studies which have
directly investigated dynamic neural correlates of binary vs. multi-choice evidence accumulation in the
human brain.
Here, we address this longstanding question by assessing the impact of multiple alternatives on
the neurodynamic decision variable in humans. Since high temporal resolution data is a prerequisite to
5
two response alternatives, we use transcranial magnetic stimulation (TMS) for this purpose1. TMS
motor evoked potentials (MEPs) can be used to read-out decision-related influences in the primary
motor cortex or adjacent premotor areas (Bestmann et al., 2008; Bestmann & Krakauer, 2015; Hadar,
Makris, & Yarrow, 2012; Hadar, Rowe, Di Costa, Jones, & Yarrow, 2016; Kiers, Fernando, &
Tomkins, 1997). When a decision requires an immediate motor response, motor preparation occurs
continuously throughout the decision-making process (de Lange, Rahnev, Donner, & Lau, 2013;
Duque, Lew, Mazzocchio, Olivier, & Ivry, 2010; Gluth, Rieskamp, & Büchel, 2013; Hadar et al., 2012;
Michelet, Duncan, & Cisek, 2010; Tsetsos, Pfeffer, Jentgens, & Donner, 2015; Thura & Cisek, 2016).
Therefore, the corticospinal excitability that MEPs reflect can be used as a correlate of the decision
variable, and compared directly to the predictions of accumulator models such as the LCA.
By mapping two separate responses, each recruiting a different muscle, to each hand and
measuring the activity of both muscles in the hand contralateral to brain stimulation, we were able to
record MEPs associated with each response separately. Although single-cell recording studies of
decision-making (e.g. Basso & Wurtz, 1997, 1998; Churchland et al., 2008) have typically targeted
regions that are anatomically remote from those interrogated using MEPs, their functional roles for the
generation of saccades may mirror those of the corticospinal tract for manual actions. We therefore
hypothesised that if changes in corticospinal excitability are driven by accumulation-to-bound
dynamics as encapsulated in the LCA model, MEP changes associated with each response would
display typical characteristics of a decision variable. Specifically, we expected the MEPs’ build-up rate
to increase with evidence strength, and their amplitudes to reach a stereotyped level at the time of
response (Hadar et al., 2016; Spieser, Kohl, Forster, Bestmann & Yarrow, 2018). Importantly, beyond
these typical accumulation-to-bound dynamics, we also predicted a reduced amplitude (for potential
responses) when participants prepared a four-choice compared to a two-choice decision, as suggested
by previously observed lower baseline neural firing rates in non-human primates. Note that this was in
no sense inevitable, as there are fundamental differences between single-cell recordings of oculomotor
1 Other physiological signals may also be appropriate for this purpose, for example EMG (Servant, White, Montagnini, &
6
neurons in monkeys and the MEP signals reported here. For example, while simultaneous movements
of both hands are possible, the oculomotor system is restricted to a movement in a single direction at
any given time, which may lead to differences in decision-related neural dynamics. In addressing the
possible generalisation of this result from the monkey oculomotor system to the human corticospinal
tract, we were able, for the first time, to track the decision variable during human multi-alternative
decision-making. We thus distinguish theoretical accounts of Hick’s law at a neurocognitive level, by
demonstrating decreased levels of baseline activity with an increased number of alternatives.
Methods
Participants
We recruited 13 participants (five males) with a mean age of 26.23 (SD = 7.67). Because many TMS
trials must be discarded for unavoidable reasons (see EMG Processing below; c.f. Hadar et al., 2016)
each participant completed between two and four sessions (each lasting 1-3 hours) and completed on
average 4166 trials. Participants were paid £8 per hour. All procedures were approved by the City,
University of London Psychology Department Ethics Committee.
Stimuli, Design and Procedure
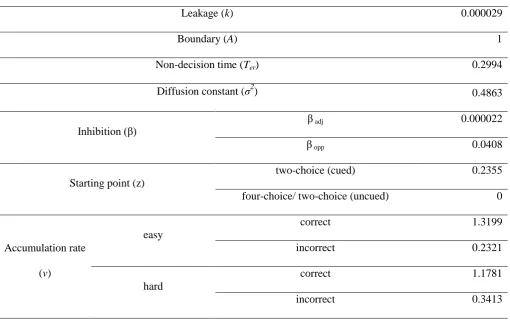
Participants completed a colour-discrimination task. In each trial, an array of coloured pixels appeared.
Arrays consisted of four different colours (green (RGB [0 0.6 0]), red (RGB [0.8 0 0]), yellow (RGB
[0.92 0.74 0]), blue (RGB [0.12 0.12 0.61])). Participants were instructed to indicate which colour was
most prevalent as quickly and as accurately as possible, using the corresponding one of four response
buttons (see Figure 1).
Stimuli were generated using Matlab (The Mathworks, Natick, U.S.A.) and the Psychtoolbox
extension (Brainard, 1997; Kleiner et al., 2007; Pelli, 1997), and presented on a Display++ LCD
monitor (Cambridge Research Systems, Ltd., Rochester, UK, display size: 41 cm x 30 cm) operating at
a refresh rate of 100 Hz and a resolution of 1240 x 786 pixels. Participants sat approximately 100 cm
from the screen. The stimulus array subtended 6 x 6 degrees of visual angle. Each coloured pixel
7
Participants held two digital response buttons interfaced via a 16 bit A/D card (National
Instruments X-series PCIe-6323, sampling rate 100,000 Hz) in each hand, one between thumb and
index finger (pinch), and one against the palm, attached to a plastic cylinder (grasp; Hadar et al., 2012).
Pinching contracted the first dorsal interosseous (FDI) muscle, while grasping the cylinder activated the
abductor digiti minimi (ADM) muscle. Each colour was mapped to one of the four response buttons.
The colour-response mapping was randomised across participants.
Trials consisted of a cue (500 ms), a coloured stimulus array (2000 ms or until response), and an
inter-stimulus interval (minimum 500 ms). The experiment contained both two and four-choice trials.
Additionally, as a positive control, we crossed a manipulation of difficulty with our manipulation of
number of choices in a 2x2 design. Difficulty negatively affects accumulation rate (Mulder, van
Maanen, & Forstmann, 2014; Ratcliff & Rouder, 1998; Teodorescu & Usher, 2013) and this effect has
been demonstrated in MEP signals for two-choice tasks (Hadar et al., 2016; Spieser et al., 2018). To
manipulate task difficulty, the percentage of pixels of the dominant colour varied between 33% (easy)
and 30% (hard). The remaining colours each took up 22% and 23% of the array respectively. The cue
at the beginning of each trial informed participants whether a given trial was a two or a four-choice trial
by presenting either two or four coloured squares representing the possible choices.
One third of trials were four-choice, one third were two-choice ‘within’ hands, i.e. the two
possible responses were on one hand (left pinch - left grasp, right pinch - right grasp), and one third of
trials were two-choice ‘between’ hands, i.e. homologous responses from both hands were possible (left
pinch - right pinch, left grasp - right grasp). Trial order was randomised. Note that the difference
between two and four-choice trials lay solely in the instructions conveyed by the cue – the stimulus
array and the percentage of the four colours did not change. In the first session, participants completed
150 practice trials, to familiarise themselves with the task. Participants then completed between five
and six experimental blocks per session, with each block consisting of 168 trials (plus additional trials
8
Stimulation and Recording
Muscle activity was recorded using surface electromyography (EMG), sampled at 1000 Hz via a 13 bit
A/D Biometrics Datalink system (version 7.5, Biometrics Ltd., Ladysmith, VA, U.S.A., 2008) and
band-pass filtered (20 to 450 Hz). Surface Ag/AgCl electrodes (22 mm x 28 mm, part No. SX230FW,
Biometrics Ltd., Ladysmith, VA) were placed above the first dorsal interosseous (FDI) and abductor
digiti minimi (ADM) of each hand. Reference electrodes were placed approximately 2 cm from each of
the four active electrodes. The EMG signals of the right ADM and FDI were also passed to speakers
placed on the left and right of the participant respectively, with noise informing participants that their
muscles were not fully relaxed between responses.
Single-pulse TMS was applied using a Magstim Rapid2 biphasic stimulator (The Magstim Co.
Ltd., Whitland, UK). To induce motor evoked potentials (MEP) in both the ADM and the FDI of the
right hand, a 70-mm figure-of-eight coil (external casing diameter approximately 90 mm for each loop)
was positioned on the scalp over the left motor cortex. The exact location and stimulation intensity was
adjusted for each participant individually and set at approximately 110% of the resting motor threshold
(RMT). The RMT was defined as the minimal intensity to elicit an MEP with a peak-to-peak amplitude
of approximately 50 μV in 50% of stimulations on both the FDI and ADM of the right hand. TMS
position was continuously tracked and maintained using a neuro-navigation system (Visor 2, ANT
Neuro, The Netherlands).
TMS pulses were planned in 57% of trials from each condition. To ensure a good distribution of
TMS pulses during a baseline interval and over the course of the reaction time, TMS trials were divided
into four equally frequent time bins between -200 and 700 ms relative to the stimulus onset (i.e.
between 300 and 1200 ms relative to cue onset). Within a given bin, the exact stimulation time was
drawn randomly for each trial. Since the experiment followed a single-pulse TMS protocol, pulses were
required to occur at a maximal frequency of 0.2 Hz. If, by chance, a planned inter-pulse interval (IPI)
was less than 5000 ms, timing was adjusted. For IPIs of 4-5000 ms, the inter-trial interval was
increased, decreasing the pulse frequency to 0.2 Hz. For IPIs less than 4000 ms, the planned trial was
9
random stimulation-free trials were generated in order to increase the IPI. On average, this method
added 434 trials per session, yielding an average 1354 trials per session. Planned pulses were not
delivered if a response had already been detected.
EMG Processing
Pre-processing: All EMG processing was performed in Matlab (The Mathworks, Natick, U.S.A.). To
remove potential differences in movement time (between right and left hands, or pinch and grasp
responses), analyses were conducted based on EMG RTs, i.e., the time between stimulus and
responding EMG onset. First, the Teager-Kaiser energy operator (TKEO) was applied to detect the
onset time of muscle activity associated with each response (Li & Aruin, 2005; Li, Zhou, & Aruin,
2007; Solnik, Rider, Steinweg, Devita, & Hortobágyi, 2010). The discrete TKEO ψ for a given EMG
value x of the sample n was defined as:
𝜓[𝑥(𝑛)] = 𝑥2(𝑛) − 𝑥(𝑛 + 1)𝑥(𝑛 − 1) (1)
A threshold (𝑇) identified the onset of muscle activity:
𝑇 = 𝜇 + ℎ𝜎 (2)
With μ and σ representing the baseline mean and standard deviation (-300 to 200 ms relative to cue
onset), and h set to 3. Additionally, all trials were visually inspected and the EMG onset time was
adjusted manually if necessary. Visual inspection provided no information about the experimental
condition of a given trial. Trials with muscular artifacts, no detectable EMG onset, or partial responses
on more than one channel were excluded (6.41% of all recorded trials). We further excluded trials with
button RTs of ≥ 2000 ms or ≤ 180 ms, or EMG RTs of ≥ 1850 ms or ≤ 30 ms (< 1% of all recorded
trials).
In TMS trials, MEP amplitudes in both channels (FDI and ADM) of the right hand were defined
as the maximum minus the minimum EMG value from 10-40 ms after stimulation. Trials with
muscular pre-activation (EMG > 50 μV in the 200 ms period preceding stimulation) were excluded
(4.51% of all trials), as were trials with no visible MEP or in which MEP amplitude was uncertain due
to amplifier saturation (2.02% of all trials). Trials were also excluded if the participant’s response
10
In total, 17.53% of all recorded trials (including 35.38% of TMS trials) were discarded, with a
similar proportion of trials deleted across conditions. After these pre-processing steps 44,669 usable
trials remained (including 13,588 TMS trials). MEP amplitudes were then z-scored per muscle, session,
and participant (but regardless of experimental condition), to normalise their magnitudes. Finally, for
all analyses except our baseline comparison (see below), MEPs amplitude associated with incorrect
trials were discarded, leading to a total of 11,590 remaining TMS trials.
Re-categorisation: The FDI and ADM channels were reclassified into one of four categories. MEPs
from muscles associated with the correct response were classed as ‘Correct’, while MEPs from the
non-responding muscles formed three different error categories, ‘Adjacent Error 1’, ‘Adjacent Error 2’, and
‘Opposite Error’. Note that for MEP data, these labels generally refer to all potential responses within a
given decision, not overt errors (i.e. ‘Opposite Error’ refers to a response which would be incorrect, had
it been made). Figure 1 illustrates these mappings. The response opposite to the ‘Correct’ response,
corresponding to the non-homologous movement on the incorrect hand, was labelled ‘Opposite Error’.
We used ‘Adjacent Error 1’ for responses which were incorrect but on the correct hand in four-choice
trials, or responses which were cued but incorrect in two-choice trials. The remaining responses were
labelled ‘Adjacent Error 2’. Note however, that stimulation provided only two (right-hand) MEPs per
trial which were sorted into two of the four categories.
Collation and Smoothing: For each correct/error category and each condition, MEPs recorded in
correct trials were pooled across participants and sessions. We therefore normalised stimulation times
for each session and participant, expressing them as a percentage of median EMG RT (on
stimulation-free trials). Pooled MEP amplitudes were sorted in time and aligned to both the stimulus and the
response.
To generate continuous signals, MEP amplitudes were then smoothed via a Gaussian kernel:
Ŷ(𝑡) =∑ 𝑒(−
(𝑡−𝑡𝑖)2 2𝜎2 )𝑌𝑖
𝑁 𝑖=1
∑ 𝑒(−(𝑡−𝑡𝑖)
11
Where N is the number of MEPs, each being associated with a magnitude Yi and a time ti. The
smoothed signal was calculated in time steps of 1% median EMG RT, using a smoothing kernel with a
full-width half maximum of 5% median EMG RT.
Statistical Analysis: We report two-tailed p values for all pairwise tests. Differences between
conditions for behavioural data (i.e. RTs, EMG RTs and errors) were inferred using ANOVAs and
generalized linear mixed models (GLMMs) with logistic link functions, respectively. GLMMs were
implemented using the Matlab fitglme command, and all effects of interest (e.g. difficulty, number of
response alternatives and their interaction) were nested within participants and sessions and included as
random effects in the model specifications.
For TMS data, based on previous research in non-human primates (Balan et al., 2008;
Churchland et al., 2008; Cohen et al., 2009), we expected reduced baseline MEP amplitudes when
participants chose between four compared to two alternatives. To test this, we took (for each
participant) the amplitude of all z-scored MEPs recorded during the cue-stimulus interval and
associated with a cued response (i.e., for four-choice trials, all MEPs during the baseline-period, while
for two-choice trials, only MEPs categorised as ‘Correct’ or ‘Adjacent Error 1’). Following translation
and square-root transformation of these scores to achieve normality, the difference across conditions
was tested using a linear mixed model (with random effects for participant) using the Matlab fitlme
command (which, when compared to a traditional t-test performed on averages derived from multiple
trials, better utilises information from all contributing scores). This approach was also applied to an
unforeseen prediction emerging from our modelling, regarding differences in late accumulation profiles
between opposite errors and other (i.e. adjacent) categories of error.
We also expected the MEP signal to be affected by task difficulty, with steeper accumulation
for ‘easy’ than ‘hard’ trials. Under sequential sampling models with multiple accumulators, the
difference in their accumulation rates is a key determinant of behaviour. Hence we focussed on trials in
which two MEPs from a single hand could be used to construct a signal measuring the difference
between ‘Correct’ and ‘Adjacent Error 1’ responses, a signal which has previously been shown to
two-12
choice-within-hand trials, we fitted a straight line to the MEP signals derived from this difference. We
term the gradient of this line a relativized slope. We did this for both ‘easy’ and ‘hard’ trials, then
subtracted the relativized slope for ‘hard’ trials from the slope associated with ‘easy’ trials. These
estimates were made for stimulus-locked data, between 50% and 90% median EMG RT, and
response-locked data, between -50% and -10% median EMG RT. We used non-parametric permutation tests
with 1999 iterations to generate new sets of resampled ‘easy’ and ‘hard’ conditions (without
replacement) and calculated the relativized slope difference between them. In each test, the original
difference was compared to the resulting null distribution of differences. Note that because these
permutation tests were performed on a collated set of trials from all participants, the statistical
generalisation is to a sampling distribution based on all possible trials from our particular set of
participants, rather than one based on all possible participants.
Modelling
We used the LCA model to fit the behavioural data (Usher & McClelland, 2001). The LCA is a race
accumulator model and therefore easily extended to more than two alternatives. Accumulation traces
are defined by an accumulation rate v plus noise, and race towards a decision boundary A. The LCA is
designed to explain the accumulation process in a more neurophysiologically plausible way than other
models within this framework. To this end, it includes a leakage parameter k as well as a parameter β
for mutual inhibition between accumulators. Thus, in a binary decision involving the accumulators m
and n, the change in activation in accumulator m is given by:
𝑑𝑥𝑚 ∝ 𝑣𝑚− 𝑘𝑥𝑚− 𝛽𝑥𝑛+ 𝑁(0, 𝜎2) (4)
Where v is the input into the accumulator and N(0,σ2) is normally distributed noise with zero mean and
a standard deviation σ. Additionally, the accumulation process is forced to remain positive:
𝑥𝑚(𝑡 + 1) = max (0, 𝑥𝑚(𝑡) + 𝑑𝑥𝑚) (5)
RT is made up of the time required to reach the boundary A, and a non-decision time Ter, which
13
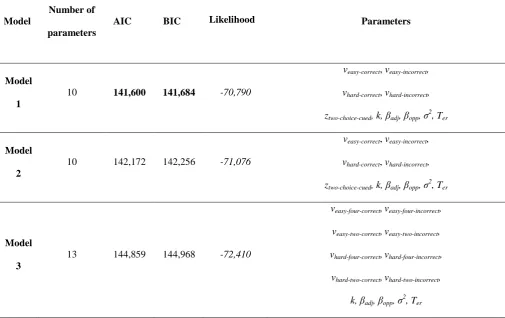
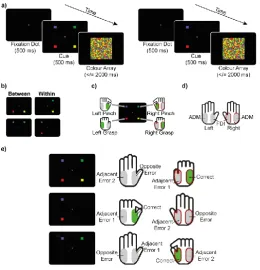
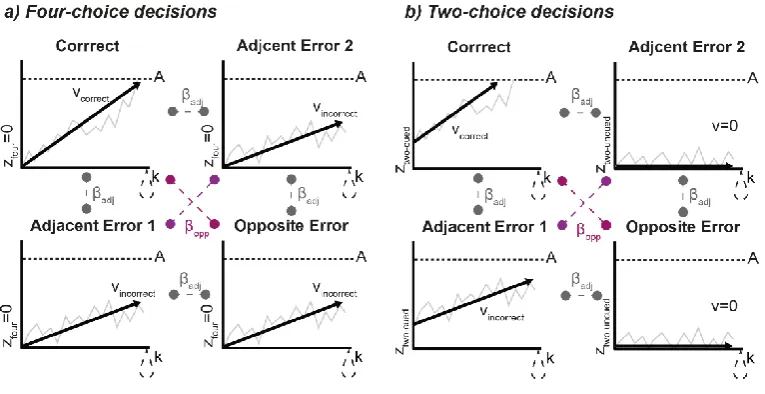
Model Fit: We tested three LCA models (see Table 1). In Model 1, we extended the model to include
four accumulators. In a four-choice trial, the accumulation rate of the correct accumulator was given by
vcorrect, while accumulation rate for all other accumulators was given by vincorrect. The starting point z
four-choice was set to 0, and along with the threshold A and the leakage k, equal across accumulators. Two parameters, βadj and βopp, captured inhibition between accumulators. Inhibition parameters reflected the
anatomical adjacency of responses. Specifically, βopp describes the inhibition induced by the evidence
associated with the opposite response and opposite hand relative to a given accumulator, while
inhibition between all other accumulators is given by βadj(see Figure 2). This means that the change in
accumulation for each accumulator is given by:
𝑑𝑥𝐶𝑜𝑟𝑟𝑒𝑐𝑡 ∝ 𝑣𝐶𝑜𝑟𝑟𝑒𝑐𝑡− 𝑘𝑥𝐶𝑜𝑟𝑟𝑒𝑐𝑡− 𝛽𝑎𝑑𝑗𝑥𝐴𝑑𝑗.𝐸𝑟𝑟1− 𝛽𝑎𝑑𝑗𝑥𝐴𝑑𝑗.𝐸𝑟𝑟2 − 𝛽𝑜𝑝𝑝𝑥𝑂𝑝𝑝.𝐸𝑟𝑟+ 𝑁(0, 𝜎2)
𝑑𝑥𝐴𝑑𝑗.𝐸𝑟𝑟1∝ 𝑣𝐴𝑑𝑗.𝐸𝑟𝑟1− 𝑘𝑥𝐴𝑑𝑗.𝐸𝑟𝑟1− 𝛽𝑎𝑑𝑗𝑥𝐶𝑜𝑟𝑟𝑒𝑐𝑡− 𝛽𝑎𝑑𝑗𝑥𝑂𝑝𝑝.𝐸𝑟𝑟 − 𝛽𝑜𝑝𝑝𝑥𝐴𝑑𝑗.𝐸𝑟𝑟2+ 𝑁(0, 𝜎2)
𝑑𝑥𝐴𝑑𝑗.𝐸𝑟𝑟2∝ 𝑣𝐴𝑑𝑗.𝐸𝑟𝑟2− 𝑘𝑥𝐴𝑑𝑗.𝐸𝑟𝑟2− 𝛽𝑎𝑑𝑗𝑥𝐶𝑜𝑟𝑟𝑒𝑐𝑡− 𝛽𝑎𝑑𝑗𝑥𝑂𝑝𝑝.𝐸𝑟𝑟 − 𝛽𝑜𝑝𝑝𝑥𝐴𝑑𝑗.𝐸𝑟𝑟1+ 𝑁(0, 𝜎2)
𝑑𝑥𝑂𝑝𝑝.𝐸𝑟𝑟3∝ 𝑣𝑂𝑝𝑝.𝐸𝑟𝑟− 𝑘𝑥𝑂𝑝𝑝.𝐸𝑟𝑟− 𝛽𝑎𝑑𝑗𝑥𝐴𝑑𝑗.𝐸𝑟𝑟1− 𝛽𝑎𝑑𝑗𝑥𝐴𝑑𝑗.𝐸𝑟𝑟2 − 𝛽𝑜𝑝𝑝𝑥𝐶𝑜𝑟𝑟𝑒𝑐𝑡+ 𝑁(0, 𝜎2)
(6)
In two-choice decisions the same four-accumulator structure was used with the following
exceptions. Based on previously demonstrated baseline differences (e.g. Churchland et al., 2008),
accumulators associated with the cued responses (‘Correct’ and ‘Adjacent Error 1’) began at a starting
point defined by ztwo-choice-cued, while the starting point of the other two accumulators (‘Adjacent Error 2’
and ‘Opposite Error’) ztwo-choice-uncued was set to 0. The accumulation rate of the two accumulators
associated with the non-cued responses (‘Adjacent Error 2’ and ‘Opposite Error’), was also set to 0, so
that only noise was accumulated.
Lastly, the drift rates vcorrrectand vincorrectvaried across difficulty levels,yielding in total 10 free
parameters (veasy-correct, veasy-incorrect, vhard-correct, vhard-incorrect, ztwo-choice-cued, k, βadj, βopp, σ2, Ter). The
boundary parameter A was set to 1 as a scaling parameter. Model 1 is schematized in Figure 2.
By setting the accumulation rate of the non-cued accumulators to 0 in Model 1, we assumed
early attentional selection, gating the signal at a sensory level. Since this is speculative, we also tested a
14
uncued accumulators in two-choice conditions (‘Adjacent Error 2’ and ‘Opposite Error’) were not set
to 0, but instead to the same vincorrect as ‘Adjacent Error 1’. Hence this model had the same 10 free
parameters as Model 1.
Finally, we also tested a model with no baseline difference between two-choice and four-choice
conditions, but which introduced a difference in accumulation rate instead. Hence Model 3 is identical
to Model 1 with the exception that the starting point is set to 0 for all conditions, and that two-choice
and four-choice conditions have separate correct and incorrect drift rates (veasy-four-correct,veasy-four-incorrect,
veasy-two-correct,veasy-two-incorrect, vhard-four-correct,vhard-four-incorrect,vhard-two-correct,vhard-two-incorrect). Like Model 1,
accumulation rates in uncued accumulators were set to 0. This resulted in a total of 13 free parameters
for Model 3 (veasy-four-correct,veasy-four-incorrect,veasy-two-correct,veasy-two-incorrect, vhard-four-correct,vhard-four-incorrect,
vhard-two-correct,vhard-two-incorrect, k, βadj, βopp, σ2, Ter).
Note that we did not test a model with varying decision boundaries, a variation which is
commonly used (e.g. Brown & Heathcote, 2008). In fact, sequential sampling models are unable to
distinguish between variations in starting points, variations in boundaries, or a combination of both
based on model fits alone (Bogacz, Wagenmakers, Forstmann, & Nieuwenhuis, 2010). Hence we tested
only one of these accounts and, in accordance with suggestions made in the literature (Balan et al.,
2008; Basso & Wurtz, 1997, 1998; Churchland et al., 2008), chose a variation in baseline (Model 1/2)
to model differences in accumulation excursion between binary and multiple choice alternatives.
To fit each model, normalised EMG RTs from stimulation-free trials were pooled across
participants to estimate the model parameters at the group level. A total of 20,000 simulated EMG RTs
were compared to the empirical data using Quantile Maximum Probability Estimation (Heathcote,
Brown, & Mewhort, 2002) and parameter values were adjusted using a differential evolution algorithm
implemented in Matlab (The Mathworks, Natick, U.S.A.; Price et al., 2005).
The three models were compared by calculating two measures of goodness-of-fit which
consider both likelihood and the number of free parameters, namely the Bayesian information criterion
(BIC, Schwarz, 1978) and the Akaike information criterion (AIC; Akaike, 1977). The best fitting
15
Predicted Neurodynamics: We simulated 20,000 accumulation paths for each condition, based on
best-fitting parameter values obtained for the model showing the best goodness-of-fit to behavioural data.
Since we fitted using EMG RTs rather than button RTs (i.e. time to move effectors was not included)
we assumed that virtually all of the estimated non-decision time described sensory processes. We
therefore started the accumulation profile after a sensory delay given by Ter.
MEPs were simulated as the amplitude of a given accumulator at random MEP latencies. Just as
in the experimental data, only simulated MEPs that occurred before the decision boundary was reached
were retained. The timing of simulated MEPs associated with correct decisions was then expressed
relative to both stimulus and response, and MEPs were smoothed to create simulated continuous MEP
signals.
Results
We explored multi-alternative decision-making in humans by utilising MEP signals as a correlate of the
decision variable. Since we were a priori uncertain about how anatomical proximity of responses would
affect decision-making, our design initially distinguished two sub-conditions of two-choice trials,
depending on whether cued responses were contained within or spread between hands (Figure 1 b).
However, since we found no behavioural or neural evidence to suggest that they should be treated
separately, we pooled two-choice data for most of our analyses.
Our approach tracked the evolution of preparation for each of up to four response alternatives,
which we categorised as ‘Correct’, ‘Adjacent Error 1’, ‘Adjacent Error 2’, and ‘Opposite Error’ (see
Methods and Figure 1). We used an LCA model with four accumulators categorised in the same way to
model behavioural data and predict the accumulation profile of each accumulator. We were thus able
not only to describe neurodynamic decision variables with four or two response alternatives, but also to
16
Behaviour for two-choice and four-choice decisions follows Hick’s law and
reflects choice difficulty
Since the application of TMS pulses can alter response times (Day et al., 1989), only stimulation-free
trials remaining after pre-processing of electromyography (EMG) were used for behavioural analyses.
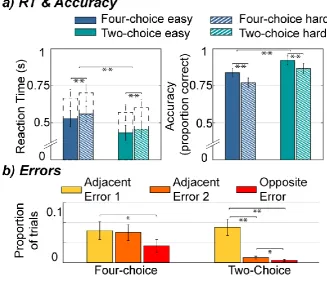
Figure 3 shows mean behavioural results obtained in each condition. For these analyses, which did not
rely on pooling of data across participants (unlike subsequent analyses of the decision variable), we
report raw, non-normalised response times. The effects of ‘Number of Alternatives’ and ‘Difficulty’ on
correct EMG RT were tested with a 2x2 repeated-measures ANOVA. EMG RTs were longer for
decisions with four alternatives than decisions with two alternatives, F(1, 12) = 207.10, p < .001, ηp2 =
.95. Also, harder decisions were slower than easy ones, F(1, 12) = 117.37, p < .001, ηp2 = .91. There
was no significant interaction between the two factors (p = .68). The same analysis with button RT as
time of response led to qualitatively identical results (main effect of ‘Number of Alternatives’: p <
.001, main effect of ‘Difficulty’: p < .001, interaction effect: p = .76). These results are consistent with
Hick’s law.
Error data are known to violate the assumptions of ANOVA. We therefore instead applied
generalised linear mixed-effects models for statistical inference, which revealed significantly lower
accuracy in four-choice compared to two-choice trials, t(156) = 5.59, p < .001, and in hard compared to
easy trials, t(156) = 9.68, p < .001, with no interaction (p = .052). These results demonstrate that our
RT findings do not represent a speed/accuracy tradeoff: Participants were both slower and less accurate
in four-choice (and hard) trials. Additionally, we compared the proportions of errors arising in the
different possible erroneous response categories (Figure 3 b). In two-choice trials, the three categories
differed significantly from each other, t(117) > 2.58, p < .01, with most errors in the ‘Adjacent Error 1’
category, and least ‘Opposite’ errors. In four-choice trials, ‘Opposite’ errors were less frequent,
although only ‘Adjacent Error 1’ and ‘Opposite Error’ categories differed significantly, t(117) = 2.27, p
= .03. These results indicate that both of the cued responses were prioritised in two-choice trials, and
17
Corticospinal excitability reflects the accumulation of evidence and is reduced at
baseline with four compared to two choices
When analysing corticospinal excitability, we generally focused on trials in which the correct response
was ultimately executed (as we had insufficient overt error trials to yield reliable signals). Smoothed
signals were generated using MEPs from muscles associated with each potential response category.
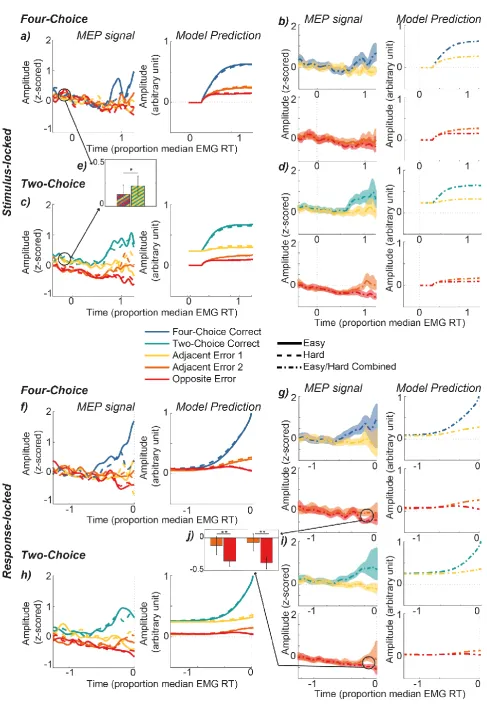
The resulting signals are displayed in Figure 4, locked to both the stimulus (upper panels) and the
response (lower panels). Following an initial ubiquitous negative drift, in each condition corticospinal
excitability associated with the correct response increased as expected over the course of the decision to
reach a higher magnitude than all other potential responses, while the ‘Opposite Error’ response
showed the lowest amplitude.
Contrary to our expectations, there was little difference between ‘easy’ (solid lines) and ‘hard’
(dashed lines) trials in any of the conditions. There were, however, marked differences between
four-choice and two-four-choice decisions. In the four-four-choice condition, ‘Adjacent Error 1’ (same hand but
different action relative to the responding muscle) and ‘Adjacent Error 2’ (other hand but homologous
action) traces followed a virtually identical profile of corticospinal excitability. In two-choice trials on
the other hand, the two cued responses (‘Correct’ and ‘Adjacent Error 1’) are separated from the
uncued response traces (‘Adjacent Error 2’ and ‘Opposite Error’) throughout the beginning of the trial
(note that the cue onset is prior to the onset of MEP recording). Only towards the end of the decision,
presumably when the (time-lagged) process driving selection of the correct response begins to feed
continuously into motor cortex, does the ‘Correct’ response increase at a steeper rate relative to the
‘Adjacent Error 1’ response.
To test our hypothesis predicting lower baseline activity in four compared to (cued) two-choice
decisions, we compared MEP amplitudes during the cue-stimulus interval (-200 to 0 ms relative to the
stimulus onset; equivalent to 300 to 500 ms relative to cue onset). We applied a linear mixed-effects
model, which confirmed our hypothesis, revealing significantly reduced MEP amplitudes in four
18
Additionally, we tested the difference in relativized slopes (i.e. correct minus error
accumulation rates) between different difficulty levels (for both four-choice and
two-choice-within-hand trials; solid vs. dashed lines in Figure 4) using a permutation procedure (see Methods). This
analysis focussed on the final half of the RT period, when differential evidence accumulation between
potential responses was observable in corticospinal excitability traces. The empirical slope difference
between ‘easy’ and ‘hard’ trials did not exceed the upper/lower 2.5% of their bespoke null
distributions, for either stimulus-locked or response-locked MEPs, with either four or two choices.
Hence, contrary to our prediction and to previous evidence (e.g. Spieser et al., 2018), there was no
easy/hard slope difference (p > .05). To the extent that MEP signals do appear to diverge between easy
and hard conditions (e.g. late on during four-choice trials) this divergence is uninterpretable due to high
levels of sampling noise.
However, to further explore this unexpected finding, we compared the difference in relativized
slopes between fast and slow responses by performing a median split on the data. We then used the
same permutation method previously applied to test the difference in slope between ‘easy’ and ‘hard’
trials to instead compare slopes of slow and fast trials. We found that slopes in fast trials were
significantly higher than slopes in slow trials (for both four-choice and two-choice-within-hand trials),
albeit only in the stimulus-locked signal (p < .05), showing that when responses were quicker,
corticospinal excitability accumulation was steeper.
Behavioural Modelling suggests a competitive accumulation process in which
changes in baseline-to-boundary distance generate Hick’s law
To examine whether accumulation-to-bound models can provide a compelling neurocognitive account
of Hick’s law, we first fitted a sequential sampling model to the behavioural data. Both the overall
parameterisation of such a model, selected via model comparison procedures, and the specific changes
observed in the resulting parameters across experimental conditions, provide insights into the processes
that drive behavioural effects. Here, we used the LCA model (Usher & McClelland, 2001), which lends
19
We fitted three LCA model variants to the EMG RT data, all of which included four
accumulators and assumed that accumulation rate varied between easy and hard trials. They also
assumed the existence of inhibition between accumulators, defined by two inhibition parameters (based
on the anatomical adjacency of responses). Our best-fitting model (Model 1 in Table 1, with 10 free
parameters) additionally assumed the same accumulation rate in four and two-choice trials, but a
difference in starting point. Hence this model instantiates an account of Hick’s law in which
baseline-to-boundary distance drives behavioural changes as the number of alternatives increases. For this
model, accumulation rates of uncued accumulators in two-choice trials were set to zero.
As seen in Table 1, varying model assumptions in other a priori plausible ways (by assuming
either non-gated evidence accumulation in uncued accumulators – Model 2, 10 parameters – or
different accumulation rates in four and two-choice trials – Model 3, 13 parameters) did not improve
the goodness-of-fit, as indexed by the Bayesian and Akaike information criteria (BIC/AIC). Because
these different model variants capture alternative accounts of Hick’s law (in particular, for Model 3, a
different rate of evidence accumulation generates differences in RT and errors) this suggests that
introducing multiple alternatives into a decision-making process primarily affects the
baseline-to-boundary distance of the accumulation process, with a lower starting point in four compared to
two-choice decisions. We therefore proceeded using Model 1 (schematised in Figure 2), for which
parameter estimates are displayed in Table 2. Notice how the starting point of accumulation (parameter
z)is higher in two-choice cued conditions compared to other conditions. The best-fitting model also
suggests greater inhibition (β) between opposite responses than between adjacent ones, and higher
accumulation rates (v) in easy compared to difficult conditions.
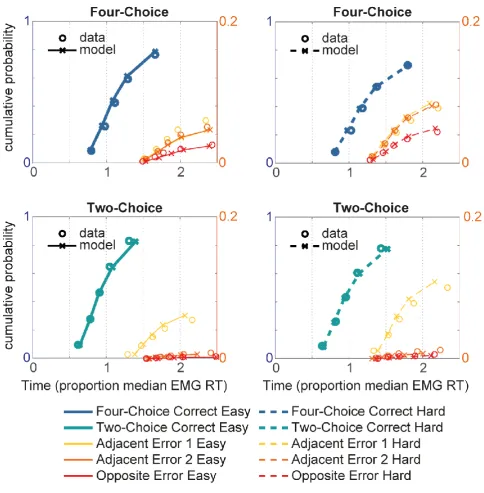
The quality of the fit is shown in Figure 5 (left: four-choice; right: two-choice; top: easy;
bottom: hard). The observed (circles) and simulated (lines and crosses) normalised EMG RT
distributions are summarised by five quantile estimates (from left to right: 10%, 30%, 50%, 70%,
90%), and the EMG RT (x-axis) and proportion of data (y-axis) associated with each quantile are
displayed. Both correct responses (thick lines) and responses in each error category are shown, with the
20
a good overall model fit: The model successfully predicted the complete RT distributions of both
correct and erroneous responses. The mean absolute difference between predicted and recorded EMG
RT quantiles was approximately 2.5% of median EMG RT for correct responses, confirming that the
LCA was able to account for both four and two-choice decisions.
Neurodynamic LCA model predictions capture both expected and unexpected
features of corticospinal excitability
To be compelling from a neuroscientific perspective, a model should describe both behaviour and its
neural substrate, and be able to account for observed features of data that cannot easily be predicted
otherwise. Hence we went on to use the estimated parameters derived from our behavioural modelling
to simulate average accumulation profiles for each condition. Figure 4 displays the resulting
stimulus-locked (upper panels) and response-stimulus-locked (lower panels) predictions for each condition and each
accumulator. Note, however, that the predictions have not been fitted to the MEP signal data – they
depend instead on fits to the behavioural data, with model selection and parameter estimates based only
on those data.
Important qualitative similarities emerged between the MEP signals and the model predictions
(Figure 4). Like the MEP signals, LCA ‘Correct’ accumulation profiles increase to dominate all other
accumulators over the course of the decision in all conditions, while the ‘Opposite Error’ accumulator
shows the lowest amplitude throughout. Furthermore, in four-choice conditions, the accumulators
associated with ‘Adjacent Error 1’ and ‘Adjacent Error 2’ display a virtually identical profile, while in
two-choice conditions, the cued accumulators (‘Correct’ and ‘Adjacent Error 1’) show a higher
activation than the uncued accumulators (‘Adjacent Error 2’ and ‘Opposite Error’). Contrary to our
initial hypotheses, but in complete agreement with our neural data, there was no clear difference
between ‘easy’ and ‘hard’ predicted accumulation profiles.
Given this surprising failure to observe differences between easy and hard conditions, we
explored how large a difference between conditions is necessary to result in a visible slope difference.
21
accumulation rates. By simultaneously increasing/decreasing the easy/hard accumulation rates
respectively by varying percentages, while keeping all other parameters the same, and visually
inspecting the resulting accumulation profiles, we found that slope differences between easy and hard
accumulation paths became visible when they were around 2.5 times higher than the empirically
observed differences. This increased difference in accumulation rates resulted in simulated reaction
time differences which were three times as large as those in the original simulation (e.g. in four-choice
correct simulations, the original difference between easy and hard trials was .06 median EMG RT,
while the increased difference was .20 median EMG RT).
Additionally, modelling suggested an amplitude difference between the accumulators associated
with ‘Adjacent Error 2’ and ‘Opposite Error’, which was most pronounced towards the end of the
accumulation process. Hence this modelling step led us to revisit our neural data with an additional
prediction. To quantify this effect in the neural data, we compared MEPs from the last quarter of the
EMG RT period, by applying a linear mixed-effects model (see Statistical Analysis). The results
confirmed the amplitude difference between ‘Adjacent Error 2’ and ‘Opposite Error’ in both four
(t(462) > 4.59, p <.001) and two-choice (t(881) > 4.089, p <.001) conditions, further illustrating the
similarity between predicted accumulation profiles and MEP signals (see Figure 4).
Discussion
Hick’s law (Hick, 1952) describes how RT increases with the number of stimulus-response alternatives,
and was initially believed to reflect the rate of information transmission in choice scenarios. However,
sequential sampling models like the leaky competing accumulator model (Usher & McClelland, 2001),
which have recently been extended to account for neurodynamic data, provide a useful interpretative
lens through which to pinpoint the neurocognitive mechanisms that generate such behavioural
adaptations. Slower responses might arise from a decreased rate of information accrual, or from a
requirement for stronger evidence in the face of greater intrinsic uncertainty. In line with the latter
suggestion, previous work has demonstrated that more choice alternatives translate into a lower
22
et al., 2008). Here we tested the proposal that such decision-related changes in neuronal activity
directly influence action representations in the human brain at the level of motor cortex and the spinal
cord. To this end, participants completed a colour-discrimination task with either four or two choices,
while we tracked the dynamics of corticospinal excitability for all four possible responses. We found
that during perceptual decisions, action representations are continuously updated from a baseline level
that varies with task demands, as if dynamically shaped by a competitive accumulation process that
trades speed for accuracy as uncertainty increases.
Behaviourally, responses were slower and less accurate with four-choices compared to
two-choices (Brown et al., 2009; Cohen et al., 2009; Hick, 1952). These findings indicate that although the
stimulus did not change, and the manipulation was implemented only by the cue, the four vs
two-choice manipulation had a significant impact on participants’ decision-making. Additionally,
categorizing error responses in two-choice trials revealed that the cued but incorrect response occurred
more often than any other error, while in four-choice trials, errors corresponding to responses sharing
some anatomical linkage with the correct response were roughly equal in frequency. Hence, the
complexity of the choice scenario affected not only overall response times and accuracy, but also the
specifics of response selection on incorrect trials.
Because it is difficult to intuit the predictions of complex multi-parameter models, we fitted a
sequential sampling model to the behavioural data in order to simulate evidence accumulation profiles
and then compare them to recorded MEP signals, choosing the LCA model for this purpose (Usher &
McClelland, 2001). The LCA is an extension of a simple race accumulator model, but includes leakage
and inhibition parameters to model a more neurophysiologically plausible accumulation. This relatively
complex model was chosen because it is easily extended to any number of choice alternatives (Smith &
Ratcliff, 2004; Usher & McClelland, 2001), and has been shown to adequately account for
multi-alternative decision-making in a number of previous studies (Bogacz et al., 2007; Ditterich, 2010;
McMillen & Holmes, 2006; Tsetsos et al., 2010, 2011). In particular, the inhibition between
accumulators appears a necessary model characteristic in order to explain the behaviours associated
23
errors). By incorporating two inhibition parameters, varying the degree of lateral inhibition between
responses, the model accounted for behavioural data involving complex anatomical linkages between
effectors. Whether the lower value of the inhibition parameter between ‘adjacent’ responses actually
reflects less lateral inhibition, or a stronger co-activation of responses associated to contiguous stimuli,
remains to be elucidated. Other models exist with broadly similar architectures (e.g. multi-alternative
decision field theory; Roe, Busemeyer, & Townsend, 2001) and are likely to provide similarly plausible
accounts of our data.
We tested three different LCA models. Importantly, the best-fitting model utilised a higher
starting point in two-choice than four-choice trials. This model outperformed a variant in which Hick’s
law was instead implemented via changes in the rate of evidence accrual, thereby confirming that RT
and accuracy differences between four and two-choice decisions could arise from reduced baseline
activity in multi-alternative choices. Note that we did not test a model which varied in decision
boundary rather than starting point. Since these two accounts both affect the excursion of accumulation,
they lead to mathematically equivalent RT predictions, and could only be distinguished based on neural
results. Because previous results (e.g. Churchland et al., 2008) have shown a difference in baseline
activity, we focussed on testing that account.
Specifically, our modelling implied that action representations should evolve dynamically from
differing baseline levels during decision-making. We assessed this by using TMS to induce MEPs in
right-hand muscles at random times throughout the trial. By pooling data across participants and
smoothing the resulting data points, we constructed an MEP signal for each response category
separately (Hadar et al., 2016; Klein-Flügge & Bestmann, 2012; Klein-Flügge, Nobbs, Pitcher, &
Bestmann, 2013). Here, the response categories refer to potential responses within a given correct
decision, rather than overt errors (i.e. ‘Opposite Error’ refers to a response which would have been
incorrect, had it been made). In fact, the labour-intensive nature of the MEP signal, as well as high
accuracy rates (~ 80%) meant we were unable to generate MEP signals associated with overt errors.
The resulting MEP signal reflects corticospinal excitability and has previously been associated
24
humans, neural correlates of decision-making produce a single waveform per decision, reflecting either
a difference or sum of the hypothetical underlying accumulators (e.g. de Lange et al., 2013; Donner et
al., 2009; Kelly & O’Connell, 2013). However, here, tracking each of the four potential responses
allowed us to estimate each of the four associated accumulators and thereby provide a richer insight
into the decision process than a single summary signal could provide.
To our knowledge, this is the first description of a temporally precise neural correlate of the
decision variable for multi-alternative vs binary decision-making in humans. For comparison, estimated
model parameters were used to simulate accumulation profiles under the LCA model. Crucially, the
resulting profiles were qualitatively similar to those of the measured MEP signals, despite the fact that
they were predicted from categorically distinct (behavioural) data. In line with our hypotheses, we
found a significant baseline difference between four and (cued) two-choice corticospinal excitability.
Subsequently, the ‘Correct’ MEP trace increased throughout the trial and peaked at the response,
clearly separated from profiles associated with erroneous responses. Although the clear baseline
difference suggests that this is the main mechanism driving changes in RT, it is possible that
accumulation excursion is additionally enhanced by a subtle boundary variation, which our method,
which inevitably yields less usable MEPs and thus less certainty towards the end of the trial, was less
well suited to detect.
We also observed a difference in the trajectories of the potential but erroneous responses
between four and two-choice decisions, just as our behavioural modelling predicted. There was no
observable difference between potential errors made with the same hand and those made with the
homologous effector but the wrong hand in four-choice trials, or, in fact, any of the profiles during the
first half of the trial. However, there was a clear separation in two-choice trials, where cued responses
showed a higher amplitude than uncued responses throughout the trial. This enhanced activation of the
erroneous but cued response affected behaviour, specifically the frequencies with which different
categories of error were observed. Similarly, in four-choice trials, responses anatomically linked to the
correct alternative showed the greatest activation in the second half of the RT period, with a corollary
25
The results described so far were broadly as hypothesised (although we did not make a specific
a priori hypothesis regarding our different categories of error). However, model predictions also
converged with the MEP signal in surprising ways. Contrary to our prediction, both showed little
difference between easy and hard accumulation profiles (beyond that attributable to sampling noise).
Previous research has shown that manipulations of difficulty typically affect evidence accumulation
(Ho et al., 2009; Ratcliff & McKoon, 2008), as well as associated neural signals (Kelly & O’Connell,
2013; Roitman & Shadlen, 2002), including smoothed MEP signals like the ones used here (Hadar et
al., 2016; Spieser et al., 2018). Moreover, modelled accumulation rates were free to vary in each
difficulty condition, and indeed suggested that RT differences reflected such variation, with higher
slopes for easier decisions. However, the difference did not produce distinct predicted accumulation
profiles. This surprising result removes a possible objection regarding the putative role of the MEP
signal as an accumulation signal, as, counterintuitively, it showed the very pattern predicted by the
model. This convergence is likely explained by a relatively weak manipulation of difficultly. Indeed,
even though easy decisions were significantly faster, the effect was small (< 50 ms), probably because
the dominant colour in the easy condition took up just 33% of the display, compared to 30% in the hard
condition. In fact, similar studies which reported marked slope differences between difficulty
conditions also reported much larger reaction time differences (around 150 ms), translating into larger
differences in accumulation value (Spieser et al., 2018), suggesting that larger differences in evidence
strength are needed to detect a visible difference in build-up rate. A post-hoc analysis confirmed that
while there was no slope difference between easy and hard waveforms, fast decisions were associated
with higher slopes than slow decisions, at least in the stimulus-locked signal, supporting the role of the
MEP as a correlate of accumulation.
Our modelling constrained non-cued alternatives in two-choice trials to have an accumulation
rate of zero, implying that attentional mechanisms gate the evidence at a sensory level, before
accumulation occurs (Wyart, Myers, & Summerfield, 2015). This model assumption, implemented only
because it provided the best behavioural fit, was again supported by our MEP results, which displayed
26
fact that each stimulus contained all four colours, and the response options were determined by
pre-stimulus cues alone. This finding is in line with previous research demonstrating that a different neural
correlate of accumulation, the centroparietal positivity, only displays a build-up if the sensory evidence
provided is directly relevant to the decision (O’Connell et al., 2012).
Despite the similarities we have outlined, there were also some marked differences between
predicted and recorded accumulation signals. For instance, the slow negative drift visible in all MEP
signals (Figure 4) may reflect broad inhibition processes described during action preparation, resulting
in MEP suppression in both responding and non-responding muscles (for a review see Duque,
Greenhouse, Labruna, & Ivry, 2017). Naturally, such non-selective MEP modulation was not
reproduced in the model predictions. Additionally, the neural data seem to suggest not only a higher
baseline for cued responses but also a small simultaneous suppression of uncued responses, which may
be an interesting addition to the model. A further slight difference between neural dynamics and model
predictions (and indeed characteristics commonly associated with accumulation) relates to the reaching
of a stereotyped amplitude at the time of response, which, although not directly tested here, is not
clearly visible in the neural data.
At least two reasons might underlie these discrepancies. Firstly, a direct comparison of the
model prediction to the data is limited by the quality and nature of the MEP signal. While a signal
based on differences in MEP size between a responding and non-responding muscle is likely to be a
relatively true reflection of decision processes underlying response selection, an MEP signal displaying
each response separately, as utilised here, will also contain non-specific influences, such as motor-level
processes. Secondly, like any model, the LCA can, at best, be an approximation of the true
decision-making process. Importantly, sampling models provide a solid theoretical framework to analyse and
interpret decision-related neural activity. However, observed dissimilarities at the decision-variable
level illustrate how models describe a simplified decision process which does not always relate in a
straightforward manner with the underlying neural dynamics (Purcell & Palmeri, 2017).
In summary, we have demonstrated that multi-alternative decision-making in humans can be
27
corticospinal excitability provide a downstream reflection of the accumulation process. Under a
sequential sampling modelling framework, higher RTs with increasing numbers of alternatives can be
explained by a greater distance between the starting point of accumulation and the response boundary.
This affects the signal-to-noise ratio, because larger baseline-to-bound distances require more evidence
to be accumulated (Churchland & Ditterich, 2012; Churchland et al., 2008; Usher & McClelland,
2001). In four-choice decisions, which increase uncertainty relative to two-choice decisions, an
increase in the baseline-to-bound distance would compensate for this uncertainty at the expense of
reaction time. Here, we have validated this prediction in human decision-making actuated via the
corticospinal tract, showing for the first time that the number of choice alternatives in a
decision-making task affects the baseline activity of neural accumulation, just as sequential sampling models
predict. Furthermore, we have shown that MEP signals can be used to track the evolution of
preparation for each of four responses separately, giving insight into each of the four associated
accumulators of a sequential sampling model.
References
Akaike, H. (1977). On entropy maximization principle. In P. R. Krishnaiah (Ed.), Applications of
Statistics (pp. 27–41). Amsterdam.
Balan, P. F., Oristaglio, J., Schneider, D. M., & Gottlieb, J. (2008). Neuronal correlates of the set-size
effect in monkey lateral intraparietal area. PLoS Biology, 6, 1443–58.
Basso, M. A., & Wurtz, R. H. (1997). Modulation of neuronal activity by target uncertainty. Nature,
389, 66–69.
Basso, M. A., & Wurtz, R. H. (1998). Modulation of neuronal activity in superior colliculus by changes
in target probability. Journal of Neuroscience, 18, 7519–34.
Bestmann, S., Harrison, L. M., Blankenburg, F., Mars, R. B., Haggard, P., Friston, K. J., & Rothwell, J.
C. (2008). Influence of Uncertainty and Surprise on Human Corticospinal Excitability during
Preparation for Action. Current Biology, 18, 775–80.
28
understanding behaviour. Experimental Brain Research, 233, 679–89.
Bogacz, R., Usher, M., Zhang, J., & McClelland, J. L. (2007). Extending a biologically inspired model
of choice: multi-alternatives, nonlinearity and value-based multidimensional choice. Philosophical
Transactions of the Royal Society B: Biological Sciences, 362, 1655–1670.
Bogacz, R., Wagenmakers, E. J., Forstmann, B. U., & Nieuwenhuis, S. (2010). The neural basis of the
speed-accuracy tradeoff. Trends in Neurosciences, 33, 10–16.
Brainard, D. H. (1997). The Psychophysics Toolbox. Spatial Vision, 10, 433–36.
Brown, S. D., & Heathcote, A. (2008). The simplest complete model of choice response time: Linear
ballistic accumulation. Cognitive Psychology, 57, 153–78.
Brown, S., Steyvers, M., & Wagenmakers, E. J. (2009). Observing evidence accumulation during
multi-alternative decisions. Journal of Mathematical Psychology, 53, 453–62.
Churchland, A. K., & Ditterich, J. (2012). New advances in understanding decisions among multiple
alternatives. Current Opinion in Neurobiology, 22, 920–26.
Churchland, A. K., Kiani, R., & Shadlen, M. N. (2008). Decision-making with multiple alternatives.
Nature Neuroscience, 11, 693–702.
Cohen, J. Y., Heitz, R. P., Woodman, G. F., & Schall, J. D. (2009). Neural Basis of the Set-Size Effect
in Frontal Eye Field: Timing of Attention During Visual Search. Journal of Neurophysiology, 101,
1699–1704.
Day, B. L., Rothwell, J. C., Thompson, P. D., Maertens de Noordhout, A., Nakashima, K., Shannon,
K., & Marsden, C. D. (1989). Delay in the execution of voluntary movement by electrical or
magnetic brain stimulation in intact man. Evidence for the storage of motor programs in the brain.
Brain, 112, 649–63.
de Lange, F. P., Rahnev, D. A., Donner, T. H., & Lau, H. (2013). Prestimulus Oscillatory Activity over
Motor Cortex Reflects Perceptual Expectations. Journal of Neuroscience, 33, 1400–10.
Ditterich, J. (2010). A comparison between mechanisms of multi-alternative perceptual decision
making: Ability to explain human behavior, predictions for neurophysiology, and relationship
29
Donner, T. H., Siegel, M., Fries, P., & Engel, A. K. (2009). Buildup of Choice-Predictive Activity in
Human Motor Cortex during Perceptual Decision Making. Current Biology, 19, 1581–85.
Duque, J., Greenhouse, I., Labruna, L., & Ivry, R. B. (2017). Physiological Markers of Motor
Inhibition during Human Behavior. Trends in Neurosciences, 40, 219–36.
Duque, J., Lew, D., Mazzocchio, R., Olivier, E., & Ivry, R. B. (2010). Evidence for Two Concurrent
Inhibitory Mechanisms during Response Preparation. Journal of Neuroscience, 30, 3793–802.
Forstmann, B. U., Ratcliff, R., & Wagenmakers, E.-J. (2016). Sequential Sampling Models in
Cognitive Neuroscience: Advantages, Applications, and Extensions. Annual Review of
Psychology, 67, 641–66.
Gluth, S., Rieskamp, J., & Büchel, C. (2013). Classic EEG motor potentials track the emergence of
value-based decisions. NeuroImage, 79, 394–403.
Gold, J. I., & Shadlen, M. N. (2000). Representation of a perceptual decision in developing oculomotor
commands. Nature, 404, 390–94.
Gold, J. I., & Shadlen, M. N. (2003). The influence of behavioral context on the representation of a
perceptual decision in developing oculomotor commands. Journal of Neuroscience, 23, 632-51.
Hadar, A., Makris, S., & Yarrow, K. (2012). The truth-telling motor cortex: Response competition in
M1 discloses deceptive behaviour. Biological Psychology, 89, 495–502.
Hadar, A., Rowe, P., Di Costa, S., Jones, A., & Yarrow, K. (2016). Motor-evoked potentials reveal a
motor-cortical readout of evidence accumulation for sensorimotor decisions. Psychophysiology,
15, 49.
Hanks, T. D., & Summerfield, C. (2017). Perceptual Decision Making in Rodents, Monkeys, and
Humans. Neuron, 93, 15–31.
Heathcote, A., Brown, S., & Mewhort, D. J. K. (2002). Quantile maximum likelihood estimation of
response time distributions. Psychonomic Bulletin and Review, 9, 1–31.
Hick, W. E. (1952). On the rate of gain of information. Quarterly Journal of Experimental Psychology,
4, 11–26.