Quantifying uncertainty about future
antimicrobial resistance: Comparing
structured expert judgment and statistical
forecasting methods
Abigail R. ColsonID1,2*, Itamar MegiddoID1,2, Gerardo Alvarez-Uria3, Sumanth Gandra1,2,
Tim Bedford1, Alec Morton1, Roger M. Cooke4,5, Ramanan Laxminarayan1,2,6
1 Department of Management Science, University of Strathclyde, Glasgow, Scotland, United Kingdom, 2 Center for Disease Dynamics, Economics & Policy, Washington, DC, United States of America,
3 Department of Infectious Diseases, Rural Development Trust Hospital, Bathalapalli, Andhra Pradesh, India, 4 Resources for the Future, Washington, DC, United States of America, 5 TU Delft, Delft, The Netherlands, 6 Princeton Environmental Institute, Princeton University, Princeton, New Jersey, United States of America
Abstract
The increase of multidrug resistance and resistance to last-line antibiotics is a major global public health threat. Although surveillance programs provide useful current and historical information on the scale of the problem, the future emergence and spread of antibiotic resis-tance is uncertain, and quantifying this uncertainty is crucial for guiding decisions about investment in antibiotics and resistance control strategies. Mathematical and statistical mod-els capable of projecting future rates are challenged by the paucity of data and the complex-ity of the emergence and spread of resistance, but experts have relevant knowledge. We use the Classical Model of structured expert judgment to elicit projections with uncertainty bounds of resistance rates through 2026 for nine pathogen-antibiotic pairs in four European countries and empirically validate the assessments against data on a set of calibration ques-tions. The performance-weighted combination of experts in France, Spain, and the United Kingdom projected that resistance for five pairs on the World Health Organization’s priority pathogens list (E. coli and K. pneumoniae resistant to third-generation cephalosporins and carbapenems and MRSA) would remain below 50% in 2026. In Italy, although upper bounds of 90% credible ranges exceed 50% resistance for some pairs, the medians suggest Italy will sustain or improve its current rates. We compare these expert projections to statistical forecasts based on historical data from the European Antimicrobial Resistance Surveillance Network (EARS-Net). Results from the statistical models differ from each other and from the judgmental forecasts in many cases. The judgmental forecasts include information from the experts about the impact of current and future shifts in infection control, antibiotic usage, and other factors that cannot be easily captured in statistical forecasts, demonstrating the potential of structured expert judgment as a tool for better understanding the uncertainty about future antibiotic resistance.
a1111111111 a1111111111 a1111111111 a1111111111 a1111111111 OPEN ACCESS
Citation: Colson AR, Megiddo I, Alvarez-Uria G,
Gandra S, Bedford T, Morton A, et al. (2019) Quantifying uncertainty about future antimicrobial resistance: Comparing structured expert judgment and statistical forecasting methods. PLoS ONE 14 (7): e0219190.https://doi.org/10.1371/journal. pone.0219190
Editor: Peter J. Dodd, University of Sheffield,
UNITED KINGDOM
Received: January 18, 2019
Accepted: June 18, 2019
Published: July 5, 2019
Copyright:©2019 Colson et al. This is an open access article distributed under the terms of the
Creative Commons Attribution License, which permits unrestricted use, distribution, and reproduction in any medium, provided the original author and source are credited.
Data Availability Statement: The full elicitation
protocols and elicited data, including anonymized individual expert responses, are available in in a university-maintained, accessible data repository at
http://dx.doi.org/10.15129/953210ee-27c0-4042-8fd6-f1c5b7325eae.
Funding: The research leading to these results has
Introduction
The U.S. Centers for Disease Control and Prevention (CDC) estimates that antibiotic-resistant pathogens cause more than 2 million infections and 23,000 deaths in the United States annu-ally [1], and its European counterpart estimates that 25,000 deaths in Europe every year are due to antibiotic resistance [2]. Antibiotic resistance is increasing around the world, in both high- and low-income countries, and to first-line and last-resort antibiotics [3]. In response to growing antibiotic resistance, world leaders have discussed the issue at meetings of the G7, G20, and United Nations General Assembly [4–7], and public investment in research targeting the problem exceeds $1 billion annually [8,9]. Understanding the future risk of antibiotic resis-tance is important to guide high-level policy and investments addressing the problem.
Antibiotic resistance surveillance programs provide crucial information on the current state of the problem, underscore the need for action, and identify current priority targets [10,11], but surveillance programs can only describe the past and current situation. Due to the long timeframe required to identify, develop, and bring new antibiotics to market, decisions about prioritizing and investing in antibiotic development must consider the future trajectory of resistance in addition to the current situation. However, the future emergence and spread of antibiotic resistance is uncertain, so quantifying this uncertainty is crucial for guiding deci-sions about investment in new antibiotics and resistance control strategies. Unfortunately, research on projected resistance rates is sparse. Researchers from different fields have used a variety of methodologies to investigate related questions, such as ecology and evolutionary biology models that predict and explain the emergence and spread of new resistance genes [12–16]; historical time series or before-and-after studies that look at past trends, correlations, or the impact of a specific policy or intervention [17–21]; and compartmental or simulation models that try to understand specific dynamics related to the spread of resistance or consider hypothetical scenarios [22–25]. Although essential for better understanding antibiotic resis-tance, none of that work aims to project or quantify uncertainty about future rates resistance. Some studies use time series methods to make short-term projections (e.g., six months) of resistance at a single healthcare facility or unit based on its history of antibiotic resistance and consumption (e.g. [26–31]). While useful for decision-making at a single facility, the results are not informative for policy at the national or global level.
One study used resistance and consumption data from 2001 to 2007 to project
country-level annual rates ofEscherichia coliresistance to fluoroquinolones through 2013 in 18
Euro-pean countries and the United States [32], but the study assumed antibiotic consumption in each country was fixed, and there has been no follow-up on other pathogen-antibiotic combi-nations or updating the results for future years. The projections were based on data from the European Antimicrobial Resistance Surveillance System (EARSS), the predecessor to the cur-rent European Antimicrobial Surveillance Network (EARS-Net). The study’s projections typi-cally overestimated resistance rates compared to what EARS-Net reported in 2013 [33]. The observed resistance rate in 2013 was below the projected rate in 17 of the 18 European coun-tries studied and below the lower bound of the 95% confidence interval in 11 councoun-tries.
Mathematical models capable of projecting country-level resistance rates are challenged by the large number of interacting determinants of the emergence and spread of antibiotic resis-tance [34,35]. For example, an observed rise in resisresis-tance rates for a particular antibiotic may be followed by physicians prescribing it less, which influences the future resistance rate, imply-ing resistance does not grow at a steady rate. Statistical forecastimply-ing methods struggle to process and cannot anticipate fundamental changes to the environment [36], so they may be problem-atic for projecting antibiotic resistance, given the shifting policy landscape around antibiotic use and infection control and the possibility of new drugs coming on the market or new
responsible antibiotic use, DRIVE-AB, www.drive-ab.eu], resources of which are composed of financial contribution from the European Union’s Seventh Framework Programme (FP7/2007-2013) and EFPIA companies’ in kind contribution. The funders had no role in study design, data collection and analysis, decision to publish, or preparation of the manuscript.
Competing interests: I have read the journal’s
resistance mechanisms emerging. Experts, however, have extensive domain knowledge about these issues that is relevant for thinking about the future trajectory of resistance and its uncertainty.
While all forecasting involves some expert judgment, for example, in the choice of data or model structure [37,38]. Experts can also directly supply forecasted values, a technique that is especially useful when historical data are not available or have limited predictive value [39]. Expert judgment can be subject to a range of biases [40], but a set of techniques called “expert elicitation” enable experts to provide estimates and quantify their uncertainty about parame-ters of interest—including projecting future events and values—in a way that minimizes opportunities for bias [38,41,42]. One such method, the Classical Model of structured expert judgment, has been used in over 80 applications, including estimating the burden of foodborne disease [43–45] and forecasting volcanic activity on the island of Montserrat [46–48], the introduction of invasive species in the Great Lakes [49], and future sea level rise caused by ice sheet melt [50]. Common across these application areas is the need to make evidence-based decisions but a lack of adequate data and/or models upon which to rely. The Classical Model is unique among expert elicitation techniques in that the performance of experts and their com-binations is validated against empirical data [51], and the method itself has been extensively evaluated based on its performance predicting both in- and out-of-sample data [52–54]. This element of validation makes the method well-suited for expert judgment applications involv-ing public policy.
In this study, we use the Classical Model to quantify uncertainty about the future rate of
resistance for nine pathogen-antibiotic combinations (Escherichia coliand fluoroquinolones,
E.coliand third-generation cephalosporins,E.coliand carbapenems,Klebsiella pneumoniae
and third-generation cephalosporins,K.pneumoniaeand carbapenems,Staphylococcus aureus
and methicillin (MRSA),Streptococcus pneumoniaeand penicillins,Neisseria gonorrhoeaeand
third-generation cephalosporins, andPseudomonas aeruginosaand any available treatment) in
four European countries (France, Italy, Spain, and the United Kingdom). We compare the results from the Classical Model to standard statistical forecasting approaches and discuss the strengths and weaknesses of both in the context of understanding the trajectory of and uncer-tainty about future rates of antibiotic resistance.
Methods
Expert elicitation and combination with the Classical Model
This study does not involve human participants. We conducted interviews with experts about their field of expertise. We did not use human subjects. Thus, ethics committee approval was not required for the study.
Experts’ assessments on the calibration questions are scored in two ways. First, the statisti-cal accuracy(also called “calibration”) score reflects how the well an expert’s assessments and
the realization data agree. It is based on the Kullback-Leibler divergence measureI(s,p):
I sð;pÞ ¼X
6
i¼1 siln
si pi
;
where 6 is the number of intervals created by dividing the range of outcomes based on the
pro-vided five quantiles,siis the observed proportion of the realizations that fall within intervali,
andpi= (0.05,0.20,0.25,0.25,0.20,0.05) is the expected proportion of realizations to fall within
intervali. The statistical accuracy of each experteis then defined as:
statistical accuracyðeÞ ¼1 w2
5ð2N�Iðs;pÞÞ;
whereNis the number of calibration questions andw2
5is the cumulative distribution function
of a Chi-squared distribution with 5 degrees of freedom. Thus, the statistical accuracy score is the p-value at which the hypothesis that the expert is statistically accurate would be falsely rejected; the scores range from 0 to 1, and higher scores are better.
Second, theinformationscore reflects how concentrated or spread out an expert’s
distribu-tions are. An expert that provides narrow ranges receives a higher information score than an expert with wide ranges. It is measured as the Shannon relative information with respect to a background measure. As is standard in applications of the Classical Model, we chose a uniform background measure with a 10 percent overshoot, meaning that for each question the mini-mum and maximini-mum value of the background distribution was determined by taking the small-est interval containing all the expert assessments and the realization (for calibration qusmall-estions) and extending the interval by plus and minus 10 percent.
The product of statistical accuracy and information is thecombined score.
Performance-weighted combinations are a Performance-weighted average of the experts’ assessments, with each expert’s
relative weightwidefined as:
wi¼statistical accuracyðeiÞ �informationðeiÞ �cutoff indicatorðeiÞ;
where the cutoff indicator equals 1 if the expert’s statistical accuracy score exceeds the cutoff
thresholdαand equals 0 otherwise. The weights are then normalized to sum to one. The
proper scoring rule constraint imposes the use of a cutoff on statistical accuracy, beneath which an expert is unweighted, but does not determine the value of the cutoff. This value is therefore chosen to maximize the combined score of the resulting combination of experts. The resulting weights are asymptotically strictly proper scoring rules, meaning that an expert maxi-mizes her long run expected weight by stating her true beliefs.
More information on the Classical Model’s scoring and weighting mechanisms can be found elsewhere [49,51–53,55,56]. The Classical Model is implemented in the Excalibur soft-ware [57].
and asked to identify additional experts. We repeated this process until no additional new names were provided. We recruited experts from government, health systems, and academia. Although experts from industry would also have knowledge relevant for these questions, they were not included to avoid conflicts of interest.
We conducted remote one-on-one interviews with the experts by web-conference in Sep-tember–November 2016. Some interviews were two-on-one, with two elicitors and one expert. The elicitor explained the motivation for the study and the use of expert judgment, the use of quantiles to quantify uncertainty, and the scoring mechanisms of the Classical Model. The interview also included three training questions to ensure experts understood how to provide their uncertainty assessments. During the interviews, the elicitor(s) prompted the experts to state the rationale for their assessments, including any data, models, assumptions, and other factors they considered when making judgments, and took notes on their responses. Collecting expert rationales enables the elicitor to check if the quantitative assessments match the qualita-tive story provided by an expert and can bring to light any differences between how the experts interpret questions so that issues can be clarified. The rationales also help with interpreting and understanding the elicitation results, particularly if there are differences of opinion. The experts were not provided any background information beyond what was contained in the elicitation protocol, and none of the experts reported consulting with data or other sources when explaining how they made their judgements.
The elicitation protocol included 10 calibration questions which drew on data released by the EARS-Net [33,58] and the European Gonococcal Antimicrobial Surveillance Programme (Euro-GASP) [59]. Prior to assessing calibration questions, the protocol introduced potential sources of noise in the calibration data (e.g., the laboratories reporting to EARS-Net may not be consistent from year to year), and experts were instructed to incorporate this uncertainty in their distributions. The protocol had 30 total variables of interest, which concerned future rates of resistance in different pathogen-antibiotic pairs in each of the four countries (France, Italy, Spain, and the United Kingdom). We asked about resistance rates in 2018, 2021, and 2026 for following pathogen-antibiotic pairs, focusing on resistance in invasive isolates:
1. E.coliand fluoroquinolones
2. E.coliand third-generation cephalosporins
3. E.coliand carbapenems
4. K.pneumoniaeand third-generation cephalosporins
5. K.pneumoniaeand carbapenems
6. S.aureusand methicillin (MRSA)
7. Streptococcus pneumoniaeand penicillins
8. Neisseria gonorrhoeaeand third-generation cephalosporins
9. Pseudomonas aeruginosaand any available treatment
true answer fell between those two values. Similarly, the 25th and 50th percentiles form a 50% credible range. In this way, an expert’s assessments create a statistical hypothesis that can be evaluated against realized data.
The full elicitation protocols and elicited data, including anonymized individual expert responses, are available in in a university-maintained, accessible data repository [60].
Statistical forecasting
We tested several exponential smoothing and autoregressive integrated moving average (ARIMA) models on the EARS-Net data. Our objective was to compare their outcomes with the expert elicitation outcomes, and not necessarily to find the best fit model. The EARS-Net time-series data includes the percent of tested pathogen-antibiotic pairs that were resistant for each of the countries from 2000 to 2015; the first year of testing varies by country and patho-gen-antibiotic pair from 2000 to 2007. Since the data is in the format of a ratio (the number of isolates resistant / the number of isolates tested) with zero values we applied an adjusted logit
transformation using thecarpackage in R [61], mapping values to the interval (0+�,1−�). We
then fit models to the time-series and forecast the future rates and 50% and 90% prediction intervals for each pathogen-antibiotic-country triplet described previously. We did the analysis
using the RforecastandforecastHybridpackages [62–64].
For comparability with expert uncertainty intervals, we applied exponential smoothing
models using the “ets” function from theforecastpackage, which adds an underlying stochastic
state space model. The prediction intervals are the percentiles of simulated sample paths. We explore a number of different exponential smoothing methods: simple exponential smoothing with additive errors, which is suitable if the historical data shows no underlying trend or sea-sonal patterns; Holt’s linear trend with additive errors, which is more suitable for forecasting when we observe a trend in historical data; and lastly Holt’s linear method with a dampened trend, which has been shown to successfully adjust for over-forecasting by Holt’s linear method when the time-horizon is significant [39]. As our data is annual and we do not observe seasonality, we do not consider models with seasonality. For each model, we also computed
the corrected Akaike information criterion (AICc) (as described in [39]).S1 Appendix
pro-vides further detail on the exponential smoothing models. Next, we fit the data to an ARIMA(p,d,q) model:
yd
t ¼cþ
Xp
i
�iyd
t iþ
Xq
i
yiet iþet;
whereyd
t is the transformed time series differenceddtimes,cis a constant term,ϕiis theith
autoregressive parameter,θiis theithmoving average parameter, andetis white noise. We fit the
ARIMA parameters using the “auto.arima” function in theforecastpackage, which determines
the number of differences, d, based on Kwiatkowski–Phillips–Schmidt–Shin (KPSS) unit root, and minimizes the AICc to determine values for p and q (as described in [39]). The maximum values for p, d, and q were set to 2. The point predictions of an ARIMA model with p, d, q of (0,1,1) without a constant are equivalent to the point predictions from simple exponential smoothing, an ARIMA(0,2,2) without a constant model’s point predictions are equivalent to those from the Holt’s linear trend, and an ARIMA(1,1,2) model’s point predictions are equiva-lent to those from exponential smoothing with a damped linear trend. After evaluating the results from the automatic procedure and determining if errors deviated from white noise, we
adjusted models as necessary for three of the pathogen-antibiotic-country triplets (K.
pneumo-niaeand carbapenems in France, Italy, and Spain). We conducted additional unit root tests
(PACF) functions, plotted the ACF of the residuals, and conducted Ljung Box tests. We used the identified models to project point estimates and prediction intervals. Lastly, since combining forecasts using different methods often leads to better accuracy [65], we also combined results from the “auto.arima” and “ets” functions using equal weighting [64]. The Supplementary Infor-mation provides the mean absolute scaled error (MASE) for each forecasting model considered
(Table A inS1 Appendix), which is based on in-sample predictions.
Results
Expert scores
Table B inS1 Appendixshows the statistical accuracy and information scores for the experts
and two combinations of the experts, called “decision makers.” Two weighting schemes are presented: the equal-weight decision maker (EW) assigns all experts the same weight, and the performance-weight decision maker (PW) assigns experts a constant weight for all questions based on their performance on the calibration questions. We also considered item-specific per-formance weights, but they are not presented as the results in each country were identical or only nominally different from the PW shown. Expert and decision maker scores are based on
the calibration questions; assessments for these items are presented in Figs A-D inS1
Appendix.
The France and Italy panels both had one expert who could be deemed “statistically accu-rate,” meaning their statistical accuracy scores exceeded 0.05, the traditional p-value cut-off used in hypothesis testing. In France, the expert with the highest statistical accuracy score was also the most informative. None of the Spanish experts were statistically accurate, and the United Kingdom panel had two statistically accurate experts. The PW was both more statisti-cally accurate and more informative than the EW in all four countries, and both PW and EW had acceptable statistical accuracy in France, Italy, and the United Kingdom. In Spain, how-ever, both equally-weighting each the experts and weighting the experts according to perfor-mance produced a combination of assessments that did not perform well, as seen by the low statistical accuracy score. In Italy and France only one expert received weight in the PW, which happens in about one-third of Classical Model applications [53,66].
Variables of interest
Fig 1shows the PW assessment for the variables of interest associated withE.coliresistance to
fluoroquinolones, third-generation cephalosporins, and carbapenems;K.pneumoniae
resis-tance to cephalosporins and carbapenems; and MRSA. Both the experts and historical data, from the European Antimicrobial Resistance Surveillance Network (EARS-Net) only consider
invasive isolates [33,58]. Figs E-H inS1 Appendixprovide the individual expert assessments
for these items, and Figs I-K inS1 Appendixgive both the individual expert and decision
maker assessments for the additional combinations not discussed here.
The PW’s 90% credible ranges indicate resistance rates for all pathogen-antibiotic pairs in
each country could decrease, except when resistance is near zero (e.g.,E.coliand carbapenems
in all countries). The PW’s median trajectories show a steady increase in resistance (e.g.K.
pneumoniaeand third-generation cephalosporins everywhere but Italy), a steady decline in resistance (e.g., MRSA everywhere except the UK), or a plateau around the current resistance
rate, sometimes with a slight near-term increase before coming down (e.g.,E.coliand
right-Fig 1. Performance-weight decision maker assessments. Solid lines depict EARS-Net data. Dots indicate the median assessment, dark grey is the 50% credible range, and light grey is the 90% credible range. Experts assessed rates for 2018, 2021, and 2026. Plots linearly extrapolate other future years.
[image:8.612.38.574.76.670.2]skewed, indicating the possibility of large increases in resistance rates. The PW’s 90% credible
ranges are narrower than the EW’s, which tend to be even more right-skewed (Figs A-D inS1
Appendix).
In addition to providing quantitative assessments, experts also gave qualitative information on their rationale behind their judgments. Experts in all countries thought antibiotic steward-ship and hospital infection control initiatives would continue and would have an impact on resistance rates for all of the antibiotics discussed. As the use of carbapenems increases,
though, experts saidE.coliandK.pneumoniaeresistance to carbapenems would also increase,
and many experts talked specifically about the threat of carbapenemases. In Italy, whereK.
pneumoniaeresistance to carbapenems already exceeds 30% [33], experts thought the attention given to infection control in reaction to the large spike in resistance could make the rate stabi-lize or decline in the future, but further increases are also possible. All four countries agreed that MRSA control would continue to be effective, so rates would likely decline or improve-ments in MRSA rates would be sustained in the future. In the United Kingdom, where MRSA rates were near 50% in the early 2000s [33], some experts thought there was a chance rates could rise near that level again if control efforts became lax or a new resistant clonal group emerged.
Comparison to statistical forecasts
We created a series of exponential smoothing and autoregressive integrated moving average
(ARIMA) forecasting models (Figs M-S inS1 Appendix). Here, we present some comparisons
illustrating the differences that exist between the various methods.
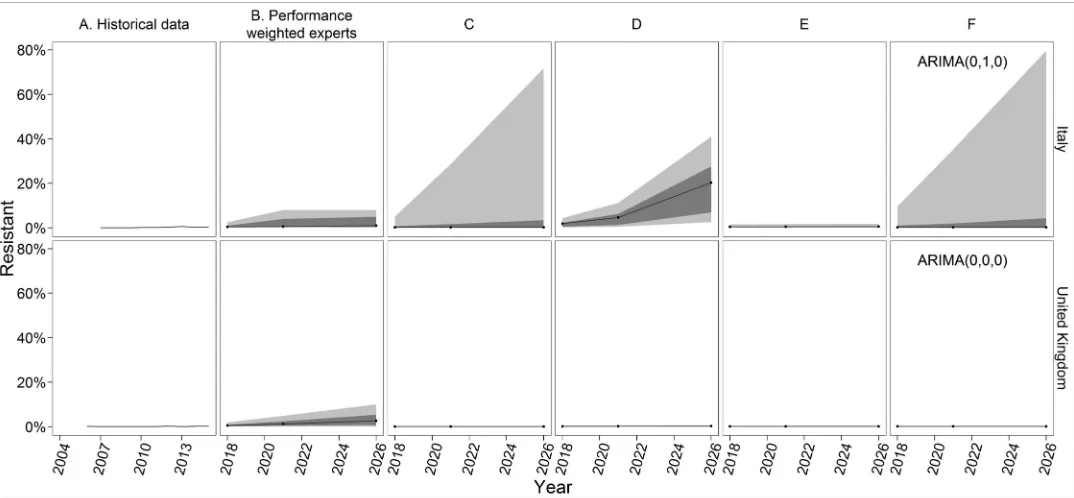
E.coliresistance to carbapenems has not yet exceeded 1% in any of the countries [58]. The
statistical forecasts in the UK all produce narrow 90% prediction intervals with the upper
bound less than 1% (Fig 2). This pattern also holds in France and Spain (Figs M-S inS1
Appendix). Experts, however, thought resistance would slowly increase, and the PW
assess-ments reflect at least a 50% chance ofE.coliresistance to carbapenems exceeding 1% in 2026
(Fig 1). While the statistical models only take into account the low historical rates of resistance, experts considered the increased consumption of carbapenems. However, most experts also thought resistance would not exceed 10% (i.e., the upper bounds of their 90% credible ranges do not exceed 10%), as carbapenems are not used in the community and hospital infection control should contain its spread.
Experts in Italy described a similar story, and observed rates ofE.coliresistance to
carbape-nems in Italy have also remained below 1%. However, the pattern and variance of the EAR-S-Net observations is different, Italy observed two years with a resistance rate of 0%, and the statistical forecasts vary (Fig 2). The upper bounds of the exponential smoothing model with no additive trend and the ARIMA model (Fig 2, Panels C and F) are much higher than that of
the PW combination, the other statistical forecasts, or any of the individual experts (Fig F inS1
Appendix). The additive trend model is the only forecast with a median projection in 2026 greater than 1% (Fig 2, Panel D). The upper bound of the damped trend model is 1.9% (Fig 2, Panel E), much lower than the upper bound from any of the other forecasts.
Fig 2. PW and forecasting results forE.coliresistance to carbapenems in Italy and the United Kingdom. All forecasts begin with 2018, 3 years after the most recent historical data. Black lines indicate the median, dark grey indicates the 50% prediction interval, and light grey indicates the 90% predication interval. The experts only assessed 2018, 2021, and 2026. The ETS models use exponential smoothing with additive error, no seasonality, and either no trend (Panel C), an additive trend (Panel D), or a damped trend (Panel E). ARIMA models (Panel F) are labelled with the ARIMA(p,d,q), values selected for that country-pathogen-antibiotic model, where p = the order of the autoregressive model, d = the degree of differencing, and q = the order of the moving average model.
https://doi.org/10.1371/journal.pone.0219190.g002
Fig 3. PW and forecasting results forK.pneumoniaeresistance to carbapenems in Italy and Spain. All forecasts begin with 2018, 3 years after the most recent historical data. Black lines indicate the median, dark grey indicates the 50% prediction interval, and light grey indicates the 90% predication interval. The experts only assessed 2018, 2021, and 2026.
[image:10.612.38.576.416.665.2]ARIMA model’s 50% prediction interval ranges from 0% to 100% (Fig 3, Panel F). Both models give a high likelihood of extreme scenarios. The additive trend model (Fig 3, Panel D),
how-ever, projects that near-completeK.pneumoniaeresistance to carbapenems in Italy is almost
certain, with the 90% prediction interval in 2026 ranging from 98.7% to 99.9%. Damping the trend (Fig 3, Panel E) decreases the median and widens the prediction interval relative to the non-damped additive trend, but the median projection in 2026 is still higher than the experts or the other two statistical forecasts.
Experts in the other three countries thoughtK.pneumoniaeresistance to carbapenems
would follow a similar pattern asE.coliresistance, but with a higher ceiling, reflecting thatK.
pneumoniaeis harder to remove from the environment, resistance genes spread more quickly
amongK.pneumoniae, and Italy experienced a sharp increase in resistance for this
pathogen-antibiotic pair, demonstrating a rapid change is possible. The statistical forecast models in Spain, however, all overestimate the future resistance and/or the uncertainty about future resistance relative to the experts (Fig 3). As the additive trend model (Fig 3, Panel D) identifies a linear trend in the data and cannot increase above 100%, the model indicates increasing cer-tainty into the future. The ARIMA model has extremely wide prediction intervals, reflecting high variability in errors that, due to the second-order differencing, are based on only a few observations.
[image:11.612.36.576.427.673.2]Experts everywhere thought MRSA control would continue to be effective, but in some countries experts also said that MRSA rates could hit a floor and not fall further. This logic and the corresponding PW estimates align with some of the statistical forecasts. The median of the PW in France, for example, is similar to the median projections of three of the four statistical forecast models (Fig 4), though the models’ 90% prediction intervals are narrower than the PW’s 90% credible range. In the UK, the PW estimates and credible ranges are similar to the exponential smoothing model with a damped trend (Fig 4, Panel E). In this case, the intuition
Fig 4. PW and forecasting results for MRSA in France and United Kingdom. All forecasts begin with 2018, 3 years after the most recent historical data. Black lines indicate the median, dark grey indicates the 50% prediction interval, and light grey indicates the 90% predication interval. The experts only assessed 2018, 2021, and 2026.
of the model matches the logic of the experts, who thought resistance would decline at a decreasing rate as it approaches a floor (i.e., a damped trend). The upper bound of the UK PW’s credible range reflects that some experts thought the MRSA rate could approach 50%, as it did in the early 2000s 30, if control weakened or a new clonal group emerged. This is coinci-dentally similar to the upper bound of the damped trend model’s prediction interval. However, the exponential smoothing model with no trend has a better fit to the historical data, as deter-mined by minimizing the corrected Akaike’s Information Criterion (AICc), a standard approach for choosing among exponential smoothing or ARIMA models.
Discussion
In this paper, we present estimates and uncertainty ranges—from judgmental forecasts and statistical forecasts—for the future trajectory of resistance for six pathogen-antibiotic pairs.
Four of these pairs—E.coliandK.pneumoniaeresistance to third-generation cephalosporins
and carbapenems—are critical public health priorities according to the World Health Organi-zation’s (WHO) 2017 priority pathogens list [67], and MRSA is a high priority. Experts in France, Spain, and the United Kingdom thought resistance for all of these priority pathogens would remain below 50% in 2026, according to the PW’s 90% credible ranges. The EW’s 90% credible ranges are wider, but its 50% credible ranges also stay below 50% resistance for all of
these combinations except fluoroquinolone-resistantE.coliin Spain in 2026, when the upper
bound of the 50% credible range is 52.5% resistance. In Italy, the PW’s 95thpercentile estimates
reach or exceed 50% resistance forE.coliand third-generation cephalosporins,K.pneumoniae
and third-generation cephalosporins, andK.pneumoniaeand carbapenems, but the medians
suggest Italy will sustain or improve its current rates for these pairs.
The experts’ judgments were based on their belief that the increasing local, national, and global focus on antibiotic stewardship in hospitals and the community and hospital infection control will continue and will positively impact resistance rates. These results do not mean antibiotic resistance control efforts can be relaxed, but that experts believe they have had and will continue to have a positive impact on resistance rates. The distributions from the experts are conditional on their expectations that these programs will continue or expand and do not represent what would happen if the programs ended, although some experts discussed this possibility when determining the upper bound of their 90% credible interval. Although we did not ask about future resistance in a specific scenario with decreasing or no antibiotic steward-ship and infection control, many of the experts mentioned these programs were a key factor in their estimates, underscoring their importance for preserving antibiotic effectiveness. Future work could ask experts about the trajectory of resistance under different policy or intervention scenarios, to get more information on the impact of specific policies.
The experts’ assessments also indicate the role antibiotic resistance surveillance programs play in preserving antibiotic effectiveness. Experts who discussed a possible future increase in MRSA mentioned a scenario in which a new clonal resistant strain emerges and establishes quickly, undoing previous improvements in the rate of MRSA. Effective surveillance systems with timely information sharing are needed to identify and contain new resistant strains quickly after they emerge to prevent this.
or to 100% [70]. Although our projections only go through 2026–10 years from the time of the interviews—the AMR Review scenarios are not consistent with the findings presented here.
We show two approaches to forecasting, a purely judgment-based method and a suite of statistical approaches. The statistical methods make most explicit use of the historical data, interpreted through specific underlying mathematical modelling, but are not able to anticipate changes in antibiotic use and infection control, the emergence of new resistant strains, or the introduction of new antibiotics. Experts have relevant knowledge about these issues and their impact on future resistance rates, which should be included in forecasts. Expert forecasts can be limited by heuristics and biases, but structured elicitation approaches, such as the Classical Model, are a way to minimize their impact on results [41].
We present these as separate methods, but judgmental and statistical forecasts can also be combined in different ways [37,71]. Results from the two approaches can be averaged, for example either with equal weight given to the experts and statistical forecast or using the Clas-sical Model’s performance weights and producing distributions for the calibration questions from the statistical forecasts. This does not resolve the choice of which statistical forecast to use, however, as different model structures can produce different results, as seen here.
An expert, rather than AICc or another measure of model fit, can choose the modelling approach and structure (e.g., selecting an exponential smoothing model with a damped trend for some pathogen-antibiotic pairs and a model with no trend for others). Experts can also introduce additional model parameters to make statistical forecasts better reflect what they anticipate will happen (e.g., the idea that in practice resistance wouldn’t rise above some
threshold, see Fig R inS1 Appendix). Making these judgments requires experts who have both
subject-matter expertise relevant for understanding future resistance rates and technical exper-tise enabling informed choice on model structure and parameters. This introduces additional cognitive burden on the experts and may be a less natural way for them to think about future resistance rates.
Another method to combine approaches is to use the statistical forecasts as an “input” in judgmental forecasts, as background material given to the experts. If this is done, however, care must be given in the elicitation to discourage experts from anchoring on the historical trend and inadequately adjusting their assessments (anchoring and adjustment are discussed in [40]). The problem could possibly be minimized by sharing a range of forecasts and discuss-ing the likelihood of the various results and the factors contributdiscuss-ing to different scenarios. Ask-ing the experts for the rationale for their judgments and challengAsk-ing any assumptions they make, best practice in any elicitation, could also help reduce bias if statistical forecasts were used in this way.
If experts anticipate recent and future events are more important than characterizing past trends for forecasting the future, statistical forecasting might not improve judgmental fore-casts. Conversely, for outcomes for which the past is a good predictor of the future, expert judgment would not have additional value relative to statistical forecasting. In this study, experts demonstrated relevant knowledge about future rates of resistance that was not cap-tured in the statistical forecasts, indicating the potential of expert judgment in this application.
Our study has several important limitations. The resistance rate forecasts presented only apply to invasive isolates; neither the experts nor the statistical forecasts consider resistance rates in hospital- or community-acquired urinary tract infections, skin and soft tissue infec-tions, or other non-invasive infections. Resistance rates in non-invasive isolates may differ from rates in invasive isolates, limiting the interpretation of our results. We did ask the experts three questions about resistance rates for certain non-invasive isolates at one point of time
(2021), and these results are in the Supplemental Information (Fig L inS1 Appendix), but
timeframes was not practical. Also, we consider only the rate of resistance, not the number of resistant infections. Resistance rates are an important indicator to inform decisions about con-trol strategies or the need for new drugs, but they do not tell the complete story, and informa-tion about the incidence of resistant infecinforma-tions is also needed to guide policy and research [72,73].
The results from our experts indicate most of the antibiotics studied will likely remain effec-tive in the next decade for treating the majority of infections caused by the pathogens discussed in France, Italy, Spain, and the United Kingdom. This result may not hold for all countries, especially mid-income countries like Brazil, India, and China which have recently seen the largest increases in antibiotic consumption [74]. We considered the rate of resistance for each pathogen-antibiotic pair at each point of time to be independent. However, experts discussed dependencies between these rates. Rising resistance to third-generation cephalosporins, for example, could lead to increased use of carbapenems and thus higher carbapenem-resistance rates in the future. We may underestimate the probability of increased resistance if we ignore this dependency. Future work is needed to better understand the magnitude of this issues and its implications for managing the risks of antibiotic resistance.
The judgmental forecasts presented here reflect the experts’ estimation of the uncertainty about future resistance rates in autumn 2016, when the elicitations were conducted. However, the experts’ understanding is constantly evolving as antibiotic resistance surveillance programs continue and expand, new research improves knowledge about the dynamics of resistance, and relevant polices change. Future iterations of this work are needed to allow experts to update their forecasts to reflect this changing information. Researchers conducted an expert elicitation exercise predicting risks from volcanic activity on the island of Montserrat for 14 years [46,48]. A similar ongoing elicitation exercise could be conducted on future rates of resis-tance, with experts regularly updating their quantitative assessments to reflect the changing landscape of resistance, providing up-to-date information to decision makers. Future work should also evaluate the accuracy of these expert and statistical projections once resistance data from 2018 becomes available.
Supporting information
S1 Appendix. Additional methods and results.
(PDF)
Author Contributions
Conceptualization: Abigail R. Colson, Ramanan Laxminarayan.
Data curation: Abigail R. Colson.
Formal analysis: Abigail R. Colson, Itamar Megiddo, Gerardo Alvarez-Uria.
Funding acquisition: Ramanan Laxminarayan.
Investigation: Abigail R. Colson.
Methodology: Abigail R. Colson, Itamar Megiddo, Sumanth Gandra, Roger M. Cooke.
Project administration: Abigail R. Colson.
Supervision: Tim Bedford, Alec Morton, Ramanan Laxminarayan.
Visualization: Abigail R. Colson, Itamar Megiddo.
Writing – review & editing: Abigail R. Colson, Itamar Megiddo, Gerardo Alvarez-Uria,
Sumanth Gandra, Tim Bedford, Alec Morton, Roger M. Cooke, Ramanan Laxminarayan.
References
1. Centers for Disease Control and Prevention. Antibiotic Resistance Threats in the United States, 2013 [Internet]. CDC; 2013. Available:http://www.cdc.gov/drugresistance/threat-report-2013/
2. European Centre for Disease Prevention and Control, European Medicines Agency. The bacterial chal-lenge: Time to react, A call to narrow the gap between multidrug-resistant bacteria in the EU and the development of new antibacterial agents [Internet]. Stockholm: ECDC; 2009. Available:http://ecdc. europa.eu/en/publications/Publications/0909_TER_The_Bacterial_Challenge_Time_to_React.pdf
3. Gelband H, Miller-Petrie M, Pant S, Gandra S, Levinson J, Barter D, et al. The State of the World’s Anti-biotics, 2015 [Internet]. Washington, D.C.: Center for Disease Dynamics, Economics & Policy; 2015. Available:http://cddep.org/sites/default/files/swa_2015_final.pdf
4. G7 Health Ministers. Declaration of the G7 health ministers [Internet]. Berlin, Germany: G7; 2015 Oct. Available:http://www.bundesgesundheitsministerium.de/fileadmin/Dateien/3_Downloads/G/G7/G7_ Health_Ministers_Declaration_AMR_and_EBOLA.pdf
5. G20. G20 leaders’ communique: Hangzhou summit [Internet]. Hangzhou, China: G20; 2016 Sep. Available:https://www.g20.org/Webs/G20/EN/G20/Summit_documents/summit_documents_node. html
6. G20. Berlin Declaration of the G20 Health Ministers: Together Today for a Healthy Tomorrow [Internet]. Berlin, Germany: G20; 2017 May. Available:https://www.g20.org/Content/EN/Artikel/2017/05_en/ 2017-05-19-g20-gesundheitsministertreffen_en.html
7. UNGA. Political declaration of the high-level meeting of the General Assembly on antimicrobial resis-tance [Internet]. New York, NY: United Nations; 2016 Sep. Available: http://www.un.org/pga/71/event-latest/high-level-meeting-on-antimicrobial-resistance/
8. Kelly R, Zoubiane G, Walsh D, Ward R, Goossens H. Public funding for research on antibacterial resis-tance in the JPIAMR countries, the European Commission, and related European Union agencies: a systematic observational analysis. Lancet Infect Dis. 2016; 16: 431–440.https://doi.org/10.1016/ S1473-3099(15)00350-3PMID:26708524
9. Outterson K, Rex JH, Jinks T, Jackson P, Hallinan J, Karp S, et al. Accelerating global innovation to address antibacterial resistance: Introducing CARB-X. Nat Rev Drug Discov. 2016; 15: 589–590. https://doi.org/10.1038/nrd.2016.155PMID:27469032
10. World Health Organization. Antimicrobial resistance: global report on surveillance [Internet]. Geneva: World Health Organization; 2014. Available:http://www.who.int/drugresistance/documents/
surveillancereport/en/
11. World Health Organization. Global Action Plan on Antimicrobial Resistance [Internet]. Geneva: WHO; 2015. Available:http://www.wpro.who.int/entity/drug_resistance/resources/global_action_plan_eng.pdf
12. Martı´nez JL, Baquero F, Andersson DI. Predicting antibiotic resistance. Nat Rev Microbiol. 2007; 5: 958–965.https://doi.org/10.1038/nrmicro1796PMID:18007678
13. Martı´nez JL, Fajardo A, Garmendia L, Hernandez A, Linares JF, Martı´nez-Solano L, et al. A global view of antibiotic resistance. FEMS Microbiol Rev. 2009; 33: 44–65.https://doi.org/10.1111/j.1574-6976. 2008.00142.xPMID:19054120
14. Martı´nez JL, Baquero F, Andersson DI. Beyond serial passages: new methods for predicting the emer-gence of resistance to novel antibiotics. Curr Opin Pharmacol. 2011; 11: 439–445.https://doi.org/10. 1016/j.coph.2011.07.005PMID:21835695
15. Orencia MC, Yoon JS, Ness JE, Stemmer WPC, Stevens RC. Predicting the emergence of antibiotic resistance by directed evolution and structural analysis. Nat Struct Mol Biol. 2001; 8: 238–242.https:// doi.org/10.1038/84981PMID:11224569
16. Courvalin Patrice. Antimicrobial Drug Resistance: “Prediction Is Very Difficult, Especially about the Future.” Emerg Infect Dis J. 2005; 11: 1503.https://doi.org/10.3201/eid1110.051014PMID:16318687
17. Aldeyab MA, Monnet DL, Lo´pez-Lozano JM, Hughes CM, Scott MG, Kearney MP, et al. Modelling the impact of antibiotic use and infection control practices on the incidence of hospital-acquired methicillin-resistant Staphylococcus aureus: a time-series analysis. J Antimicrob Chemother. 2008; 62: 593–600. https://doi.org/10.1093/jac/dkn198PMID:18467307
19. Willmann M, Marschal M, Ho¨lzl F, Schro¨ppel K, Autenrieth IB, Peter S. Time Series Analysis as a Tool To Predict the Impact of Antimicrobial Restriction in Antibiotic Stewardship Programs Using the Exam-ple of Multidrug-Resistant Pseudomonas aeruginosa. Antimicrob Agents Chemother. 2013; 57: 1797– 1803.https://doi.org/10.1128/AAC.02142-12PMID:23380719
20. Lawes T, Lopez-Lozano J-M, Nebot CA, Macartney G, Subbarao-Sharma R, Dare CR, et al. Effects of national antibiotic stewardship and infection control strategies on hospital-associated and community-associated meticillin-resistant Staphylococcus aureus infections across a region of Scotland: a non-lin-ear time-series study. Lancet Infect Dis. 2015; 15: 1438–1449.https://doi.org/10.1016/S1473-3099(15) 00315-1PMID:26411518
21. Lawes T, Lo´pez-Lozano J-M, Nebot C, Macartney G, Subbarao-Sharma R, Dare CRJ, et al. Turning the tide or riding the waves? Impacts of antibiotic stewardship and infection control on MRSA strain dynamics in a Scottish region over 16 years: non-linear time series analysis. BMJ Open. 2015; 5: e006596.https://doi.org/10.1136/bmjopen-2014-006596PMID:25814495
22. Spicknall IH, Foxman B, Marrs CF, Eisenberg JNS. A Modeling Framework for the Evolution and Spread of Antibiotic Resistance: Literature Review and Model Categorization. Am J Epidemiol. 2013; 178: 508–520.https://doi.org/10.1093/aje/kwt017PMID:23660797
23. Bonten MJM, Austin DJ, Lipsitch M. Understanding the Spread of Antibiotic Resistant Pathogens in Hospitals: Mathematical Models as Tools for Control. Clin Infect Dis. 2001; 33: 1739–1746.https://doi. org/10.1086/323761PMID:11595995
24. Caudill L, Wares JR. The Role of Mathematical Modeling in Designing and Evaluating Antimicrobial Stewardship Programs. Curr Treat Options Infect Dis. 2016; 8: 124–138.https://doi.org/10.1007/ s40506-016-0074-8
25. Lee BY, Bartsch SM, Wong KF, McKinnell JA, Slayton RB, Miller LG, et al. The Potential Trajectory of Carbapenem-Resistant Enterobacteriaceae, an Emerging Threat to Health-Care Facilities, and the Impact of the Centers for Disease Control and Prevention Toolkit. Am J Epidemiol. 2016; 183: 471–479. https://doi.org/10.1093/aje/kwv299PMID:26861238
26. Lo´pez-Lozano J-M, Monnet DL, Yagu¨ e A, Burgos A, Gonzalo N, Campillos P, et al. Modelling and fore-casting antimicrobial resistance and its dynamic relationship to antimicrobial use: a time series analysis. Int J Antimicrob Agents. 2000; 14: 21–31.https://doi.org/10.1016/S0924-8579(99)00135-1PMID: 10717497
27. Monnet DL, Lo´pez-Lozano J-M, Campillos P, Burgos A, Yagu¨e A, Gonzalo N. Making sense of antimi-crobial use and resistance surveillance data: application of ARIMA and transfer function models. Clin Microbiol Infect. 2001; 7, Supplement 5: 29–36.https://doi.org/10.1046/j.1469-0691.2001.00071.x
28. Lo´pez-Lozano J-M, Monnet DL, Alonso PC, Quintero AC, Jime´nez NG, Muñoz AY, et al. Applications of Time-series Analysis to Antibiotic Resistance and Consumption Data. In: Gould IM, Meer JWM van der, editors. Antibiotic Policies. Springer US; 2005. pp. 447–463.https://doi.org/10.1007/0-387-22852-7_ 24
29. Gallini A, Degris E, Desplas M, Bourrel R, Archambaud M, Montastruc J-L, et al. Influence of fluoroquin-olone consumption in inpatients and outpatients on ciprofloxacin-resistant Escherichia coli in a univer-sity hospital. J Antimicrob Chemother. 2010; 65: 2650–2657.https://doi.org/10.1093/jac/dkq351PMID: 20876240
30. Gharbi M, Moore LSP, Gilchrist M, Thomas CP, Bamford K, Brannigan ET, et al. Forecasting carbape-nem resistance from antimicrobial consumption surveillance: Lessons learnt from an OXA-48-producing Klebsiella pneumoniae outbreak in a West London renal unit. Int J Antimicrob Agents. 2015; 46: 150– 156.https://doi.org/10.1016/j.ijantimicag.2015.03.005PMID:25979640
31. Xie J, Wang Y, Zheng X, Yang Q, Wang T, Zou Y, et al. Modeling and forecasting Acinetobacter bau-mannii resistance to set appropriate use of cefoperazone-sulbactam: Results from trend analysis of antimicrobial consumption and development of resistance in a tertiary care hospital. Am J Infect Control. 2015; 43: 861–864.https://doi.org/10.1016/j.ajic.2015.04.197PMID:26033693
32. Durham LK, Ge M, Cuccia AJ, Quinn JP. Modeling antibiotic resistance to project future rates: Quino-lone resistance in Escherichia coli. Eur J Clin Microbiol Infect Dis. 2010; 29: 353–356.https://doi.org/10. 1007/s10096-009-0862-xPMID:20119677
33. European Centre for Disease Prevention and Control. Surveillance Atlas of Infectious Diseases [Inter-net]. 2016 [cited 22 Jun 2017]. Available:http://atlas.ecdc.europa.eu/public/index.aspx
34. Harbarth S, Samore MH. Antimicrobial Resistance Determinants and Future Control. Emerg Infect Dis. 2005; 11: 794–801.https://doi.org/10.3201/eid1106.050167PMID:15963271
36. Goodwin P. How to integrate management judgment with statistical forecasts. Foresight Int J Appl Fore-cast. 2005; 1: 8–12.
37. Wright G, Goodwin P, editors. Forecasting with judgement. Chichester [England]; New York: J. Wiley; 1998.
38. Bolger F, Wright G. Use of expert knowledge to anticipate the future: Issues, analysis and directions. Int J Forecast. 2017; 33: 230–243.https://doi.org/10.1016/j.ijforecast.2016.11.001
39. Hyndman RJ, Athanasopoulos G. Forecasting: Principles and practice [Internet]. 2014. Available: https://www.otexts.org/fpp
40. Kahneman D, Slovic P, Tversky A, editors. Judgment under uncertainty: Heuristics and biases. Cam-bridge: Cambridge University Press; 1982.
41. European Food Safety Authority. Guidance on Expert Knowledge Elicitation in Food and Feed Safety Risk Assessment. EFSA J. 2014; 12.https://doi.org/10.2903/j.efsa.2014.3734
42. Morgan MG. Use (and abuse) of expert elicitation in support of decision making for public policy. Proc Natl Acad Sci U S A. 2014; 111: 7176–7184.https://doi.org/10.1073/pnas.1319946111PMID: 24821779
43. Hald T, Aspinall W, Devleesschauwer B, Cooke R, Corrigan T, Havelaar AH, et al. World Health Organi-zation Estimates of the Relative Contributions of Food to the Burden of Disease Due to Selected Food-borne Hazards: A Structured Expert Elicitation. PLOS ONE. 2016; 11: e0145839.https://doi.org/10. 1371/journal.pone.0145839PMID:26784029
44. Aspinall WP, Cooke RM, Havelaar AH, Hoffmann S, Hald T. Evaluation of a Performance-Based Expert Elicitation: WHO Global Attribution of Foodborne Diseases. PLOS ONE. 2016; 11: e0149817.https:// doi.org/10.1371/journal.pone.0149817PMID:26930595
45. Hoffmann S, Devleesschauwer B, Aspinall W, Cooke R, Corrigan T, Havelaar A, et al. Attribution of global foodborne disease to specific foods: Findings from a World Health Organization structured expert elicitation. PLOS ONE. 2017; 12: e0183641.https://doi.org/10.1371/journal.pone.0183641PMID: 28910293
46. Aspinall WP. A route to more tractable expert advice. Nature. 2010; 463: 294–295.https://doi.org/10. 1038/463294aPMID:20090733
47. Aspinall WP, Loughlin SC, Michael FV, Miller AD, Norton GE, Rowley KC, et al. The Montserrat Volcano Observatory: its evolution, organization, role and activities. Geol Soc Lond Mem. 2002; 21: 71–91. https://doi.org/10.1144/GSL.MEM.2002.021.01.04
48. Wadge G, Aspinall WP. A review of volcanic hazard and risk-assessment praxis at the Soufrière Hills Volcano, Montserrat from 1997 to 2011. Geol Soc Lond Mem. 2014; 39: 439–456.https://doi.org/10. 1144/M39.24
49. Wittmann ME, Cooke RM, Rothlisberger JD, Rutherford ES, Zhang H, Mason DM, et al. Use of struc-tured expert judgment to forecast invasions by bighead and silver carp in Lake Erie. Conserv Biol. 2015; 29: 187–197.https://doi.org/10.1111/cobi.12369PMID:25132396
50. Bamber JL, Aspinall WP. An expert judgement assessment of future sea level rise from the ice sheets. Nat Clim Change. 2013; 3: 424–427.https://doi.org/10.1038/nclimate1778
51. Cooke RM. Experts in uncertainty: Opinion and subjective probability in science. New York: Oxford University Press; 1991.
52. Cooke RM, Goossens LLHJ. TU Delft expert judgment data base. Reliab Eng Syst Saf. 2008; 93: 657– 674.https://doi.org/10.1016/j.ress.2007.03.005
53. Colson AR, Cooke RM. Cross validation for the Classical Model of structured expert judgment. Reliab Eng Syst Saf. 2017; 163: 109–120.https://doi.org/10.1016/j.ress.2017.02.003
54. Colson AR, Cooke RM. Validating experts’ judgments with the Classical Model. Rev Environ Econ Pol-icy. 2017;Accepted.
55. Cooke RM. Messaging climate change uncertainty. Nat Clim Change. 2015; 5: 8–10.https://doi.org/10. 1038/nclimate2466
56. Quigley J, Colson AR, Aspinall WP, Cooke RM. Elicitation in the Classical Model. In: Dias LC, Morton A, Quigley J, editors. Elicitation: The science and art of structuring judgement. New York, NY: Springer; 2018. pp. 15–36.https://doi.org/10.1007/978-3-319-65052-4_2
57. Cooke RM, Solomatine D, Ababei D. Excalibur [Internet]. Delft, The Netherlands: LightTwist Software; 2013. Available:http://www.lighttwist.net/wp/excalibur
59. European Centre for Disease Prevention and Control. Gonococcal antimicrobial susceptibility surveil-lance in Europe, 2014 [Internet]. Stockholm: ECDC; 2016 Aug. Available:http://ecdc.europa.eu/en/ publications/Publications/gonococcal-antimicrobial-susceptibility-surveillance-Europe-2014.pdf
60. Colson AR. Expert Judgment Evaluation of the Future Risk of Antimicrobial Resistance [Internet]. Glas-gow, UK: University of Strathclyde PURE; 2017. Available: http://dx.doi.org/10.15129/953210ee-27c0-4042-8fd6-f1c5b7325eae
61. Fox J, Weisberg S, Adler D, Bates D, Baud-Bovy G, Ellison S, et al. car: Companion to Applied Regres-sion [Internet]. 2016. Available:https://cran.r-project.org/web/packages/car/index.html
62. Hyndman RJ. forecast: Forecasting functions for time series and linear models [Internet]. R package version 8.0. 2017. Available:http://github.com/robjhyndman/forecast
63. Hyndman RJ, Khandakar Y. Automatic Time Series Forecasting: The forecast Package for R. J Stat Softw. 2008; 27.https://doi.org/10.18637/jss.v027.i03
64. Shaub D, Ellis P. forecastHybrid: Convenient Functions for Ensemble Time Series Forecasts [Internet]. R package version 0.4.0. 2017. Available:https://CRAN.R-project.org/package=forecastHybrid
65. Bates JM, Granger CWJ. The Combination of Forecasts. OR. 1969; 20: 451–468.https://doi.org/10. 2307/3008764
66. Goossens LHJ, Cooke RM, Hale AR, Rodić-Wiersma Lj. Fifteen years of expert judgement at TUDelft. Saf Sci. 2008; 46: 234–244.https://doi.org/10.1016/j.ssci.2007.03.002
67. World Health Organization. Global priority list of antibiotic-resistant bacteria to guide research, discov-ery, and development of new antibiotics [Internet]. Geneva: WHO; 2017 Feb. Available:http://www. who.int/medicines/publications/global-priority-list-antibiotic-resistant-bacteria/en/
68. Review on Antimicrobial Resistance. Antimicrobial resistance: Tackling a crisis for the health and wealth of nations [Internet]. UK: Review on Antimicrobial Resistance; 2014 Dec. Available:http://amr-review. org/sites/default/files/AMR%20Review%20Paper%20-%20Tackling%20a%20crisis%20for%20the% 20health%20and%20wealth%20of%20nations_1.pdf
69. Taylor J, Hafner M, Yerushalmi E, Smith R, Bellasio J, Vardavas R, et al. Estimating the economic costs of antimicrobial resistance: Model and results [Internet]. Cambridge, UK: RAND; 2014 p. 113. Report No.: RR-911-WT. Available:http://www.rand.org/pubs/research_reports/RR911.html
70. KPMG. The global economic impact of anti-microbial resistance [Internet]. KPMG; 2014 Dec. Available: http://www.kpmg.com/UK/en/IssuesAndInsights/ArticlesPublications/Documents/PDF/Issues%20and %20Insights/amr-report-final.pdf
71. Sanders N. When and how should statistical forecasts be judgmentally adjusted? Foresight Int J Appl Forecast. 2005; 1: 5–7.
72. de Kraker MEA, Stewardson AJ, Harbarth S. Will 10 Million People Die a Year due to Antimicrobial Resistance by 2050? PLOS Med. 2016; 13: e1002184.https://doi.org/10.1371/journal.pmed.1002184 PMID:27898664
73. Schwaber MJ, De-Medina T, Carmeli Y. Epidemiological interpretation of antibiotic resistance studies— what are we missing? Nat Rev Microbiol. 2004; 2: 979–983.https://doi.org/10.1038/nrmicro1047PMID: 15550943