Dielectronic and Trielectronic Recombination Rate Coefficients of
1
Be-Like Ar
14+ 2Z. K. Huang1, W. Q. Wen1, X. Xu2, S.Mahmood1, S. X. Wang2, H. B. Wang1, L. J. Dou1, N. Khan1, 3, N.
3
R. Badnell6, S. P. Preval6, S. Schippers7, T. H. Xu4, Y. Yang4, K. Yao4, W.Q. Xu5, X. Y. Chuai1, X. L.
4
Zhu1, D. M. Zhao1, L. J. Mao1, X. M. Ma1, J. Li1, R. S. Mao1, Y. J. Yuan1, B. Wu1, L. N. Sheng1, J. C.
5
Yang1, H. S. Xu1, L. F. Zhu2 and X. Ma1
6
1 Institute of Modern Physics, Chinese Academy of Sciences, 730000, Lanzhou, China;
7
wenweiqiang@impcas.ac.cn, x.ma@impcas.ac.cn 8
2 Hefei National Laboratory for Physical Sciences at Microscale, Department of Modern Physics,
9
University of Science and Technology of China, 230026, Hefei, China 10
3 University of Chinese Academy of Sciences, 100049, Beijing, China
11
4 Institute of Modern Physics, Fudan University, 200433, Shanghai, China
12
5 Department of Mathematics and Physics, Bengbu University, 233000, Bengbu, China
13
6 Department of Physics, University of Strathclyde, Glasgow G4 0NG, UK
14
7I. Physikalisches Institut, Justus-Liebig-Universität Gießen, 35392 Giessen, Germany
15
ABSTRACT 16
Electron-ion recombination of Be-like 40Ar14+ has been measured by employing the
17
electron-ion merged-beams method at the cooler storage ring CSRm. The measured
18
absolute recombination rate coefficients for collision energies from 0 to 60 eV are
19
presented, covering all dielectronic recombination (DR) resonances associated with
20
2s2→2s2p core transitions. In addition, strong trielectronic recombination (TR)
21
resonances associated with 2s2→2p2 core transitions were observed.Both DR and TR
22
processes lead to series of peaks in the measured recombination spectrum, which have
23
been identified by the Rydberg formula. Theoretical calculations of recombination rate
24
coefficients were performed using the state-of-the-art multi-configuration Breit-Pauli
25
(MCBP) atomic structure code AUTOSTRUCTURE to compare with the experimental
26
results. The plasma rate coefficients for DR+TR of Ar14+ were deduced from the
27
measured electron-ion recombination rate coefficients in the temperature range from
28
103 to107 K, and compared with calculated data from the literature. The
experimentally-29
derived plasma rate coefficients are 60% larger and 30% lower than the previously
30
recommended atomic data for the temperature ranges of photoionized plasmas and
31
collisionally-ionized plasmas, respectively. However, good agreement was found
32
between experimental results and the calculations by (Gu 2003) and (Colgan et al.
33
2003). The plasma rate coefficients deduced from experiment and calculated by the
34
current AUTOSTRUCTURE code show agreement that is better than 30% from 104
35
to107 K. The present results constitute a set of bench-mark data for use in astrophysical
36
modeling.
37
Keywords: atomic data – atomic processes - plasmas
1. INTRODUCTION 39
It has been estimated that more than 90% of the visible matter in the universe is in
40
plasma state (Müller 2008). Astrophysical plasmas can be divided into two main classes,
41
i) the collisionally ionized plasma formed in stars, supernova remnants and galaxies,
42
and ii) photoionized plasmas formed in the sources such as planetary nebulae, X-ray
43
binaries and active galactic nuclei. Various types of reactions take place in astrophysical
44
plasmas, such as electron collision excitation, electron impact ionization, and
electron-45
ion recombination (Savin 2007). Emission features originating from these plasmas are
46
essential in deducing the properties of the plasmas, such as temperature, density and
47
elemental abundances (Beiersdorfer 2003; Kallman & Palmeri 2007). Electron-ion
48
recombination processes such as radiative recombination (RR) and dielectronic
49
recombination (DR) contribute substantially to the line emission for photoionized
50
plasmas. In addition, the ionization balance of a plasma is determined by the relative
51
rates of ionization and recombination.
52
In order to understand astrophysical plasmas, space-based observatories, such as
53
Chandra and XMM-Newton, have been launched to observe x-ray emission from
54
various astrophysical objects (Paerels & Kahn 2003). All the observed emission and
55
absorption lines have to be explained by plasma modelling, and most of the input atomic
56
data for these plasma models are from theory. However, many theories cannot calculate
57
the DR rate coefficients with sufficient precision and have large uncertainties especially
58
at low energies due to sensitivity in the positioning of resonances. As a result, precise
59
electron-ion recombination data from experiment are required to explain the
60
astrophysical observations and to benchmark the theory. With these data, information
61
pertaining to these astrophysical objects, such as the structure, elemental composition,
62
energy balance, and temperature distribution, can be investigated (Kallman & Palmeri
63
2007).
64
The importance of DR in a plasma was recognized for the first time by Burgess in
65
1964 (Burgess 1964). Since then, DR is considered as an important process in atomic
66
physics and plasma physics. DR experiments on highly charged ions employing the
67
electron-ion merged beams technique have been developed for more than two decades
68
at heavy ion storage rings, i.e., the TSR at MPIK in Heidelberg (Schippers 2015), the
69
ESR at GSI in Darmstadt (Brandau & Kozhuharov 2012), Germany, and the CRYRING
70
at MSL in Stockholm, Sweden (Schuch & Böhm 2007). The main cooler storage ring
71
(CSRm) equipped with an electron cooler provides an ideal research platform for
72
electron-ion recombination experiments of highly charged ions at heavy ion research
facility in Lanzhou (Huang et al. 2017). More details about DR experiments at storage
74
rings can be found in the recent reviews of (Brandau & Kozhuharov 2012; Brandau et
75
al. 2015; Müller 2008; Schippers 2015) and in the references cited therein. Recent
76
reviews of experimental DR measurements for astrophysics application have been
77
given by (Schippers 2012).
78
Argon is one of the most abundant heavy elements in the universe and also in the
79
solar system. The emission lines from argon have already been observed and were used
80
for plasma diagnostics (Dere et al. 2001). In addition, Be-like argon has been observed
81
in hot solar plasmas where the temperature is ~106 K (Bhatia & Landi 2008). The
82
intensity ratios of the emission lines from Ar14+ were used to diagnose coronal plasmas
83
(Landi et al. 2001; Saloman 2010). Therefore, investigating the recombination of
Be-84
like Ar will provide very useful information for astrophysics. It is noted that the
85
emission lines from highly charged argon have been investigated at an electron beam
86
ion trap EBIT (Lepson et al. 2003; Träbert et al. 2000). Here, we present absolute rate
87
coefficients for electron-ion recombination of Be-like argon from an experiment at the
88
main cooler storage ring CSRm and from theoretical calcuations using the
89
AUTOSTRUCTURE code.
90
For Be-like Ar14+, the experimental electron-ion collision energy range was 0-60 eV.
91
The most significant recombination channels in this energy range are
92
3
1
3 1 1
14 2 1 0 13 2 13 0,1,2 13 1 13 2
0,1,2 2 0
Ar (2 )
Ar [2 ] RR;
Ar [2 2 ( ) ] 10 DR; Ar [2 2 ( ) ] 7 DR;
Ar [2 ( ; ; ) ] 6 TR;
s S e
s nl
s p P nl n
s p P nl n
p P D S nl n
, , , , , , , (1) 93
where RR, DR, and TR denote radiative, dielectronic, and trielectronic recombination,
94
respectively. In RR, a free electron is captured into a bound state of the ion and a photon
95
is emitted. DR is a two-step process, a doubly excited intermediate state is formed
96
through a resonant process involving capture of a free electron and simultaneous
97
excitation of a bound electron, then the doubly excited state decays via photon emission
98
such that the charge state of the recombined ion is stablized. In the case of TR, the
99
capture is associated with the excitation of two core electrons to higher levels, and
100
completed when the triply excited intermediate level decays by photon emmision. The
101
excitation energies of the core electrons and lifetimes associated with ∆N= 0 (Here N 102
is the principal quantum number of the transition core electron ) DR and TR are listed
103
in Table 1.
105
Table 1. Excitation energies and lifetimes for ∆N=0 of Be-like Ar14+ levels. Numbers in 106
brackets denote powers of 10. The data cited from NIST is from the reference(Kramida et al.
107
2015). 108
Level
Energy Lifetime
NIST (eV)
(Wang et al. 2015)
(eV) (s)
1s2 2s21S0 0.00000 0.00000 ∞ 1s2 2s 2p3P0 28.3530 28.3604 4.2[6]a
1s2 2s 2p3P1 29.2429 29.2509 3.436[-07] 1s2 2s 2p3P2 31.3283 31.3383 1.543[-02] 1s2 2s 2p1P1 56.0630 56.0704 1.070[-10] 1s2 2p23P0 75.0000 75.0125 1.432[-10] 1s2 2p23P1 76.2776 76.2740 1.369[-10] 1s2 2p23P2 77.9000 77.9070 1.345[-10] 1s2 2p21D2 85.4889 4.789[-10] 1s2 2p21S0 104.224 104.196 6.9199[-11]
alifetime associated with E1M1 two photon transition taken from (Fritzsche, Surzhykov, & 109
Volotka 2015)
110
Storage-ring electron-ion recombination experiments have been performed on a
111
number of Be-like ions emphazising different physical topics. Astrophysical data needs
112
were specifically addressed with DR studies of C2+, N3+, O4+ (Fogle et al. 2005), F5+
113
(Ali et al. 2013), Ne6+ (Orban et al. 2008), Mg8+, (Schippers et al. 2004), Si10+
114
(Bernhardt et al. 2016; Orban et al. 2010), and Fe22+ (Savin et al. 2006). Other topics
115
were trielectronic recombination of Cl13+ (Schnell et al. 2003) and hyperfine-induced
116
transition rate measurements with Ti18+ (Schippers et al. 2007) and S12+ (Schippers et
117
al. 2012). In addition, the Be-like ions Ge28+ (Orlov et al. 2009) and Xe50+ (Bernhardt
118
et al. 2015) were employed to test QED and electron-electron correlation effects. It is
119
noted that the significance of TR was first observed for Be-like Cl13+ (Schnell, et al.
120
2003) and subsequently confirmed for several ions from this isoelectronic sequence.
121
For Be-like Mg, a distinct contribution from TR in the form of several sharp peaks was
122
also found (Schippers, et al. 2004). Toward higher Z ions, some TR resonance features
123
appear in the recombination spectrum of Ti18+ (Schippers, et al. 2007) whereas in case 124
of Fe22+ only one clear peak could be attributed to TR (Savin, et al. 2006).
125
Here, we report the first measurement of the electron-ion recombination spectrum of
126
Be-like Ar. The paper is structured as follows: The experimental method and the data
127
analysis are presented in Section 2. In Section 3, we give a brief description of the
128
theoretical method used by AUTOSTRUCTURE. In Section 4, the experimental results,
including merged-beam DR rate coefficients, and also plasma rate coeffiicients, are
130
presented and compared to currently available results in the literature. A conclusion is
131
given in section 5.
132
2. EXPERIMENT AND DATA ANALYSIS
133
Measurements were performed at the main cooler storage ring (CSRm) at the
134
Institute of Modern Physics (IMP) in Lanzhou, China. A detailed description of the
135
experimental setup and method for DR experiments at the CSRm has already been
136
given in the literature (Huang et al. 2015; Huang, et al. 2017). Here, we will only briefly
137
describe the electron-ion recombination experiment with Be-like Ar14+at the CSRm.
138
In the experiment 40Ar14+ ions were produced from an Electron Cyclotron Resonance
139
(ECR) ion source (Zhao et al. 2017) and accelerated to a beam energy of 6.928 MeV/u
140
by a Sector Focused Cyclotron (SFC), and then were injected into the CSRm. The
141
stored ion current was typically ~50 μA. The beam lifetime was about 50 seconds. The
142
electron cooler at the CSRm was employed to cool the ion beam, and was also used as
143
an electron target in the measurement. During the experiment, the ion beam was merged
144
with the electron beam over an effective interaction length of L= 4.0 m in the cooler
145
section. The electron beam was adiabatically expanded from the magnetic field of 125
146
mT at the electron-gun section to 39 mT at the electron-cooling section, thus a colder
147
electron beam was generated and a higher experimental resolution could be realized.
148
The diameter of the electron beam was measured to be ~50 mm at the cooling section,
149
with typical electron densities being ne = 1.1×106 cm-3.
150
During the measurement, the injected ion beam was first electron-cooled for several
151
seconds in order to decrease the diameter and the momentum spread of the ion beam.
152
Then the electron energy detuning system added a bias voltage to the cathode voltage
153
of the electron cooler to scan the electron beam energy according to a preset timing
154
sequence (Meng et al. 2013). This provided a nonzero relative kinetic energy between
155
electrons and ions. Downstream of the electron cooler, the recombined ions were
156
separated from the primary ion beam in the first bending magnet and detected by a
157
movable scintillator particle detector with nearly 100% efficiency (Wen et al. 2013).
158
During the measurement, a DC current transformer (DCCT) was used to monitor the
159
ion beam current in real time. Ion and electron beam position monitors (BPM) were
160
utilized to monitor the relative positions of the ion beam and the electron beam in the
161
cooling section. All of the DR measurements were performed under the condition of
162
keeping the electron beam and ion beam parallel along the axis of the cooler. In addition,
163
a Schottky pick-up was employed to monitor the revolution frequency and the
momentum spread of the ion beam, and to correct the experimental data in the off-line
165
data analysis (Wu et al. 2013).
166
In the DR experiments at heavy ion storage rings, the recombination rate coefficients
167
can be deduced from the background subtracted recombination counting rate R at a
168
relative energy Erelbetween electron and ion by (Bernhardt et al. 2011):
169
( )
(1 )
i e e i
R C
E
N n L
(2)
170
where Ni is the number of stored ions, ne is the density of electron beam, βe =e/c and 171
βi =ion/c are the velocities of electron beam and ion beam, L is length of the effective 172
interaction section, and C is the circumference of the storage ring.
173
3. THEORY
174
For a better understanding of the measured electron-ion recombination spectrum, a
175
theoretical calculation using the distorted-wave collision package AUTOSTRUCTURE
176
(Badnell 2011) was performed to calculate recombination cross-sections and rate
177
coefficients. AUTOSTRUCTURE is a versatile code that is able to calculate energy
178
levels, oscillator strengths, radiative/autoionization rates, and many other quantities
179
using semi-relativistic kappa-averaged wavefunctions. The underlying theory
180
implemented by AUTOSTRUCTURE for DR is well documented, however, we discuss
181
it briefly here. For a target ion 𝑋𝜈(𝑄) with a residual charge 𝑄, and initial state 𝜈,
182
colliding with an electron and recombining into an ion 𝑋𝑓(𝑄−1) with final state 𝑓, the
183
partial DR cross section 𝜎𝑓𝜈𝑄, energy averaged over a bin width 𝛥𝐸𝑐, can be expressed
184
as
185
𝜎𝑓𝜈𝑄(𝐸𝑐) =(2𝜋𝑎0𝐼𝐻)2𝜏0
𝐸𝑐 ∑
𝜔𝑗 2𝜔𝜈
∑ 𝐴𝑙 𝑗→𝜈,𝐸𝑐𝑙𝑎 𝐴𝑗→𝑓𝑟
∑ 𝐴ℎ 𝑗→ℎ𝑟 +∑𝑚,𝑙𝐴𝑗→𝑚,𝐸𝑐𝑙𝑎
𝑗 , (3)
186
where 𝜔𝜈 and 𝜔𝑗 are the statistical weights for the 𝑁 − and (𝑁 + 1) −electron
187
states respectively. The 𝐴𝑟 and 𝐴𝑎 are the radiative and autoionization rates
188
respectively, and 𝐸𝑐 is the energy of the continuum electron with angular momentum
189
𝑙, fixed by the position of the resonances. 𝐼𝐻 is the ionization energy of the hydrogen
190
atom, 𝑘𝐵 is the Boltzmann constant, and (2𝜋𝑎0)2𝜏0 = 2.6741 × 10⁻³²cm2s . The
191
sum over 𝑙 covers the angular momentum quantum numbers of the Rydberg electron.
192
The sum over 𝑗 covers all autoionization states. Lastly, the sum over ℎ and 𝑚
193
represents the total radiative and autoionization widths respectively.
For the 𝑁 −electron core configurations, we included 2𝑠2, 2𝑠2𝑝, and 2𝑝2, and for
195
the (N+1)-electron, we included 2𝑠22𝑝, 2𝑠2𝑝2, and 2𝑝3. No promotions from 1𝑠2
196
are included, and are hence omitted from the configuration list. For the recombined
197
Rydberg electron, radiative/autoionization rates were calculated explicitly for principal
198
quantum numbers 𝑛 = 3 up to 𝑛 = 100, after which the rates were calculated for
199
quasi-logarithmically spaced values of 𝑛 up to 𝑛 = 1000. Interpolation was then
200
used to obtain the remaining 𝑛. For each n, we calculated radiative/autoionization rates
201
for sufficiently many angular momentum quantum numbers l so as to numerically
202
converge the total DR rate coefficient to <1% over the temperature range
203
𝑄2(10 − 106)K.
204
In order to compare with the experimentally-derived electron-ion recombination rate
205
coefficients on the one hand and to calculate the plasma rate coefficient on the other
206
hand, the calculated recombination cross section σ() has to be convoluted with the
207
appropriate electron-velocity distribution to obtain the rate coefficients,
208
3
( )E = ( ) ( )f d
(4)209
where f() is the electron-velocity distribution. In case of the merged-beams rate
210
coefficient, it is a flattened Maxwellian (Kilgus et al. 1992) that is characterized by the
211
longitudinal and transverse temperatures T∥ and T⊥ with respect to the propagation
212
direction of the electron beam. In case of the plasma rate coefficient, f() is an isotropic
213
Maxwellian characterized by the electron temperature Te of the plasma.
214
4. RESULTS AND DISCUSSION 215
4.1Merged-beams DR rate coefficients 216
The DR spectra of Be-like 40Ar14+ obtained from the DR experiment at the CSRm
217
and from the AUTOSTRUCTURE calculations are compared and shown in Figure 1.
218
The measured spectrum covers the whole energy range of DR resonances associated
219
from 2s→2p (ΔN=0) core excitations. In the recombination spectrum, the resonance
220
positions of each Rydberg state can be well approximated by the Rydberg formula:
221
2
-res exc H
Q
E
E
I
n
(5)222
where Eexc is the core excitation energy of the ions, which is taken from the NIST
223
database. 𝐼𝐻 is the ionization energy of the hydrogen atom,and Q is the charge state
224
of the target ion. The associated Rydberg resonance series of the doubly excited
225
1 the experimental energy scale was recalibrated by a factor of 1.06 to achieve
227
agreement with the known 2s2p(1P1)nl series limit at 56.063 eV. As shown in Figure 2, 228
by fitting the first 13 resonance peaks at relative energy below 0.5 eV with a flattened
229
Maxwellian function each (Kilgus, et al. 1992),the longitudinal and transversal
230
electron temperatures were obtained, yielding kBT|| =2.40(6) meV and kBT⊥=11.91(87)
231
meV, respectively. The peak fit results are listed in Table 2. The numbers in parentheses
232
denote the uncertainties obtained from the fit and correspond to one standard deviation.
233
From the fit, it is concluded that the experimental energy resolution is less than 0.07 eV
234
full width at half maximum at relative energies around 0.2 eV.
235
[image:8.595.94.495.238.533.2]236
Figure 1. Electron-ion recombination rate coefficients of Be-like argon as a function of relative 237
collision energy. The energy scale of the experimental spectrum (connected filled circles) was 238
recalibrated by a factor of 1.06 to achieve agreement with the known 2s2p (1P
1) nl series limit 239
at 56.063 eV. Four ∆N = 0 DR series associate with 2s2→2s2p, 1P
1, 3P0, 1, 2 core excitations and
240
parts of five ∆N = 0 TR series (2s2→2p2, 1S0, 1D2, 3P0, 1, 2) can be observed. The corresponding 241
resonance positions are indicated by short bars in different colors. The calculated DR and TR 242
rate coefficients are shown by the gray area and the blue area, respectively. The sum of the 243
theoretical DR and TR contribution is shown as a solid red line. This curve accounts for the 244
experimental field-ionization cutoff (see text). The orange line from 45 eV to 60 eV is the 245
theoretical result including the full DR resonance strength up to nmax=1000, called the
field-246
248
Figure 2.Peak fit (the solid pink line) to the experimental low-energy DR rate coefficient (black 249
filled symbols). In the fit 13 -like resonances were convoluted with a flattened Maxwellian 250
electron-energy distribution which is characterized by the temperatures T|| and T⊥ in 251
longitudinal and transversal direction, respectively, with respect to the electron beam 252
propagation direction. The fit resulted in kBT|| =2.40(6) meV and kBT⊥=11.91(87) meV. The 253
individual peaks are shown as dashed pink lines. The fitted resonance energies and strengths 254
are given in Table 2. 255
Table 2. Results of the peak fits to the experimental merged-beams DR rate coefficient at 256
electron-ion collision energy below 3 eV (see Figure 2). The numbers in parentheses denote the 257
uncertainties obtained from the fit and correspond to one standard deviation. 258
Resonance energy (eV) Resonance strength (10-18 cm2 eV) 0.08269(84) 10.57(15)
0.14436(88) 13.32(15)
0.23232(94) 17.78(17)
0.3173(14) 8.25(17)
0.629(18) 0.57(12)
0.805(21) 0.56(12)
1.091(17) 11.51(17)
1.2786(63) 0.44(16)
1.450(18) 3.46(53)
1.6524(62) 17.27(41)
1.8005(85) 6.19(65)
2.1714(74) 2.58(12)
2.5327(52) 3.81(12)
In the experiment, the recombined ions have to travel through a toroidal magnet,
259
three quadrupole magnets and a dipole magnet before their detection. The electric field
[image:9.595.89.331.422.715.2]arising from these magnetic fields can ionize the recombined ions in high-n Rydberg
261
levels. As a result, the ions recombining into states with the outer electron having a
262
principal quantum number n> ncutoff will be field-ionized in the sperating dipole 263
magnet and cannot be detected. The critical quantum number ncutoff for field ionization 264
of an ion in a magnetic field can be estimated from the formula (Fogle, et al. 2005)
265
1 4 8
3 6.2 10
cutoff
i
n V mQ
B c
(6)
266
where Q is the charge state of the ion, i is the ion velocity, and B is the magnetic field
267
strength. In the present experiment the estimated cutoff quantum number in the charge
268
separating dipole magnet is ncutoff =74. The field-ionization effect can be seen at the
269
series limits of 2s2p(1P1)nl around 55 eV in Figure 1. Compared with the 2s2p (1P1)nl 270
series, the 2s2p(3PJ)nl series limits were not observed in the DR spectra. 271
To fully understand the measured electron-ion recombination rate coefficients a
272
convolution of the calculated DR resonance cross sections with the velocity distribution
273
of the electron beam was performed by AUTOSTRUCTURE as described in Section 3.
274
The gray area shows the theoretical DR rate coefficients with taking field ionization
275
into account. It turns out that the resonance peaks around 0.5 eV, 4 eV and 11 eV cannot
276
be fully identified by considering only the 2s2p(1P1)nl and 2s2p(3PJ)nl DR series 277
(Figure1). These peaks can be attributed to TR associated 2s2→2p2 (1S0, 1D2, 3P0, 1, 2) 278
core double-excitations as revealed by a separate calculation of TR contributions. The
279
calculated TR rate coefficients is shown as the blue shaded area in Figure 1. The sum
280
of the calculated DR and TR rate coefficients is shown as a solid red line. This curve
281
account for field ionization, i.e, it contains contribution of recombination resonance
282
from Rydbergy levels up to 150 by taken into account of time-of-flight survival
283
probabilities for n, as described in (Schippers et al. 2001). An additional calculation
284
including DR and TR contributions from capture into Rydberg states up to nmax=1000 285
from 45 eV to 60 eV is shown in Figure 1 as a solid orange line, called the
field-286
ionization-free electron-ion recombination rate coefficient. Agreement between
287
calculated results and experimental rate coefficients was found that better than 30% for
288
the whole energy range. However, there is a discrepancy in resonance positions and
289
intensity at energy less than 0.5 eV. It is due to electron-electron correlation effects. The
290
intensity of resonances at 11 eV and 23 eV is not well produced by
291
AUTOSTRUCTURE, either.
292
It should to be noted that, Be-like ions are known to have long-lived 2s2p3PJ levels 293
(J=0, 1, 2) which might be present in the ion beams used for the experiment. For
like 40Ar14+ ion which has zero nuclear spin, the lifetimes of energy levels of 2s2p(3P1) 295
and 2s2p(3P2) are very short (as listed in Table 1) and these two metastable levels will 296
not survive as the measurements were performed after several seconds of
electron-297
cooling. However, the lifetime of metastable level 3P0 is very long and can only decay 298
by E1M1 two-photon transition. As a result, ions in the metastable state of 3P0 are 299
expected to have been present in the ion beam during the experiment. In order to
300
determine the rate coefficient for the ground level of the ion, the contribution from the
301
metastable level should be considered. However, in case of the Be-like Ar14+ there is
302
an unknown fraction of metastable ions in the primary beam. As described in (Orban,
303
et al. 2008), ion beams extracted from ECR ion sources showed a decreasing percentage
304
of metastable content with increasing charge along the Be-like isoelectronic sequence.
305
The metastable contents amount to 60%, 40%, 35%, 14% and 10% for C2+, N3+, O4+, 306
Ne5+ and Si10+ ion beams, respectively (Orban, et al. 2008; Orban, et al. 2010). Since
307
we have also used an ECR ion source in this experiment, we estimated the maximum
308
metastable contents amount to be 5% in the case of Be-like Ar14+ in our experiment. In
309
addition, a separate calculation of electron-ion recombination for 2s2p (3P
0) metastable 310
ions by AUTOSTRUCTURE was performed. In the range of the ∆N=0 DR resonances,
311
the calculation showed very weak metastable DR resonant strengths and its contribution
312
can be safely neglected. However, at high temperature the metastable contribution to
313
the plasma rate coefficient becomes comparable with that from the ground because of
314
the strong 2p-3d promotion.
315
The uncertainty of the experimental recombination rate coefficients is estimated to
316
be about 30% (at a one-sigma confidence level), including 5% uncertainty of the
317
estimated metastable content of the Ar14+ ions, an uncertainty of 15% due to 318
combination of counting statistics, electron and ion beam currents, and interaction
319
length, and an uncertainty of 20% due to the electron density distribution profile and
320
also the position of the ion beam in this profile.
321
4.2Plasma recombination rate coefficients 322
As mentioned above, storage ring measured electron-ion recombination rate
323
coefficients are different from the plasma rate coefficients which were used for
324
astrophysics modelling. In contrast to the very narrow velocity spread of the electron
325
beam in a storage ring experiment, the electrons in astrophysical plasmas have a much
326
broader and isotropic Maxwellian velocity spread. Therefore, the plasma rate
327
coefficient can be obtained by convoluting the DR cross section (E) with a
Maxwell-328
with E = me2/2 and electron rest mass me). At electron-ion energies E >> kBT⊥ the DR
330
cross section (E) can be obtained as (E)/ where (E) denotes the measured
merged-331
beams rate coeffcient. At lower energies the influence of the experimental energy
332
spread becomes noticeable and, consequently, a different approach for the derivation
333
of the plasma rate coefficient has to be applied. Here, this concerns about the four
334
lowest-energy resonances from Table 2. In particular, the lowest-energy resonance
335
appears at an energy lower than kBT⊥.For these resonances, the DR cross section as
336
obtained from the peak fit was used in the convolution procedure following the
337
procedure laid out by (Schippers, et al. 2004).
338
The experimentally-derived and theoretically calculated plasma rate coefficients as a
339
function of electron temperature are shown in Figure 3 as the solid red line and the
short-340
dashed red line, respectively. Both lines account for the field-ionization effect discussed
341
above. The theoretically calculated DR and TR contributions are shown in Figure 3 by
342
the black dashed line and the blue dot-dashed line, respectively. In order to compare the
343
experimental result to different theoretical models, the experimental recombination rate
344
coefficient from 45 eV to 60 eV was replaced by the AUTOSTRUCTURE calculation
345
including recombination into states up to nmax=1000 (the solid orange line in Figure 1).
346
Such a derived field-ionization-free plasma rate coefficient is shown as a gray shaded
347
area in Figure 3. It should be noted that the contribution from recombination into
348
resonance levels with n˃1000 was considered very small and can be safely neglected. 349
The temperature range is from 103 K to 107 K in Figure 3. It includes the ranges of
350
photoionized and collisionally ionized plasmas for Be-like Ar. The boundaries of these
351
temperature ranges are displayed by vertical dashed bars. These mark the temperatures
352
where the fractional abundance of Be-like Ar is 10% of its maximum value (Bryans,
353
Landi, & Savin 2009; Kallman & Bautista 2001). At a temperature of 103 K the TR
354
contribution is a factor of four larger than the DR contribution. In the temperature range
355
of photoionized plasmas, the TR contribution to the total plasma rate coefficient
356
amounts to 10%. Finally, agreement of better than 30% for the whole temperature range
357
is found between the present experimentally-derived rate coefficients and the current
358
AUTOSTRUCTURE calculations.
360
Figure 3.Plasma rate coefficents of Be-like Ar14+ as a function of the electron temperature. The 361
solid red line is the experimentally-derived ∆N = 0 DR and TR rate coefficients. The theoretical 362
results deduced from the AUTOSTRUCTURE code for ∆N = 0 DR and for TR are shown as a 363
dotted black line and a dash-dotted blue line, respectively. The calculated sum of DR and TR 364
is shown as a short-dashed red line. The experimentally-derived field-ionization-free plasma 365
rate coefficient is shown as gray area. The approximate temperature ranges where Ar14+ is 366
expected to form in photoionized plasmas and collisionally ionized plasmas are indicated by 367
vertical dashed bars and associated arrows (Bryans, et al. 2009; Kallman & Bautista 2001). 368
In order to compare with other recommended theoretical data in the literature and to
369
make convenient use of the presently measured results in plasma modeling, the ∆N=0
370
resonant plasma rate coefficients were fitted with the function
371
3 2
( ) exp( i )
e e i
i e
E
T T c
kT
(7)
372
The fit parameters of ci and Ei are listed in Table 3, and reproduce the data within
373
2% at ~103 K and better than 1% up to 107 K.
374
Table 3. Fitted coefficients for the RR-subtracted ∆N=0 DR+TR rate coefficients from Figure 375
3 for two different values of ncutoff and nmax=1000 (field-ionization free). The units of ci and Ei 376
are 10-3 cm3 s-1 K3/2 and eV, respectively. 377
No. ncutoff nmax=1000
i ci Ei ci Ei
1 0.254 0.12 0.244 0.115 2 0.580 0.28 0.590 0.278
3 3.74 3.47 3.77 3.45
4 5.17 1.43 5.14 1.43
[image:13.595.194.404.640.769.2]7 38.84 56.39 40.30 57.03
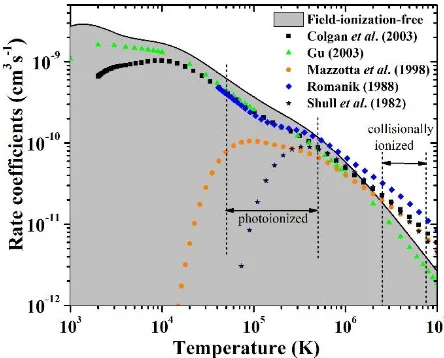
In Figure 4, the experimentally-derived field-ionization-free plasma rate coefficients
378
including DR and TR are compared with the theoretical data from the literature. The
379
temperature ranges where Ar14+ forms in collisionally ionized plasmas and
380
photoionized plasmas are indicated by vertical dashed bars as same as shown in Figure
381
3. Among the literature data, only the theoretical calculations from (Colgan, et al. 2003)
382
and (Gu 2003) provide plasma rate coefficients at low temperatures. The calculations
383
of (Colgan, et al. 2003) used AUTOSTRUCTURE and (Gu 2003) used FAC code. It
384
should be noted that the plot of (Colgan, et al. 2003) as shown in Figure 4 is fitted by
385
using the revised fit on the website of ADAS (Badnell 2009). The other calculations
386
yielded plasma rate coefficients only at temperatures higher than 104 K.
387
At a temperature of 104 K, the calculated plasma rate coefficients from (Colgan, et
388
al. 2003) and (Gu 2003) are 30% lower than experimental data. In the temperature range
389
around 2×10⁵ K, where Be-like Ar is expected to be abundant in photonionized plasmas, 390
the calculated plasma rate coefficients from (Colgan, et al. 2003; Gu 2003; Romanik
391
1988) are 30% lower than the experimental results, and the data from (Mazzotta et al.
392
1998; Shull & Van Steenberg 1982) are about 60% lower than experimental data.
393
At a temperature of about 3×10⁶ K where Ar14+ is supposed to be abundant in
394
collisionally ionized plasmas, the theoretical data of (Gu 2003) are 25% lower than the
395
experimental results. The calculated data from (Colgan, et al. 2003), (Mazzotta, et al.
396
1998), (Romanik 1988) and (Shull & Van Steenberg 1982) is 30%, 15%, 80%, and 30%
397
higher than the experimental data. Above 6×10⁶ K, the calculation of (Gu 2003) is about
398
25% lower than the experimental data, but the calculations of (Colgan, et al. 2003;
399
Mazzotta, et al. 1998; Romanik 1988; Shull & Van Steenberg 1982) are all more than
400
30% higher than the experimental data. It should be noted that the calculation of (Gu
401
2003) shown in Figure 4 only included transitions for ∆N=0, and the data from (Colgan,
402
et al. 2003; Mazzotta, et al. 1998; Romanik 1988; Shull & Van Steenberg 1982) shown
403
in Figure 4 included the transitions for ∆N=0 and ∆N=1. As a result, DR through
404
excitation of the 2s electron to higher shells (∆N > 0 DR) and also through excitation
405
of a 1s electron which is not included in the experimental data could be the reason for
406
this discrepancy. It should be noted that better than 2% between the current calculation
407
by AUTOSTRUCTURE code (as shown in Figure 3 as a short-dashed red line) and the
408
data from (Colgan, et al. 2003) is found if only taking into account of ∆N=0 core
409
electron excitation. In a short summary, agreement within about 35% was found
between experimentally-derived plasma rate coefficients and theoretical calculations
411
by (Colgan, et al. 2003) and (Gu 2003) in the temperature range from 104 K to 107 K.
412
[image:15.595.185.407.122.301.2]413
Figure 4. Comparison of field-ionization-free resonant plasma recombination rate coefficients 414
with theoritical calculated results of Be-like Ar. Full squares show rate coeficients by (Colgan,
415
et al. 2003). Calculations by (Gu 2003) and (Mazzotta, et al. 1998) are shown by full triangles 416
and full circles, respectively. Rate coefficients of (Romanik 1988) and (Shull & Van Steenberg
417
1982) are shown by full diamonds and stars, respectively. Temperature ranges where the Be-418
like Ar concentration is higher than 10% of its maximum abundance in photoionized and 419
collisionally ionized plasmas are shown by vertical dashed bars as in Figure 3 (Bryans, et al.
420
2009; Kallman & Bautista 2001). 421
5. CONCLUSIONS 422
Electron-ion recombination rate coefficients of Be-like Ar14+ forming into B-like
423
Ar13+ were derived from a measurement performed by employing the electron-ion 424
merged-beams method at the cooler storage ring CSRm. No previous experimental
425
results were available for this ion. The resonances associated with dielectronic
426
(2s2→2s2p) and trielectronic (2s2→2p2) ∆N=0 recombination within the energy range
427
of 0 ̶ 60 eV were investigated and identified by application of the Rydberg formula.
428
Agreement in terms of DR resonance positions and strengths was found better than 10%
429
and 30%, respectively, between the experimental recombination rate coefficient and the
430
newly calculated results using the distorted wave code AUTOSTRUCTURE. The TR
431
resonance positions and strenghts were also reproduced by the AUTOSTRUCTURE
432
calculation.
433
For use in plasma modelling, the plasma recombination rates coefficient was deduced
434
from the merged-beams recombination rate coefficients. The temperature range of this
435
where the ions are abundant both in photoionized and collisionally ionized plasmas.
437
The experimentally-derived plasma rate coefficient was compared with the calculated
438
data from existing literature. At the temperature range of photoionized plasmas, the
439
experimentally-derived rate coefficient is still up to 30% larger than the more recent
440
results of (Gu 2003), (Romanik 1988) and (Colgan, et al. 2003). For temperatures
441
higher than 106 K, the experimentally derived plasma rate coefficients are lower than
442
the calculated data from the literature except for (Gu 2003) which only showed ∆N=0
443
core electron excitation. Agreement of better than 30% for the whole temperature range
444
was found between the present experimentally-derived plasma rate coefficients and the
445
calculated results from AUTOSTRUCTURE. Our data thus provide a stringent
446
benchmark for Ar14+ recombination data used in astrophysical modelling.
447
Acknowledgements 448
This work is partly supported by the National Key R&D Program of China under
449
Grant No. 2017YFA0402300, the National Natural Science Foundation of China
450
through No. 11320101003, No. 91336102, No. U1732133, No. 11611530684, the
451
Strategic Priority Research Program of the Chinese Academy of Sciences, Grant No.
452
XDB21030900 and Key Research Program of Frontier Sciences, CAS, Grant No.
453
QYZDY-SSW-SLH006. W. Wen thanks the support by the Youth Innovation
454
Promotion Association CAS. S. P. Preval and N. R. Badnell acknowledge the support
455
of EPSRC grant EP/L021803/1. S. Schippers gratefully acknowledges support by the
456
CAS President’s International Fellowship Initiative (PIFI). A helpful discussion with
457
R. Schuch is acknowledged. The authors would like to thank the crew of Accelerator
458
Department for skillful operation of the CSR accelerator complex.
459
References 460
Ali, S., Orban, I., Mahmood, S., Loch, S. D., & Schuch, R. 2013, A&A, 557, A2
461
Badnell, N. R. 2009, Atomic and Molecular Diagnostic Processes in Plasmas,
462
http://amdppphysstrathacuk/tamoc/DATA/DR/
463
Badnell, N. R. 2011, Computer Physics Communications, 182, 1528
464
Beiersdorfer, P. 2003, Annual Review of Astronomy and Astrophysics, 41, 343
465
Bernhardt, D., et al. 2016, Journal of Physics B: Atomic, Molecular and Optical Physics, 49, 074004
466
Bernhardt, D., et al. 2015, Journal of Physics B: Atomic, Molecular and Optical Physics, 48, 144008
467
Bernhardt, D., et al. 2011, Physical Review A, 83, 020701
468
Bhatia, A. K., & Landi, E. 2008, Atomic Data and Nuclear Data Tables, 94, 223
469
Brandau, C., & Kozhuharov, C. 2012, in Atomic Processes in Basic and Applied Physics, eds. V. Shevelko,
470
& H. Tawara (Berlin, Heidelberg: Springer Berlin Heidelberg), 283
471
Brandau, C., Kozhuharov, C., Lestinsky, M., Müller, A., Schippers, S., & Stöhlker, T. 2015, Physica Scripta,
472
2015, 014022
Bryans, P., Landi, E., & Savin, D. W. 2009, The Astrophysical Journal, 691, 1540
474
Burgess, A. 1964, The Astrophysical Journal, 139, 776
475
Colgan, J., Pindzola, M. S., Whiteford, A. D., & Badnell, N. R. 2003, A&A, 412, 597
476
Dere, K., Landi, E., Young, P., & Del Zanna, G. 2001, The Astrophysical Journal Supplement Series, 134,
477
331
478
Fogle, M., et al. 2005, A&A, 442, 757
479
Fritzsche, S., Surzhykov, A., & Volotka, A. 2015, New Journal of Physics, 17, 103009
480
Gu, M. F. 2003, The Astrophysical Journal, 590, 1131
481
Huang, Z. K., et al. 2015, Phys Scripta, T166, 014023
482
Huang, Z. K., et al. 2017, Nuclear Instruments and Methods in Physics Research Section B: Beam
483
Interactions with Materials and Atoms, 408, 135
484
Kallman, T., & Bautista, M. 2001, The Astrophysical Journal Supplement Series, 133, 221
485
Kallman, T. R., & Palmeri, P. 2007, Reviews of Modern Physics, 79, 79
486
Kilgus, G., Habs, D., Schwalm, D., Wolf, A., Badnell, N. R., & Müller, A. 1992, Phys Rev A, 46, 5730
487
Kramida, A., Ralchenko, Y., Reader, J., & Team, N. A. 2015, Available: http://physicsnistgov/asd
488
Landi, E., Doron, R., Feldman, U., & Doschek, G. A. 2001, Astrophy J, 556, 912
489
Lepson, J., Beiersdorfer, P., Behar, E., & Kahn, S. 2003, The Astrophysical Journal, 590, 604
490
Müller, A. 2008, in Advances In Atomic, Molecular, and Optical Physics, eds. P. R. B. Ennio Arimondo, &
491
C. L. Chun (Academic Press), 293
492
Mazzotta, P., Mazzitelli, G., Colafrancesco, S., & Vittorio, N. 1998, Astron Astrophys Suppl Ser, 133, 403
493
Meng, L.-J., et al. 2013, Chinese Physics C, 37, 017004
494
Orban, I., Böhm, S., Loch, S. D., & Schuch, R. 2008, A&A, 489, 829
495
Orban, I., Loch, S. D., Böhm, S., & Schuch, R. 2010, The Astrophysical Journal, 721, 1603
496
Orlov, D. A., et al. 2009, Journal of Physics: Conference Series, 163, 012058
497
Paerels, F. B. S., & Kahn, S. M. 2003, Annual Review of Astronomy and Astrophysics, 41, 291
498
Romanik, C. J. 1988, The Astrophysical Journal, 330, 1022
499
Saloman, E. B. 2010, Journal of Physical and Chemical Reference Data, 39, 033101
500
Savin, D. W. 2007, Journal of Physics: Conference Series, 88, 012071
501
Savin, D. W., et al. 2006, The Astrophysical Journal, 642, 1275
502
Schippers, S. 2012, Journal of Physics: Conference Series, 388, 012010
503
Schippers, S. 2015, Nuclear Instruments and Methods in Physics Research Section B: Beam Interactions
504
with Materials and Atoms, 350, 61
505
Schippers, S., et al. 2012, Physical Review A, 85, 012513
506
Schippers, S., Müller, A., Gwinner, G., Linkemann, J., Saghiri, A. A., & Wolf, A. 2001, The Astrophysical
507
Journal, 555, 1027
508
Schippers, S., et al. 2007, Physical Review Letters, 98, 033001
509
Schippers, S., Schnell, M., Brandau, C., Kieslich, S., Müller, A., & Wolf, A. 2004, A&A, 421, 1185
510
Schnell, M., et al. 2003, Physical Review Letters, 91, 043001
511
Schuch, R., & Böhm, S. 2007, Journal of Physics: Conference Series, 88, 012002
512
Shull, J. M., & Van Steenberg, M. 1982, The Astrophysical Journal Supplement Series, 48, 95
513
Träbert, E., et al. 2000, The Astrophysical Journal, 541, 506
514
Wang, K., et al. 2015, The Astrophysical Journal Supplement Series, 218, 16
515
Wen, W. Q., et al. 2013, Nucl Instrum Meth B, 317, 731
516
Wu, J. X., et al. 2013, Nuclear Instruments and Methods in Physics Research Section B: Beam
Interactions with Materials and Atoms, 317, Part B, 623
518
Zhao, H. W., et al. 2017, Physical Review Accelerators and Beams, 20, 094801