CLIMATES OF NEPAL AND THEIR IMPLICATIONS FOR AGRICULTURAL DEVELOPMENT
By
JÄNAK L. NAYAVA
Thesis submitted for the degree of Doctor of Philosophy at the Australian
National University.
v.-o»_aJC.
I ll
ABSTRACT
Agroclimatological data play an important role in the socio
economic development of any country. These data may provide the scientific agricultural base needed in planning for the optimum production of various crops in different regions. There have been very few studies on agroclima tology for Nepal, due to the limited availability of normal climatological data. Therefore, the objective of this research is to develop and test methods of expansion using standard climatological data to obtain a
practical guide for agricultural planning at the regional level of Nepal.
While there are only a few stations with long term climatic records in Nepal, there are many sites with records less than the con ventional thirty year period. A comprehensive data set of 10 elements for 168 sites has been developed based on extrapolation fron the long term, the partial and the incomplete data records. Mean monthly rainfall was based
on those stations with more than 20 years of record and on stations where the missing data over the twenty year period were estimated by regression techniques using the closest station with records. A regression relation ship between mean temperatures, dew point, maximum and minimum at stations with six years of record and other environmental parameters; latitude,
longitude, elevation and rainfall was used to estimate the temperatures for the network. The substitution of a shorter period for the above elements was found to introduce only small errors when the data sets were conpared against the available long term data.
estimated by regression selectively applied to regional areas. These areas are homoclimates of tenperature and rainfall identified using a numerical taxonomy and each area contained at least one site recording sunshine hours. Six homoclines sufficiently defined conditions in Nepal; 2 in the
Tarai, 3 in the Hills and one for the Mountains. Where actual mean monthly wind run was not available, an average frcm all Nepalese stations was
substituted for missing data. In this way the analysis has closed the large gap between the sparse data available and the data necessary for investigating applied environmental relationships.
A study of the topoc 1 imatology of the Kathmandu Valley was under taken to demonstrate mesoscale variation in the climate that could be expected for other localities. Data for rainfall, maximum and minimum temperatures were estimated by regression techniques for 1225 points cn a 900m grid. Global solar radiation was estimated at 394 points using an atmospheric attenuation model which considered the energy receipt cn
inclined surfaces. The potential evapotranspiration estimating frcm the same 394 points was based cn the above radiation estimates and potential evapotranspiration derived frcm Kathmandu data. The variety of climatic regions associated with the Kathmandu Valley were identified as follcws using numerical taxonomy;
(i) the humid valley floor and mountain top (ii) the subhumid south facing slopes
(iii) the vet, gentler north facing slopes; and
(iv) wettest of all, the steeper north facing slopes.
The derived data sets transformed to mean weekly information provided the base input into a climatic-crop growth model "GRDWEST"
V
TABLE OF CONTENTS
Page
ABSTRACT III
LIST OF FIGURES XII
LIST OF TABLES XVIII
PREFACE XXI
ACKNOWLEDGEMENTS XXII
CHAPTER
1 INTRODUCTION 1
1.1 Background and Approach 1
1.2 History of the Nepal Meteorological
Service 2
1.3 Previous Work of this kind in Nepal 3
1.4 Natural Landscapes of Nepal 4
1.5 Climate 6
1.6 Vegetation 8
1.7 Population and Agricultural Activities 11
1.8 Water Resources 11
2 CLIMATIC ELEMENTS OF NEPAL 13
2.1 Introduction 13
2.2 Rainfall 14
2.2.1 General Features of the Atmospheric
Circulation over Nepal 14
2.2.2. Rainfall Data 19
2.2.3 Analysis 21
2.2.3.1 Mean Monsoon and Annual Rainfall 21 2.2.3.2 The Date of the Onset and Cessation of
the Monsoon 27
2.2.3.3 Intensity of Rainfall 30
V I I
Page CHAPTER
2.3 Temperature 32
2.3.1 Review of Extrapolation Models 32
2.3.2 Derivation of Extrapolation Models 33 2.3.3 Interpolation of Weekly Data and Derivation
of Extreme Mean Values 41
2.3.4 Discussion 42
2.4 Climatic Regimes Based on Temperature
and Rainfall 45
2.4.1 Method of Analysis 45
2.4.2 Data and Classification 46
2.4.3 Discussion 54
2.5 Solar Radiation 55
2.5.1 Introduction 55
2.5.2 Kathmandu .Global' Solar Radiation DAtd 56 2.5.2.1 Sunshine Hours-Solar Radiation Relations
at Kathmandu 56
2.5.3 Sunshine Hours Observed in Nepal 61 2.5.3.1 Derivation of Extrapolation Models 61 2.5.3.2 Distribution of Sunshine Hours 61 2.5.4 Global Solar Radiation Es t i m a t i o n For 61 2.5.4.1 Spatial Variation of Global Solar Radiation
over Nepal 66
2.5.5 Discussion 70
2.6 Evaporation 72
2.6.1 Introduction 7 2
2.6.2 Development of the Penman Equation 73 2.6.2.1 The Radiation Balance Component (Qn ) 74
2.6.2.2 The Aerodynamic Term (E_) 76
O.
2.6.2.3 The Priestly-Taylor Equations 77 2.6.3 Data for the Penman Equation in Nepal 78
Discussion
CHAPTER Page
3 THE TOPOCLIMATOLOGY OF THE KATHMANDU VALLEY 89
3.1 Introduction 89
3.1.1 Physical Description of the Kathmandu
Valley 89
3.2 Areal Rainfall in the Kathmandu Valley 90
3.2.1 Methods for Areal Rainfall Analysis 92
3.2.2 Data and Constructing the Isohyet Maps 94
3.2.3 Distribution of E infall in the Kathmandu 99
Valley
3.2.3.1 Mean Monsoon and Annual Rainfall 105
3.2.3.2 The Variation and Intensity of Rainfall 105
3.2.3.3 Conclusion 105
3.3 Distribution of tenperature in the Kathmandu
Valley 108
3.3.1 Data and Methods 108
3.3.2 Application 109
3.3.2.1 Lapse Rate of Tenperature 112
3.3.2.2 General Characteristics of Tenperature at a
Point 116
3.4 Solar Radiation in the Kathmandu Valley 116
3.4.1 Introduction 116
3.4.2 Radiation to Inclined Surfaces Relative to
Horizontal Surfaces 118
3.4.3 The Basic Computer Model 119
3.4.3.1 Parameter Derivation 125
3.4.4 Application of the Model to Sloping Sites 129
3.4.5 Distribution of Insolation in the Kathmandu
Valley 133
3.4.6 Spatial Distribution of Radiation in the
Kathmandu Valley 136
IX
CHAPTER Page
3.5 Distribution of Potential Evapotranspiration
in the Kathmandu Valley 139
3.6 Wind 141
3.7 Cloud and Sunshine 144
3.8 Humidity 144
3.9 Topoc 1 imatology of the Kathmandu Valley 147
3.9.1 Introduction 147
3.9.2 Classification of Climate 149
3.9.3 Conclusion 155
4 WATER BALANCE-MOISTURE INDEX 156
4.1 Methods 156
4.2 Data 158
4.3 Analysis 158
4.3.1 Spatial Variation in the Water Balance,
Nepal 160
4.3.2 Temporal Variation in the Water Balance,
Kathmandu 160
4.3.2.1 Cumulative and Relative Frequency of Dates of the Onset and Cessation of the Monsoon,
Kathmandu 165
4.3.2.2 Discussion 167
5 THE MACROCLIMATIC ENVIRONMENT IN NEPALESE PLANT
ECOLOGY 169
5.1 Introduction 169
5.2 Present Land Use 170
5.2.1 Regional Variation of Agriculture 171 5.2.2 Distribution of Major Crops and Yields 173
5.2.3 Seasonal Cropping Patterns 176
5.2.4 Land Tenure, Characteristics of Farming
and Irrigation 178
Agricultural Extension Program 182
Page CHAPTER
5.3 Review of Crop Weather Analysis 183
5.3.1 Data 186
5.3.2 Analysis 187
5.3.2.1 Spatial Variation of Grcwth Index 188 (a) Tropical species (optimum temperature 28°C) 188 (b) Warm tenperate species (optimum tenperature
19°C) 190
(c) Cool terrperate species (optimum tenperature
10°C) 190
5.3.2.2 Selection of Stations in Cross-Sectional
Area of Nepal 193
(a) Characteristics of environment indices at
different climatic regions 195
5.3.2.3 The Mesoscale climatic Environment, Kathmandu
Valley 215
5.3.2.4 Grcwth Index and Crop Yield 217
5.3.2.5 Discussion 224
XI
Page
APPENDIX IA Serial Number and Name of the Station 229
IB Listing of Stations 231
II Climatic Tables for Nepal 234
III Classification of Rainfall and Temperature
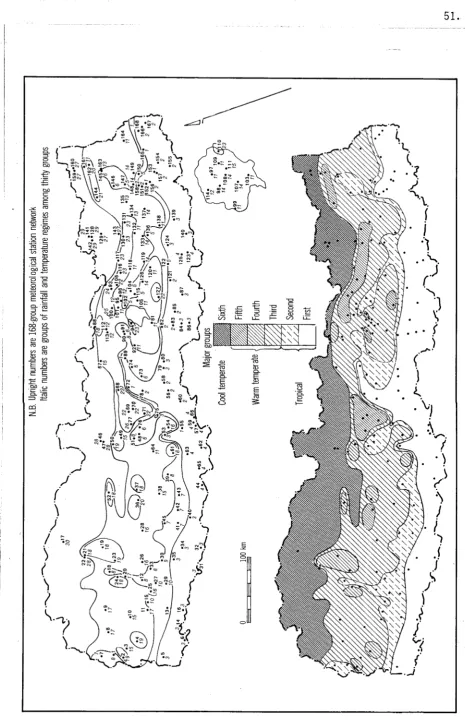
Regimes of 168 Stations, Nepal 259
IV Classification of 394 Grid Point Stations,
Kathmandu Valley 261
V The Conversion Table from Month to Week 263
VI The Distribution of Cultivated Land,
Production and Yield in Three Distinct
Geographical Regions of Nepal, 1968-1977 265
VII Selected Grid Point Climatic Data, Kathmandu
Valley 267
APPENDIX A Computer Program 269
APPENDIX B Curriculum Vitae of Candidate 270
APPENDIX C Published Articles based on this Thesis 272
APPENDIX D List of Requests for Thesis Data 273
LIST OF FIGURES
Page FIGURE
1.1 Idealised cross section of Nepal 5
1.2 Map of Nepal, shewing Tarai, Hill
and Mountain Regions 7
1.3 Modified principal zones of
precipitation 9
1.4 Nepal, forest cover 10
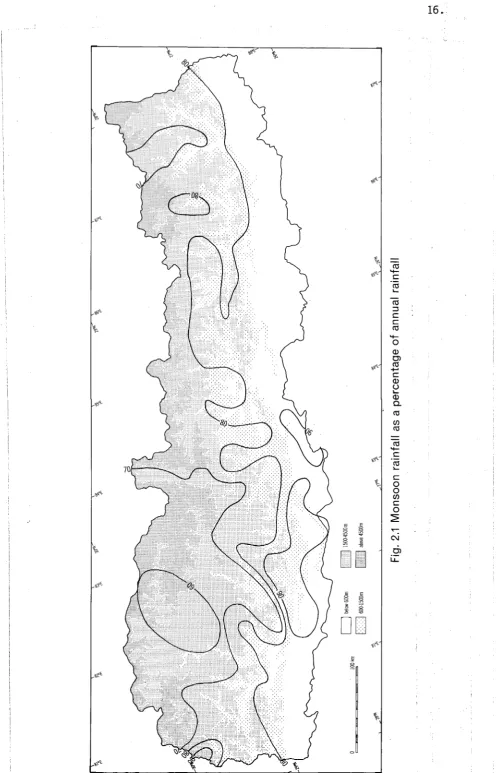
2.1 Monsoon rainfall as a percentage of
annual rainfall 16
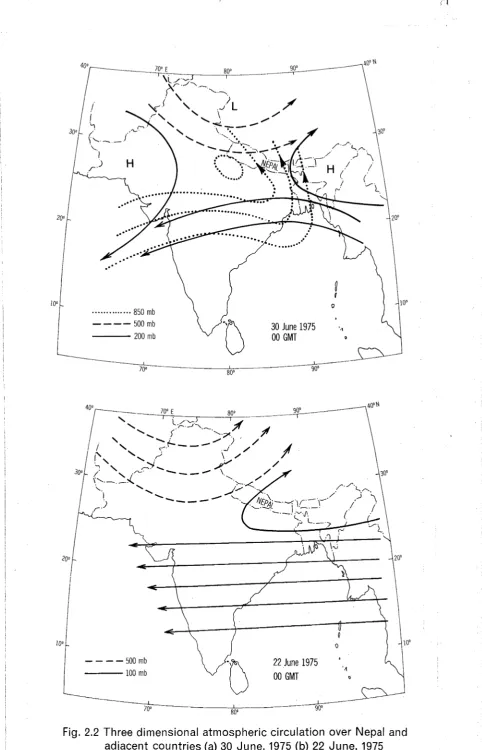
2.2 Three dimensional atmospheric
circulation over Nepal and adjacent countries (a) 30th June 1975,
(b) 22nd June 1975 18
2.3 Percentage of deviation fron the mean rainfall and number of years
(1975-1921). 20
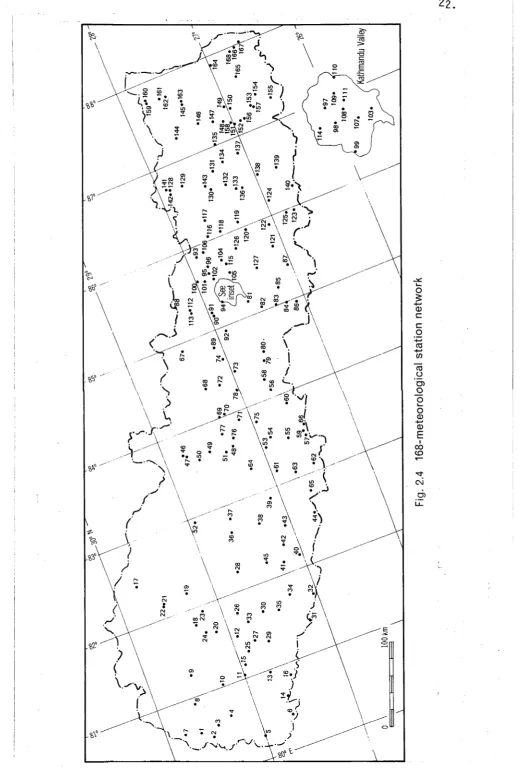
2.4 168 meteorological station netwsrk 22
2.5 Mean monthly rainfall 23
2.6 Mean monsoon rainfall 24
2.7 Mean annual precipitation 25
2.8 Normal dates of (a) the onset and (b) the retreat of summer monsoon,
Kathmandu. 28
2.9 Normal dates of (a) onset and (b) retreat of summer monsoon in the
Indian Subcontinent 29
2.10 Selected temperature stations 34
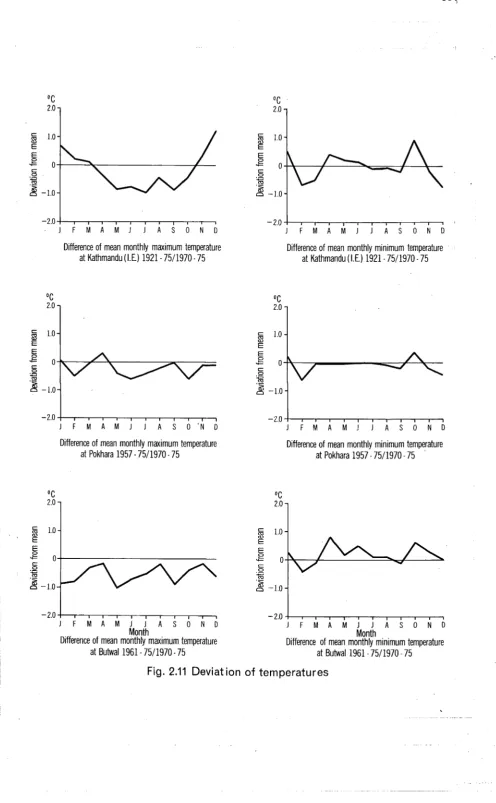
2.11 Deviation of temperatures 35
2.12 Variation of temperatures 40
2.13 Mean maximum temperature, hottest
week 43
2.14 Mean minimum temperature, coldest
week 44
2.15 Dendrogram of 30 groups of MULCLAS classification of 168 meteorological
X I I I
Page FIGURE
2.16 Major rainfall and terrperature
regimes 51
2.17 Relationship between solar radiation
(q/q ) and duration of sunshine (n/N ) A
59 for monthly periods at Kathmandu
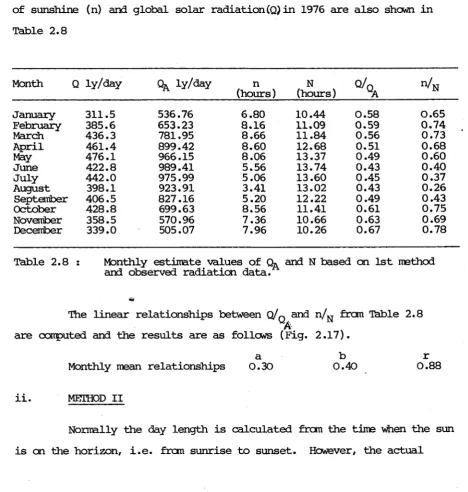
2.18 Relationship between monthly mean
values of duration of sunshine
(n/^) and precipitation 63
2.19 January: global solar radiation 67
2.20 April : global solar radiation 68
2.21 July : global solar radiation 69
2.22 October: global solar radiation 71
2.23 The relationship between dew point
tenperature against altitude (a) January
(b) July 79
2.24 Mean monthly potential evaporation
and precipitation 85
2.25 Relationship between mean monthly
values of Penman Potential evaporation and Class A Pan
evaporation at Kathmandu 86
2.26 Comparison between mean monthly values of
Class A Pan evaporation and potential
(Penman) evaporation at selected places. 87
3.1 Operating meteorological stations,
Kathmandu Valley 91
3.2 Topography of the study area,
Kathmandu Valley 91
3.3 March : mean monthly rainfall 101
3.4 April : mean monthly rainfall 101
3.5 May : mean monthly rainfall 102
3.6 June : mean monthly rainfall 102
3.7 July : mean monthly rainfall 103
3.8 August : mean monthly rainfall 103
3.9 September : mean monthly rainfall 104
Page FIGURE
3.11 Mean monsoon rainfall 106
3.12 Mean annual rainfall 106
3.13 Variation of annual and monsoon
rainfall, Kathmandu (I .E .) 107
3.14 Annual maximum 24 hourly rainfall,
Kathmandu (I.E.) 107
3.15 January : mean minimum temperature 111
3.16 January : mean maximum temperature 111
3.17 April : mean minimum temperature 113
3.18 April : mean maximum temperature 113
3.19 July : mean minimum temperature 114
3.20 July : mean maximum tenperature 114
3.21 October : mean minimum tenperature 115
3.22 October : mean maximum tenperature 115
3.23 Mean monthly tesrperature and rainfall
at Kathmandu 117
3.24 (a) Partition diagrams in incoming
short wave radiation
(b) Schematic diagrams of solar
radiation 121
3.25 Global solar radiation on different
aspects with cloudless sky at
Kathmandu, Lat 27 42'N. 132
3.26 Global solar radiation on different
aspects with average conditions of
sky, Kathmandu, Lat 27 42'N. 134
3.27 Conputed total solar radiation at the
top of the atmosphere and observed mean month global solar radiation at
Kathmandu 135
3.28 January : clear day global solar
radiation 137
3.29 July : clear day global solar
radiation 137
3.30 January : average day global solar
radiation 138
3.31 July : average day global solar
XV
Page FIGURE
3.32 January : potential evapotranspiration 142 3.33 April : potential evapotranspiration 142 3.34 July : potential evapotranspiration 143 3.35 October : potential evapotranspiration 143 3.36 Percentage of solar radiation and
sunshine, Kathmandu 145
3.37 Frequency of various weather
phenomena, Kathmandu 146
3.38 Average monthly relative humidity at
Kathmandu, 1968-1975 146
3.39 Selected grid points for Kathmandu
Valley 150
3.40 Dendrogram of 15 groups of MULCLAS
classification of 394 grid points 151 3.41 Classification of global solar
radiation 152
3.42 Classification of rainfall 152
3.43 Classification of maxinon
temperature 153
3.44 Classification of minimum
temperature 153
3.45 Climates in mesoscale, Kathmandu
Valley 154
4.1 Moisture Index 159
4.2 Actual and derived weekly rainfall,
1948-1975, Kathmandu (I.E.) 159
4.3 Average moisture index values during the
most favourable 13 week periods 161 4.4 Average moisture index values during the
least favourable 13 week periods 162 4.5 Inter annual variation in summer
monsoon, Kathmandu (I.E.) 164
4.6 Mean weekly moisture index,
Page FIGURE
4.7 Cumulative percentage of onset and cessation of summer monsoon,
x^ ^ 0.9, 1948-1975, Kathmandu (.I.E.) 166 4.8 Cumulative relative frequency of
monsoon duration for Kathmandu,
1948-1975 166
4.9 (a) Number of weeks of summer monsoon that ^ 0.9
(b) Number of weeks of summer monsoon
after week 26 that x^ ^0.9 168
5.1 Nepal administrative regions and
districts 172
5.2 Distribution of cultivated land for
(a) paddy (b) maize (c) Wheat 175 5.3 The percentage of wet season cropping
1968-1977 179
5.4 Seasonal cropping pattern, 1968-1977 180
5.5 Plant response functions 185
5.6 Average grcwth index values during the most favourable 13 week periods
for the tropical species 189
5.7 Average growth index values during the most favourable 13 week periods
for the warm temperate species 191 5.8 Average growth index values during
the most favourable 13 week periods
for the cool temperate species 192 5.9 Geographical position of the most
favourable 13 week periods for tropical, warn temperate and cool
temperate species 194
5.10 a-p Environmental indices at cool temperate, warm temperate and
tropical species at cross sectional
places 196
5.11 Generalized crop calendar for various
environmental zones 201
5.12 Growth indices at Parwanipur
including crop calendar 203
5.13 Growth indices at Khumaltar including
XVII
Page
FIGURE
5.14
Growth indices
crop calendar
at Bokhara including
207
5.15
Growth indices
crop calendar
at Surkhet including
208
5.16
Growth indices
crop calendar
at Jomosom including
209
5.17
Growth indices
crop calendar
at Jumla including
211
5.18
Growth indices
including crop
at Qkhaldhunga
calendar
213
5.19
Growth indices
crop calendar
at Tengboche including
214
5.20
Environmental indices at different
aspects, Kathmandu Valley
216
5.21
(a) The relation between paddy yield
and growth index value, Nepal
(b) The relation between wheat yield
and growth index value, Nepal
5.22
(a) Variation of total growth index
and paddy yield, Kathmandu
(b) Variation of total growth index
and wheat yield, Kathmandu
218
TABLE
LIST OF TABLES
Page
1.1
Major rivers of Nepal and their
discharge with seme examples of
Australian rivers and their discharge
12
2.1
Seasonal rainfall in Nepal at a few
stations shewn in Fig.2.5.
26
2.2
Maxirron rainfall in 24 hours during the
period, 1965-1969, Nepal
31
2.3
Coefficient of correlation of
temperature models
37
2.4
The selected regression coefficients used
to predict minimum temperature
38
2.5
The selected regression coefficients used
to predict maximum temperature
39
2.6
Thirty five climatic attributes used in
the analysis
48
2.7
(a) Attributes of thirty major classes
(precipitation)
(b) Attributes of thirty major classes
(Max-temperature)
(c) Attributes of thirty major classes
(Min-temperature)
53
2.8
Monthly estimated values of Q and N
based on 1st method and observed
radiation data
58
2.9
Monthly estimated values of N based on
2nd method and observed radiation data
60
2.10
Observed mean sunshine hours
62
2.11
Ten combined groups from dendrogram
64
2.12
Regression coefficients for n/N,
considering precipitation as dependent
variable
65
2.13
Regression coefficients for dew point
temperature considering elevation and
latitude as dependent variable
80
2.14
Observed average wind run (Km/day)
81
2.15
Average wind reduced at 2 m height
(Km/day)
82
3.1
Mean rainfall fron Kathmandu Valley and
surrounding regions, 1971-1976
95
3.2
Seasonal rainfall in the Kathmandu Valley
X I X
Page TABLE
3.3 The relevant terms for the rainfall
analysis 98
3.4 Variation of seasonal rainfall in Kathmandu (Tribhuwan International
Airport) 100
3.5 Regression coefficients for maximum and minimum temperature considering
elevation as a sole dependent variable 110 3.6 Mean monthly climatic parameters and
average radiation data (1976) 127 3.7 January : clear day totals of global
solar radiation (ly/day), Kathmandu, 27°42'N, considering surface reflection reflected
at higher slopes 130
3.8 July : clear day totals of global solar radiation (ly/day), Kathmandu, 27 4 2 'N considering surface reflection reflected
at higher slopes 131
3.9 Various meteorological factors (1975) 140 3.10 Present operation meteorological
stations, Kathmandu Valley 148
3.11 Mean values of global solar radiation in
four rajor groups 149
5.1 Land use, 1974-75 in Nepal 171
5.2 The area under different crops, productions
and yields, 1968-77 173
5.3 Comparison of crop yields (Kg/ha) in Nepal with developing and developed
countries (1973-1978) 174
5.4 Variation of major crops in area (million h a ) , production (million tonnes) and yield (tones/hectare) in
1967-68 to 1976-77 177
5.5 Farm holding and distribution by size
after land reform 178
5.6 Distribution of population and
cultivated area 181
5.7 Different species in natural conditions,
TABLE
5.8 Selected stations for different climatic
regions 193
5.9 Performance of promising lines in the Initial Evaluation Trial (IET) in
Khumaltar 1977 220
5.10 Performance of selected entries in Initial Evaluation Trial (IET) in
X X I
PREFACE
Daring my meteorological career in Nepal, I have developed my ideas to relate meteorological and climatological studies to agriculture for the development of agriculture in Nepal, where 94.4 percent of the population are subs is tent traditional farmers. It seems to me that, without development in the agricultural sector, it is unlikely that Nepal's present economy will irrprove from its present low levels. This idea of mine was partly developed by travelling throughout the country during the period 1967-76.
When I came to Australia to begin this research on 28th February 1977, I brought the necessary data with me and commenced searching for hypotheses which would allow me to portray the climatological information
in a way that could assist in the agricultural development of Nepal. Now, it seams that ny initial plan has been fulfilled and, of course, much work has to be extended in the future. I sincerely hope that this piece of work will contribute to the development of agriculture in Nepal. Only then will I feel that ny task has been achieved. As a meteorologist and
ACKNOWLEDGEMENTS
First and foremost, I am very much indebted to the Australian National University for offering me an A.N.U. scholarship, which made it possible for me to do this research.
I should like to thank the following generous people, who have helped me during this research period.
M y supervisor Dr N.S. McDonald for his reading, comments and suggestions.
Mr H.A. Nix and Mr P.M. Fleming for constant, enthusiastic help and encouragement.
Mr I. Simpson, Miss J. McMahon and Miss M. Johnson for assisting me in computer programming and operation.
Dr E. Fitzpatrick and Mr H.A. Nix, Mr P.M. Fleming, Mr. D.N. Body, Dr M. Hutchinson and C.S.I.R.O. for permitting freely me to use their program.
Professor B.L.C. Johnson for his supervision and administration, Mr E.C. Chapman for his administration in the latter part of ny research.
Mr J. Clanchy and Mrs. B. Ballard for reading ny draft. Mrs P. Millwood and Mr K. Ccwan for their assistance in cartography.
Gennesse Winch for typing.
M y wife, Ganga for her patience and support. In fact, she resigned from a permanent job, which she loved and had worked for
thirteen years in her good life to support ny work and look after two great kids, Noor and Anup.
1
.CHAPTER 1
INTRODUCTION
1.1 BACKGROUND AND APPROACH
For the past fifteen years the Nepal Meteorological Service has put most of its effort into providing basic day-to-day information for the aviation industry as prescribed by the World Meteorological Organisation and the International Civil Aviation Organisation. Along with this service, general public forecasts for twenty four hours are issued for Kathmandu and other regions. Recently, special weather forecasts for mountaineering expeditions have been made on request.
In addition to these existing facilities, there is a need to encourage the application of meteorology and climatology to other fields, among the most essential being engineering and agricultural science as they appertain to the economic development of the country. Since Nepal’s
econorry is based on agricultural productivity, it is essential to study the role of climate in relation to crop production in Nepal. Research should allow a more informed judgement to be made when selecting different crops, appropriate to meeting the demand for food of the increasing
population in Nepal. Further, when a new crop is being introduced to developed areas or a developed crop to new areas, one has to explore the weather and climate of those areas in order to maximise productivity. Climatological analysis can save years of costly trial and error.
The major objective of this thesis is to develop and test
demonstrate h ew using a model approach, nuch climatic based information relevant to regional agricultural planning can be generated.
Due to the mountainous nature of the country, a study of topoclimatology will be considered in order to obtain a more detailed understanding of climate as a basis for assessing the potential for agricultural development at the meso or regional scale.
1.2 HISTORY OF THE NEPAL METEOROLOGICAL SERVICE
Oi 1st October 1879, the first climatological station was established in the Legation ffospital Compound, Kathmandu. Temperature and rainfall have been recorded since that time. Since 1940, data fron two rainfall stations from Sundarijal Reservoir and Sundarijal Power Hause are also available. All these data are now held in the Indian
Meteorological Department archives in Poona. The mean monthly values of various climatic elements from Kathmandu for the period of 1901-1940 and
1941-1960 have been published in climatological tables ccrrpiled by the Indian Meteorological Department and published by the Manager of
Publications, New Delhi. Since the end of the 1940s to mid-1950s the Indian Meteorological Department (IMD) has established a total of 104 hydrometeorological stations in Nepal.
3
.International Airport, Kathmandu, from where all the aviation and public forecasts are issued.
Initially in 1965, the Nepal Meteorological Service was a section in the Hydrological Survey. During 1966, the Hydrological Survey was renamed the Department of Hydrology and Meteorology under the Ministry of Water and Power and in the same year Nepal became a member of the World Meteorological Organization. In 1973, the Department of Hydrology and Meteorology was combined with the Department of Irrigation to form the Department of Irrigation, Hydrology and Meteorology under the Ministry of Food, Agriculture and Irrigation. In 1979, the Department of Irrigation, Hydrology and Meteorology was returned to the Ministry of Water and Power, which was renamed the Ministry of Water, Pcwer and Irrigation.
The first tabulation of climatological data from various parts of the country was published in 1968 b y the Department of Hydrology and Meteorology, Kathmandu. A recent publication of climatological records of Nepal (1971-75) mentioned that the original meteorological observatory in Kathmandu was established by the IMD in 1921 in the grounds of the Indian Embassy and had through the years developed into a class 1 category climatological synoptic observation (Department of Irrigation etc. 1977). This is not strictly accurate since the Embassy was established in the same compound as the station which recorded first in 1879 (see IMD, 1953) .
1.3 PREVIOUS W O R K OF THIS KIND IN NEPAL
Due to the unavailability of extensive meteorological and climatological data, most writers on the climate of Kathmandu and Nepal have used the broad distribution of vegetation and topography to arrive at purely descriptive ways of explaining the regional variation of climate
b y Malla (1968), Department of Housing and Physical Planning (1968), and Binnie and Partners (1973). So far, the author can ascertain that only Nayava (1975) used climatological data to study the climate of Nepal.
1.4 NATURAL LANDSCAPES OF NEPAL
Nepal is a small land-locked and independent sovereign state between the Tibetan region of the People's Republic of China and India.
It has an approximate area of 141,000 square k m and is located between 26°15'-30°30'N latitude and 80°15'-88°15'E longitude. It lies
mainly on the southern slopes of the Himalayan range. The Himalayas extend fron the Pamir Knot to the northwest of the border of Assam for 2400 km. Nepal contains the Central Himalayas with the war Id's highest peak, Sagarmatha (Mt. Everest), 8840 m. The Nepal Himalayas are about 800 k m long between the rivers Tista and Kali. Similarly, the average length of Nepal is also about 800 km eastwest and its breadth north to south is 135
to 235 km.
Physiographically, the country can be divided into four distinct highland units. Frcm south to north they are the Churiya Hills, the
Mahabharat Lekh, the Great Himalayas and the trans-Himalayas. Alternating with these units are areas of relatively lower elevation, the Thrai south of the Churiya Hills, the Inner Tarai, the Hill region or Midlands and Shot
(see cross section, Fig. 1.1).
S
ta
r
5.
F
ig
.
1.
1
Ide
alised
c
ro
s
s
s
e
c
ti
o
n
o
f
N
e
p
a
[image:27.559.20.541.39.811.2]The Mahabharat Lekh, with an average height of 2350 m lies parallel and to the north of the Churiya Hills with some lew lands such as the Dang and Rapti Valleys forming the Inner Tarai between the ranges. North of the Mahabharat Lekh lies the broad complex of interfluve, hills and valleys including the Kathmandu Valley, which are known as the Hill Region or Midlands.
The last parallel range, the trans-Himalayas, exist only in the north-west of Nepal and lies less than 45 km north of the Great Himalayas. Its enclosed valley areas are referred to as Shot. At present, Nepal is divided into four Development regions: Eastern, Central, Western and far Western (see Chapter 5, Fig. 5.1). Each region is further divided into
the subregions, Tarai, Hill and Mountain (Fig. 1.2).
1.5 CLIMATE
Although Nepal is a small country; it has a great variety of topography which plays an inportant role in creating a diversity of weather and climate. Nepal experiences tropical, mesothermal, microthermal, taiga and tundra climates (Nayava, 1975). The highest mean maximum tenperature of 39.3°C was recorded in far Western Nepal and the lowest mean miniimm tenperature was - 9 . 7 ^ at Tengboche meteorological station at 3857 m. The extreme maximum tenperature was 46.0°C in far Western Nepal, and the extreme minimum tenperature was - 1 7 . 9 ^ at Tengboche. The highest mean annual rainfall during 1956-1975 was 5180 ntn at Lumle and the lowest 273 n m at Jcmosom.
7
.F
ig
.
1.
2
M
a
p
o
f
N
e
p
a
l
s
h
o
w
in
g
T
a
ra
i,
H
ill
a
n
d
M
o
u
n
ta
in
R
eg
increasing with altitude on the windward side and sharply decreasing on the leeward side. The heaviest rainfall falls on the Hill Regions,
specially in the Pokhara Valley and ultimately the foot hills of the great Himalayas receive less rain than other areas. There is also a longitudinal gradient in total monsoon rainfall; it is heaviest in the eastern part of Nepal. In general, the distribution of rainfall follows the rainfall model produced toy Hagen (1961), see Fig. 1.3.
In winter, most precipitation originates fron disturbances in the westerlies. Precipitation, then greatest in the northwest, decreases in amount in both southerly and easterly directions. At high elevations
(i.e., above approximately 3000 m) most of the precipitation at all seasons falls as sncw. The pre- and post-monsoon rains are intense at higher
altitudes than the Tarai and much snow falls in the Great Himalayas. Pre-and post-monsoon rain is associated with thermal convection combined with orographic effects, and results in strong thunderstorm activity leading to heavy precipitation over narrow bands within the region.
1.6 VEGETATION
Since several types of climate prevail due to the topographical extremes, a similar wide range of vegetation occurs as is shewn in Fig. 1.1 (after Hagen, 1961). About one third of the land is covered by forest of which there are two distinctive types (Fig. 1.4). One lies in the tropical and mesothermal climatic areas and the other lies in the mesothermal and microthermal climatic areas. The distribution of
vegetation is shown in the cross-section (ref. Fig. 1.1). The forests of Nepal are better described by Stainton (1974). The forest area is slowly contracting due to clearing for farmland, aggravating soil erosion,
9.
F
ig
.
1.
4
N
e
p
a
l,
f
o
re
s
t
co
1 1.
1.7 POPULATION AND AGRICULTURE
Nepal is a predominantly agricultural country where over 90% of the population are engaged in agriculture. The census of 1981 indicates that it has 14.43 million people with an annual rate of growth of 2.16% in the period 1971-81 (Department of Pood etc. 1977). After making allowance for double cropping, the area under agriculture is 2,326,000 hectares or 16% of the total land area. The importance of agriculture to Nepal is further enphasised by the fact that 65% of Gross Domestic Product
(GDP) is derived frcm agriculture.
1.8 WATER RESOURCES
Nepal has vast water resources for power and irrigation. The hydro-potential has been estimated by World Bank officials to be more than the combined potential of Mexico and Canada. Realisation of this potential has barely begun due to the poorly developed economy and the consequently
relatively low consumption levels. Por political reasons neighbouring India is not at present interested in purchasing power supplies from Nepal, although India has an urgent need for such resources. Should a solution to these political problems be reached, the influx of capital derived frcm such sales would boost the Nepalese economy.
Nepal has a great number of rivers. However, three major river basins, Karnali, Gandaki and Sapta Kbsi, cover the major flew of river tributaries. The major rivers and their discharge are shewn in Table 1.1. Although the Bagmati River is not a major river, it is shewn here due to
TABLE 1.1 : MAJOR RIVERS OF NEPAL AND THEIR DISCHARGE WITH SOME EXAMPLES OF AUSTRALIAN RIVERS AND THEIR DISCHARGE
River Drainage
Area Sq. Km.
Period of Investigation
Average Discharge M'Vsec
Maximum Discharge M^/sec
Minimum Discharge M'Vsec
K a m a l i at Chispani
42,890 1962-72 1333 11,600 373
Kali Gandaki at Kotagaon
11,400 1964-72 503 3,730 65
Trishuli at Betrawati
4,110 1967-72 155 2,020 35
Surikosi at Kampughat
17,600 1966-72 710 4,600 116
Bagmati at Chobhar
(Kathmandu Valley)
585 1963-72 14 876 0.046
Source : Surface Water Records on Nepal, Supplement No.7, 1972
River Drainage Period of Average Maximum Minimum
Area Sq. Km.
Investigation Discharge
M'Vsec
Discharge M^/sec
Discharge M^/sec
Murray at Barham
43,400 1905-73 139 -
-Murray at Doctors Point
16,750 1938-73 157 — —
Cotter at Kiosk
482 1911-76 5 — —
13
.CHAPTER 2
CLIMATIC ELEMENTS IN NEPAL 2.1 INTRODUCTION
Smith in 1975 when looking at issues of development suggested that
"Any urgent practical problem demands an immediate answer, and such slow progress cannot be tolerated. Furthermore, a given problem demands a reasonable minimum of reliability and yet cannot afford a
complicated expensive infra-structure of effort. The applied scientist has therefore to simplify a solution as far as possible but in so doing, sacrifice the minimum of accuracy. Ihe more basic knowledge that is available, then the easier becomes this simplification process. If knowledge is limited, then empirical or
semi-empirical solutions have perforce to be adopted" Smith (1975) pp.l.
It is with these provocative views in mind that the study of the spatial distribution of major climatic elements in Nepal was undertaken.
There are very few class 1 meteorological stations in Nepal, insufficient for an adequate description of the climate. Rainfall is the only element that is commonly observed over a sufficient number of stations and over a reasonably evenly spread network. Hence, to provide a common basis for further discussion, the 168 rainfall stations grid will be used as the basic network for the climatic analysis. As each element is
considered, the mean monthly value at each of the 168 stations will be derived from appropriate methods, which will be based upon all available observational data, and will form the basis of discussion. Though it is conventional to refer to data averaged over a thirty year period, shorter time periods will be used in this study. The periods will be selected on the basis of maximising the spatial and temporal coverage for each climatic element.
The climatic elements considered will be as follows: (a) Precipitation
(d) Dew point temperature (e) Wind
(f) Sunshine hours
(g) Maximum possible day length
(h) Solar radiation at the top of the atmosphere (i) Global solar radiation
(j) Potential evaporation
2.2 RAINFALL
Rainfall - its amount, seasonal distribution, intensity, frequency of occurrence, variability and areal variation - is probably the most
important climatic element for agricultural development. In climatological analysis, it is conventional to refer to data averaged over a thirty year period. As there are only very few rainfall stations in Nepal that meet
this requirement, it is necessary to adopt a shorter averaging period. Before attempting an analysis of the rainfall, it is essential to have an understanding of its general causes.
2.2.1 GENERAL FEATURES OF THE ATMOSPHERIC CIRCULATION OVER NEPAL
Studies of lover and upper tropospheric atmospheric circulation in Nepal suggest that the rainfall distribution can be analysed within four distinct seasons (Nayava, 1974a). Pre-monsoon (March to Ma y ) ; summer
monsoon (June to September); post-monsoon (October); and winter (November to February).
In the pre-monsoon season, moderate to strong westerly winds
1 5
.the subtropical westerly jet-stream weakens over Nepal. As summer
approaches, fogs become less frequent in the Valley and haze predominates from the southern to the Hill Regions of Nepal.
The summer monsoon is the most important season in Nepal for agriculture with nearly 60 to 90 percent of annual precipitation falling between June and September (Fig.2.1). The author, in an earlier study of the summer monsoon in Nepal and South Asia (Nayava, 1974a), was able to detect the basic types of monsoonal circulation patterns which allcw the surmmer monsoon to be generally classified according to(a) active or normal
(b) very active and (c) weak.
(a) During the summer monsoon, the easterly wave at 100 to 200 rribs dominates the upper level of the atmosphere and the subtropical westerly
jet-stream shifts to the northern side of the Tibetan plateau, around an anticyclone called the Tibetan High produced by the thermal effect of this heat source (Koteswaram, 1958; Flohn, 1968) . At the surface, an elongated zone of lew pressure develops along the Indogangetic plains of North India, which lies northwest to southeast. This area of lew pressure is known as the monsoon trough or equatorial trough, which, of course, advances north wards in the summer monsoon months and retreats southwards in the post-monsoon period. The onset and withdrawal of the monsoons are associated with the northward and southward movement of the equatorial trough
(Ananthakrishnan and Ra jagopalachari, 1964).
On average, depressions form in the Bay of Bengal twice per month, during the summer monsoon season, corresponding to a period of about 17 days (Miller and Keshavmurthy, 1965). Depressions usually move WNW and cease activity as they move over the Indogangetic plain. On rare
F
ig
.
2.
1
M
o
n
s
o
o
n
ra
in
fa
ll
a
s
a
pe
rc
e
n
ta
g
e
o
f
an
nual
ra
in
fa
[image:38.559.42.544.28.802.2]1 7
.depression is often found to be due to the effect of a westerly wave moving east, north of latitude 3 0 % . Recurvatures of monsoon depressions are carrion tcwards the end of the summer monsoon (Parathasarathy, 1958; Ramage 1971; Rao and Desai 1973; Nayava, 1974b).
(b) Curing a period of very active monsoon, the westerlies occasionally move south to the Tibetan plateau and even as far as Delhi, and the easterly jetstream often shifts northwards. The easterlies are very strong up to 2 0 % . During that time, Pacific anticyclone
circulation extends up to the northwest of Burma and the mid-latitude Saudi Arabian subtropical high extends a ridge eastwards even to the northwest of
India. Hence, Nepal finds itself in the col position. If the Saudi
Arabian ridge pushes more tcwards the east, i.e. winds fron west north west at 200 mbs, dominate western Nepal, and rainfalls are heavy towards the central and the eastern part of Nepal. If the Pacific ridge pushes more tcwards the west, a higher intensity of rainfall occurs all over Nepal. At that time, the monsoon trough lies over 2 5 % latitude. Examples of three dimensional circulation over Nepal are shewn in Figs. 2.2 a, b. During such periods less rain falls in central India, being instead concentrated either in a part or the whole of Nepal depending upon the mid-latitude anticyclones. Under these conditions, one part of Nepal could be drier and the other part may be mach wetter. Actually, such a period is known as a
"break in the monsoon" in India.
(c) During a weak monsoon over Nepal, easterlies are weak and lie over 1 5 % in the Indian Subcontinent. The fluctuation and intensity of the monsoon are very rruch related to variations in the easterly current.
The post-monsoon season is the harvesting season of the main crop, paddy. Strictly speaking, this is the transitional period fron one season to another and at this time the subtropical westerly jetstream
... 850 mb --- 500 mb --- 200 mb
30 June 1975 00 GMT
--- 500 mb
--- 100 mb
22 June 1975 00 GMT
[image:40.559.48.531.43.794.2]19
.In the winter season, the lower tropospheric wind blows mostly from the west-north-west in Nepal. The wind is continental, dry and calm and brings settled and dry periods to Nepal. On the other hand, in the upper troposphere, the subtropical westerly jetstream lies over the
southern side of the Himalayas. Almost daily morning fogs appear in most of the Valleys in Nepal. Occasionally, westerly disturbances bring cold
spells and rain, particularly to the northwest corner of Nepal.
2.2.2 RAINFALL DATA
Conventional 30 year mean rainfall data are available at oily a few places in Nepal. There are, however, 68 stations covering the
different regions with a minimum of twenty years of records (Department of Hydrology & Meteorology, 1968, 1971, 1972; Department of Irrigation, Hydrology and Meteorology, 1973, 1977, vol.I, vol.II). To establish whether any bias is introduced by using 20 years averaged data instead of
the normal 30 years, the mean rainfall at Kathmandu for 5,10, 15....to 55 years backwards frcm 1975 are calculated. Ihe percentage deviations of these means frcm the long term mean are plotted against time as shown in Fig. 2.3. This information indicates that 20 years average rainfall is one per cent different from the standard 30 years normal rainfall which can be seen in Fig. 2.3. Therefore, the years 1956-1975 inclusive were chosen as the period to investigate the mean monthly and annual rainfall in Nepal. In addition, there are a further hundred stations whose records cover only part of this period and the missing data for 100 stations have been
estimated by linear regression based on the closest station which has a longer period of record to develop a complete record for the 168 stations for 1956-1975. The serial number and name of the station are shewn in Appendix IA & B. Mean monthly rainfall standardized to 1956-1975 for the 168 stations are shewn in Appendix II (see Key Fig. 2.4 for 168
Years from 1975 Kathmandu { I. E.) (1975-1921)
2 1
.rainfall over Nepal. At the same time, the seasonal rainfall at selected places (Table 2.1) have been shewn for a better illustration of the
seasonal rainfall over Nepal. This shews that the percentage of seasonal rainfall is broadly similar except in the far Western Mountain Regions, where the percentage of rainfall differs greatly from other places, for
example, Jumla receives only 69 percent of its rainfall from the summer monsoon, whereas the other Regions receive 80 to 90 percent from the summer monsoon rainfall. Mean monthly rainfall at the same selected places has also been presented to show the pattern of rainfall (Fig. 2.5). This demonstrates that the rainfall falls mostly in the summer monsoon season and this varies greatly from place to place within a small distance. In other words, Nepal has distinct wet and dry seasons.
2.2.3 ANALYSIS
2.2.3.1 MEAN MONSOON AND ANNUAL RAINFALL
Mean monsoon rainfall and mean annual rainfall during 1956-1975 are shown in Figs. 2.6 and 2.7. The rainfall in Nepal varies
greatly frem place to place due to sharp topographical variations. As the rain bearing winds approach Nepal from the southeast in the summer monsoon season, heavier rainfall falls in the foothills of the Churiya range
increasing with altitude on the windward side and sharply decreasing on the leeward side. The heaviest rainfall falls on the Hill Regions, specially in the Bokhara region. Ultimately, the Great Himalayas receive less rain than the other areas (Fig. 2.6).
F
ig
.
2
.4
1
6
8
-m
e
te
o
ro
lo
g
ic
a
l
s
ta
ti
o
n
n
e
tw
o
[image:44.559.29.551.35.803.2]2 3,
O ) L i
-.
2
.5
M
e
a
n
m
o
n
th
ly
ra
in
fa
F
ig
.
2
.6
M
e
a
n
mo
ns
oo
n
ra
in
fa
2:5.
\ Q
F
ig
.
2
.7
M
e
a
n
an
nual
p
re
c
ip
it
a
ti
o
S
ta
ti
o
n
E le v a ti o n W in te r P re -M o n so o n S u m m er P o s t-An n ua l M o n so o n M o n so o n (N o v -F e b ) (M a r-M ay ) (J u n e -S e p ) O c to b e rc m oVs cncococn.—i c o r o r ' ^ c o < 3 - * o - < r « C M : X )
a>oo'vDOM^'roLnor^^ocMcxDOLOoOvO
CM I ^ o o ■-( c \ i rH r H O V X K T ' f \ l L.O CU \£ ) O ' u n
t-H i—( CM .—1 .—« r—I f—i CO CM i—< *—«
Lnunco^t-LO'OLO^-'^Dr^'^i-ri-LO'^-cDr^'rf-Cnr^-COO-i-O^OCMOOCMCMLOLOCMCM^-CM^si
ldco^o c^.—t^-o'^-cocococncoo'ioi—
cMfOtnrO'COcr\^oir)Lnoo<5tcTicoi^ o o a^cor^cor^MOcocococor^cor'-.cocococo
0 0 O CO «—• CM ^ DO CO CO CO CO «—i i —! CO O'» O c o r ^ ^ O r H O ^ c o c o c o c o o io r i^ c O v O r - t O " ^ D C O C M U - > ^ O O U D ^ -^ -0 0 0 < J > « e -r ^ - r M
t— 1 I—! r—1 r —4 r —I CM i—* r—1 r—«
or^^-r-if-<^sDCM^tOiO'cn«^<^-cocri'-' f—( r~ 4 i— *. i—! I—« i—< CM «—i r—« r—!
H H lD N C n r o a jy D H N '^ '^ O 'O ^ 'O 'O CM CM ^ M O X > c 0 ' s j - r ' . 0 > 0 ' - < 0 ' i < 0 0 0 ' 0
r-H *—1 CM '—) t—1 f—i r-H CM '—* f~) t—< r—<
>h , o c o r - t '^o h i i o ^ ^ m r o cm v f o ' T
COOCOOOrv0 35<t't H r M n C M O O O H o cmcm <—i c o - n r o c o L D ^ - c o r ^ o o 03- c o
O M O C O ^ - O O O 'tO O in C O O O ? — -O C M O ' O O ' f O j' M I X O h h h ^j c m i Ti
--H^-r-(Or^rOrHfOrOCOOO'-HCr>r^CMX'-0 I—t I—I CM 0 4 CM i—I CM CO '—I CO
o 03 3: c 4_> <T3 ox: :3 S- 03
• r - 03 03 £ Z
e t-03
03 -4-> 03
cn
s-0 3 a ;
3 Q . 03 o r r ( t i p u o
-0 S - r — - 0 0 5 - 0 3 03 0 « — CO 03 3 or •—03 03 J O J O jO 3 O —'t E 3Jo n r i x r ^ n r c o c o
c= e 03 3 + J C O JO L 4 - i _ C
■ r o a m i l D i i f l O 3 OJ t
i— 1—
LT) CM CD • I— U _ c <: o -£C CO CO c o •I— +-> 03
2 7
.receives an annual total of only 3584 rrm - a reflection of sharp
topographical differences over short distances. In similar situations of heavy rainfall at Cherapunji, Assam, Simpson (1921) remarks that heavy
rainfall is due to the rapid rise of warm saturated air blowing with a great velocity so heavy precipitation falls on the top of the Hills.
On the other hand, in contrast to the heavy rainfall areas, there exist very lew rainfall areas, such as Jomosom, (273 inn), annual total in a rain shadow area on the northern side of the Great Himalayas. This lower
rainfall is due to the alignment of the neighbouring mountains which prevent a large inflow of moist air into the region.
The only station in Nepal with a long period of rainfall data is Kathmandu (I.E.) where rainfall recording began in 1879 but reliable data is available only from 1921. The variation in both annual and monsoon rainfall (shown in Fig.3.13) can be quantified using a number of
approaches. Firstly the absolute range of annual and monsoon rainfall is 872mm to 1969mn and 636mn to 1609tim respectively. Secondly, expressing variability in a simple statistical tern, the mean deviation expressed as a percentage of the mean is 15 9 % and 16 S % respectively.
2.2.3.2 THE DATE OF THE ONSET AND CESSATION OF THE MONSOON
Normally, in Kathmandu, the onset of the monsoon occurs on the 12th June and retreats on the 21st September based on observed daily rainfall data frem the period of 1948 to 1975 (Fig. 2.8) (Department o f Irrigation, Hydrology and Meteorology, 1977 Vol.II). Confidence can be placed in these data as they are consistent with the broadscale analysis by Das (1970) cxi the onset and retreat of the monsoon over the Indian
F
ig
.
2
.8
N
orm
al
da
te
o
f
(a
)
th
e
o
n
s
e
t
a
n
d
(
b
)
re
tr
e
a
t
o
f
s
um
m
er
mo
ns
oo
n,
K
at
hm
an
[image:50.559.32.540.40.828.2]15 June
/
I
*
10 June5 June
A fte r Das, 1972
/ 1 5 Dec 15 Nov
A fte r Das, 1972
[image:51.559.52.521.26.795.2]2.2.3.3 INTENSITY OF RAINFALL
As rainfall intensity is not a regularly recorded variable in Nepal, an estimate can be obtained using the value of monthly rainfall to
rainy days where a rain day is defined Where the rainfall >l.Qmm. The comparison between this monthly ratio and station elevation indicated that there was no pattern of increase or decrease in intensity with increasing altitude. This may be due to windward and leeward effects accompanied b y the complex nature of topography in Nepal. In other words, this does not show any fixed pattern of trend fron Which specific conclusions can be drawn.
In addition, the maximum rainfall in 24 hours and the average number of rduvy days per year
( } l.o
mm) for a few selected stations from Nayava (1974b) have been shown in Table 2.2. This shows that, generally,the intensity of rainfall is much higher in lower elevations than in higher elevations.
2.2.3.4 DISCUSSION