Characterization of multiterawatt laser–solid interactions
for proton acceleration
P. McKenna,a)K. W. D. Ledingham,b)I. Spencer, T. McCany, and R. P. Singhal Department of Physics and Astronomy, University of Glasgow, Glasgow G12 8QQ, United Kingdom
C. Ziener, P. S. Foster, E. J. Divall, C. J. Hooker, D. Neely, A. J. Langley, R. J. Clarke, and P. A. Norreys
Central Laser Facility, Rutherford Appleton Laboratory, Chilton, Didcot, Oxon OX11 0QX, United Kingdom
K. Krushelnick
Blackett Laboratory, Imperial College, Prince Consort Road, London SW7 2BZ, United Kingdom
E. L. Clark
AWE plc, Aldermaston, Reading RG7 4PR, United Kingdom
共Received 2 May 2002; accepted 13 August 2002兲
A comprehensive characterization of experimental parameters in a study of proton acceleration by short-pulse laser–solid interactions at intensities up to 1019W cm⫺2 is reported. Laser pulse and prepulse conditions were measured, with a contrast ratio of the order of 10⫺6obtained. The focused laser intensity was experimentally calibrated using a time-of-flight spectrometer to resolve the stages of ionization of a target gas. By comparing the measured ion yields with predictions of an atomic tunneling ionization model a factor of 1.5 uncertainty in the focused intensity was determined. Drive mechanisms for mounting solid targets with thickness in the range of 0.2 to 125
m have been developed for use with high-repetition rate lasers. A retro-focus imaging system has also been implemented to position the target relative to the laser focus. The techniques have been applied to study proton acceleration as a function of various laser and target parameters. Measurements of the energy distribution of protons as a function of laser intensity are presented for both mylar and Al targets. A maximum proton energy of 1.5 MeV was observed. A compilation of recent results from a number of laser systems on the conversion efficiency of laser energy to protons is discussed. By comparison, an efficiency of about 0.7% for the present study is encouraging for future tabletop-laser-based ion acceleration. © 2002 American Institute of Physics.
关DOI: 10.1063/1.1516855兴
I. INTRODUCTION
The acceleration of beams of protons using ultra-high intensity laser pulses has been widely studied in the past few years共for a recent review see Mendonca, Davies, and Eloy 2001兲.1 For high-intensity laser irradiation of a solid target, plasma waves are created at the critical surface which wave-break producing a population of hot electrons. For laser irra-diance I2 above 1.3⫻1018 W cm⫺2m2, where I is the laser intensity and is the wavelength, electrons can be ac-celerated to relativistic energies. The dynamics of these fast electrons initiate the conditions for the subsequent accelera-tion of protons, which originate from contaminant layers of hydrocarbon and water vapor on the surfaces of the target. Mendonca, Davies, and Eloy共2001兲1provide an overview of these secondary acceleration processes. Proton acceleration from solid targets with thicknesses greater than the wave-length of the incident laser light in particular has received a great deal of interest, partially because the energies measured
are generally higher than with gas, cluster, or thin solid targets.1 Snavely et al.共2000兲2 measured a peak proton en-ergy of 58 MeV for I2⫽3⫻1020 W cm⫺2m2 using the Livermore Petawatt laser and Clark et al. 共2000兲3reported a maximum proton energy up to 47 MeV using the Vulcan laser at the Rutherford Appleton Laboratory. Large numbers of fast ions are required for a number of possible applications of laser-based accelerators including ion injectors for heavy-ion accelerators,4 fast-ion-based fast ignitor schemes,5 and nuclear medical techniques involving the diagnosis and treat-ment of cancer tumors. The use of laser-accelerated protons to induce 共p,n兲 and ( p,␣) nuclear reactions, to produce 11C and 13N short-lived positron emitting isotopes was previ-ously reported by our group.6A significant flux of protons with energies above a few million electron volts are required to produce these isotopes for use in positron emission tomog-raphy, a noninvasive medical imaging technique. The reac-tion11B( p,n)11C for example has a threshold energy of 2.76 MeV, with a cross-section peaking at about 6 MeV. The Vul-can ‘‘single shot’’ laser producing protons with energies up to 37 MeV was used in this very successful ‘‘proof of prin-ciple’’ experiment.6Smaller-scale multi-terawatt lasers oper-ating at intensities of the order of 1019W cm⫺2 however, a兲Author to whom correspondence should be addressed; electronic mail:
b兲Also at: AWE plc, Aldermaston, Reading RG7 4PR, United Kingdom.
4176
could also be used to produce proton spectra with the re-quired energy range above a few million electron volts but at much higher-repetition rates. The search for the optimum laser–solid interaction processes to produce high fluxes of protons in the desired energy range will highlight the feasi-bility of short pulse lasers for isotope production.
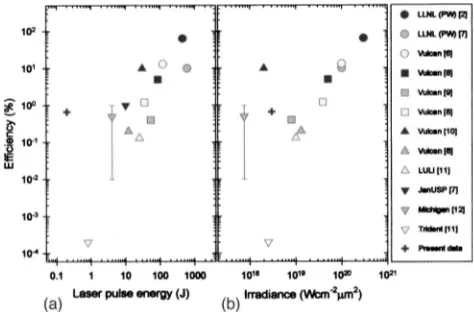
For the design of dedicated laser systems to accelerate ions for various applications, the question of the optimum laser-pulse conditions needs to be addressed. To aid this, experimental data from a range of laser systems with differ-ing pulse parameters can be compared. However, if system-atic trends are to be easily observed it is crucial that the experimental conditions are well characterized and detailed. This was highlighted recently when we began compiling re-sults from a number of sources2,6 –12 on the efficiency of conversion of laser energy to protons. This data are presented in Fig. 1, which shows conversion efficiency as a function of 共a兲 laser pulse energy E and 共b兲 laser irradiance I2. No attempt has been made to normalize the points on the basis of differing laser and target parameters. This would be viable only with full characterization of the various parameters. Nevertheless, the trends illustrated by these plots have im-portant implications for designing future laser-based ion ac-celerators. If the efficiency of energy conversion reduces dra-matically with pulse energy, then it may not be feasible to look to low-energy, short-pulse lasers to provide the basis for this technology.
To address these issues further, a study of proton accel-eration using well-characterized tabletop laser pulses was carried out. Ion acceleration processes depend on a variety of laser parameters, including intensity and irradiance (I2), pulse energy, polarization, intensity contrast ratio, and prepulse energy, the angle of incidence onto target, as well as the target conditions. It is important to fully characterize and state all of these interaction conditions to facilitate theoreti-cal modeling and for ease of comparison of results. Careful parameter characterization can also reveal information about the processes occurring that may not otherwise be ascer-tained without systematic study. Proton measurements made as a function of various target parameters including material and thickness are presented in a separate publication, Spen-cer et al.共2002兲.13In the present article, the characterization
II. LASER-PULSE PARAMETERS
A. Laser system
The Astra multi-terawatt laser at the Rutherford Apple-ton Laboratory was employed in the present study. Langley et al.共2000兲14provide a detailed description of the laser sys-tem. A brief overview is presented here, emphasizing the measurements made to characterize the laser-pulse param-eters.
Using a continuous wave Nd:YVO4 laser as a pump source, the titanium sapphire oscillator共Femtolasers Produk-tions GmbH兲 operates at a fundamental wavelength of 790 nm. This laser source provides 10 nJ pulse of 15 fs duration at a repetition rate of 76 MHz. In the first stage of the chirped-pulse amplification process,15 the pulses are stretched to 540 ps using an all-reflective gratings-stretcher. The stretched pulses are amplified to a final energy of up to 1.8 J in three multi-pass titanium-sapphire 共Ti-S兲 amplifica-tion stages—each pumped independently at 10 Hz by a frequency-doubled Nd:YAG laser. After the final amplifier stage, the beam diameter is increased from 16 to 60 mm. Enlarging the beam ensures that the energy density is below the compressor gratings damage threshold. It also minimizes nonlinear effects in optical components and air when pulses are relayed to the target and pulse compressor. The pulse repetition rate delivered to the target area is selected using a computer-controlled beam-switching mirror mounted on a galvanometer device. The pulse energy is varied using a re-motely controlled attenuator comprising a half-wave plate in series with two polarizing plates. Pulse energy is monitored using the small amount of light transmitted 共⬍1%兲through one of the dielectric relay mirrors.
The accumulation of intensity-induced nonlinear phase shifts within a laser system is quantified by the B-integral,16 and can lead to wave-front distortion and self-focusing ef-fects. The nonlinear contributions of all refractive optics in the laser provides a calculated value of the B-integral close to unity. During and after pulse compression the beam propa-gates to target only in vacuum to ensure good beam and pulse fidelity.
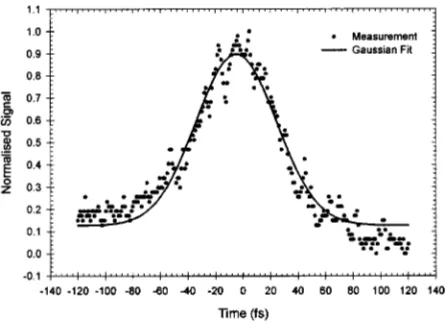
A single-shot autocorrelator was used to measure the pulse duration at the output of the compressor. To avoid stretching the pulse to be measured, all reflective optics 共apart from a pellicle beam splitter兲 were used to deliver pulses to the 250-m-thick doubling crystal used in the
[image:2.612.55.292.52.208.2]tocorrelator. Figure 2 shows a typical measurement of a com-pressed pulse obtained during the present study. A Gaussian fit to the trace is also shown. The mean value of five mea-surements determined the pulse duration 关full width at half maximum共FWHM兲兴to be 60 fs. At the exit of the compres-sor, the laser pulses were linearly polarized with the E-vector vertical.
B. Contrast ratio and prepulse activity
In experiments involving short-pulse laser illumination of solid targets, prepulse activity preheats the target, causing it to ionize before the arrival of the main pulse. The level and timing of ionizing prepulse and amplified spontaneous emis-sion 共ASE兲 defines the plasma expansion and density scale length during the interaction with the main mode-locked pulse. Wharton et al. 共2001兲17 demonstrated that even non-ionizing prepulse with intensities of the order of 109 W cm⫺2 can substantially alter high-intensity laser– solid interactions.
Whereas it is impossible to completely eliminate prepulse activity, it is important to keep it to a minimum. To help achieve this, the Astra laser contains three KD*P Pock-els cells共EM510. Leysop Ltd.兲, which have a manufacturer’s specified optical rise-time of 0.25 ns. Two are placed within the first, ten-pass Ti-S amplifier stage and the third is placed between the first and second amplifiers. Each Pockels cell is placed between two crossed, Glan-Taylor polarizing ele-ments. The Pockels cells serve three roles within the laser. First, they act as a pulse picker at a repetition rate of 10 Hz, second, they serve to minimize the energy of prepulses on target and third, they reduce the amplification of spontaneous emission 共ASE兲.
The pulse-picking role is necessary because, as men-tioned above, the femtosecond laser oscillator operates with an output repetition rate of 76 MHz and provides a train of pulses spaced 13 ns apart. The Ti-S amplifiers, however, are pumped at a repetition rate of 10 Hz, and gain is present within each amplifier crystal for several microseconds. The Pockels cells therefore serve to pick pulses for amplification while discriminating against the amplification of all other pulses in the train. Photo-diode measurements of the laser pulse showed that the best ratio between the energy of the
preceding pulse共13 ns prior to the main amplified pulse兲and the energy of the main pulse is 5⫻10⫺8. Last, the two Pock-els cells placed within the first amplifier are particularly im-portant for removing unwanted ASE. The amplified pulses make five passes through the Ti-S crystal and are then passed through the Pockels cell pair before being injected back into the amplifier for a further five passes. The first amplifier has an overall gain of 106and the Pockels cells are very effective at removing the amplification of spontaneous emission.
To characterize the prepulse and ASE activity in the present study, a third-order amplitude diagnostic 共TOAD兲 measurement was carried out on the compressed pulses. The main purpose of a TOAD measurement is to highlight the intensity distribution in the wings of the main pulse. The main logarithmic trace in Fig. 3 was obtained with the TOAD operated at its maximum sensitivity. At 10 ps before the main pulse, the background is at the 10⫺6 level or better since this represents the sensitivity limit of the TOAD. The background level rises to 10⫺5 at 4 ps and 10⫺4 at 1.5 ps before the arrival of the main pulse. The two satellite peaks 共S兲 are caused by reflections in the tripling crystal of the autocorrelator共This was established by changing the crystal to one of different thickness and observing a change in the delay between the two peaks.兲 These reflections produce a weak post pulse for both the red共790 nm兲and blue共395 nm兲 pulses which, when cross-correlated with the main red and blue pulses, result in two satellite peaks—one 共apparently兲 before and the other after the central peak.
The linear plot in the inset of Fig. 3 was obtained with the TOAD operated at low sensitivity by attenuating the en-ergy of the input pulses. The low-sensitivity scan serves to calibrate the magnitude of the high-sensitivity data. It also demonstrates the instrument response of the TOAD which at ⬃200 fs is more than adequate for the measurement of con-trast over the required tens of picoseconds time-window.
[image:3.612.63.286.51.215.2]The Astra multi-terawatt laser is capable of delivering focused intensities above 1019 W cm⫺2on target. The distri-bution on the rising edge of the pulses as indicated by the TOAD measurement represents an intensity of FIG. 2. Autocorrelation measurement of a compressed pulse.
[image:3.612.321.553.51.218.2]1014 W cm⫺2, 4 ps before the peak of the pulse, rising to 1015 W cm⫺2 at about 1 ps. Assuming the plasma produced expands thermally at 107 cm s⫺1, a plasma scale length of the order of 0.4m is estimated.
C. Focused intensity
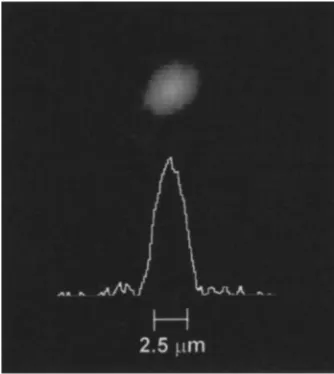
After the pulse compressor and diagnostic station three flat turning mirrors, A, B, and C in Fig. 4, were used to steer the 790 nm laser pulse within the target chamber towards the focusing optic. The first of these共A兲had a dielectric coating to facilitate transmission of a 532 nm beam used in a retro-focus arrangement described in Sec. III. The remaining two mirrors were gold coated. A f /3, 15.1 cm focal length off-axis, parabolic mirror was used to focus the beam onto tar-get. Due to the quantity of debris that can be generated in high-repetition rate laser–solid interactions it was necessary to shield the gold coating on this optic with a transparent plastic pellicle. The pellicle is 10m thick and therefore has a low B integral and does not effect the overall focus quality. To determine the size and quality of the laser focal spot a microscope objective was used to image it onto a change-coupled device共CCD兲camera. The spatial resolution of the system has been calibrated to measure the focal spot size. The beam energy was attenuated to facilitate this measure-ment. Figure 5 shows a typical image, where best focus cor-responded to a FWHM spot size of 2.5m, which is almost diffraction limited. 41% of the total energy on target was determined to be contained within FWHM of this spot. The maximum energy on target was 225 mJ, as determined with a calorimeter positioned in the beam path just in front of the focusing optic. Using these pulse parameters, the focused intensity within FWHM of the main focal spot is calculated to be 3.2⫻1019 W cm⫺2.
To calibrate the intensity experimentally, a time-of-flight 共TOF兲spectrometer has been developed to measure ion pro-duction within the laser focus. The intensity is determined by comparing the measured stages of ionization of a target gas with predictions of an atomic ionization model. This tech-nique is widely used18in the study of atomic and molecular physics/chemistry in laser fields of the order of 1016 W cm⫺2 and has also been applied in studies up to 8
⫻1018W cm⫺2.19,20It works particularly well when the ob-served TOF spectra can be statistically averaged over a num-ber of laser shots and is therefore suitable in the present study with a laser repetition rate of up to 10 Hz at a reduced pulse energy.
[image:4.612.353.520.53.240.2]Figure 6 is a schematic of the TOF spectrometer arrange-ment employed. A Wiley–McLaren21 electrode geometry was positioned across the laser focus. This three-plate assem-bly was mounted on a similar base to the solid target mount arrangement 共described in Sec. III兲 so that they could be interchanged during the experiment for regular checks of the focused laser intensity. An electron multiplier was used to detect the ions at the end of their flight path. The target chamber was pumped down to a pressure of 8⫻10⫺7 mbar 共achieved with a combination of turbo pumps and cryogenic coolant兲and back filled with argon to pressures in the range (3 – 6)⫻10⫺6 mbar. An UHV fine-control valve was used to regulate the flow of gas into the chamber. The feedline to this valve was pumped prior to use, to ensure a high purity of target gas at the interaction region. A field of strength 1.4 kV cm⫺1 was established across this region to extract the argon ions, produced within the laser focus, towards the de-tector. This resulted in a temporal separation of the ions ac-cording to their mass-to-charge ratio (m/q) along the 1 m flight-path. Each detected ionization state was represented by
[image:4.612.59.289.53.230.2]FIG. 4. A schematic overview of the experiment layout.
FIG. 5. Focal spot image obtained with a CCD camera and ‘‘lineout’’ sec-tion through the image indicating the FWHM.
[image:4.612.326.550.611.732.2]a peak on a TOF spectrum recorded on a digital storage oscilloscope.
Traditionally, when applying this technique it is usual to look for the largest ion charge state produced, as a signature for the largest intensity within the laser focus. For intensities of the order of 3.2⫻1019W cm⫺2, from the barrier suppres-sion model22production of Arq⫹with q up to 18 is expected. In the present measurements, mass-to-charge (m/q) resolu-tion and the absence of ultra-high vacuum proved to be lim-iting factors in the detection of the typically small numbers of the higher-charged ions produced and as a result charge states greater than q⫽8 could not be determined. However, ion yields for charge states q⫽1 – 8 were well resolved in the region of their threshold intensities, up to 1017 W cm⫺2. Therefore, a variation on the traditional approach was adopted. Ion yields for these charge states were measured as a function of the reduced laser-pulse energy and the resulting data were compared with predictions of the Ammosov, De-lone, and Krainov 共ADK兲23 atomic tunneling ionization model, which is widely used in current theories of strong-field physics.24The intensity scale for the measured data was calculated using the pulse energy and other known pulse pa-rameters. The objective is to determine the scaling factor that must be applied to the calculated intensity to fit the data to the theoretical curves.
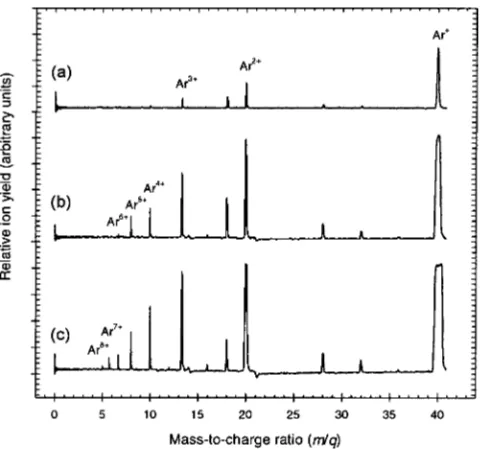
This technique as applied to the present study will now be illustrated. Figures 7共a兲, 7共b兲, and 7共c兲shows examples of the recorded ion spectra at the reduced energies of 0.03, 0.19, and 0.41 mJ, respectively. As expected, higher-charge state argon ions are observed with increasing laser energy. The peaks for each ion were integrated and plotted as a function of the calculated laser intensity. The theoretical simulation of the ion yield was done in two steps. First, the rates for se-quential ionization given by the ADK theory23,25were used to obtain a system of rate equations for the ionization prob-ability of the different ionization stages. Since the
nonse-quentual part of the ionization is not of interest in this ex-periment, it was possible to only use the sequentual ADK rates. This system of coupled rate equations was solved for laser pulses with different peak intensities. By integrating the ion yield over the region of the focal spot volume26 which has the corresponding intensity as its mean intensity, the spa-tial distribution of the laser light within the focal spot was accounted for. Figure 8 shows the resulting curves for q ⫽2–8. The intensity at which there is a change in slope in each curve corresponds approximately to the saturation in-tensity where the probability of ionization to produce a par-ticular charge state is equal to unity. Below this region, ion production is given by the ADK theory, whereas above the ion yield can be expected to scale with the expanding laser focal volume, which has an I3/2 dependence. The measured data points for each charge state have been fitted to the curves in Fig. 8. With regard to the intensity calibration, it is important to note that the calculated intensities were scaled up by a factor of 1.5 to provide this best fit.
[image:5.612.55.296.50.275.2]To summarize, in order to gauge the level of uncertainty in characterizing the focused laser intensity, the intensity as calculated using known pulse parameters was compared to an intensity scale determined by fitting experimentally mea-sured ion yields to an atomic ionization model. To obtain well-resolved ion peaks, TOF spectra were measured at an attenuated laser energy and hence the calibration was carried out at intensities up to 1017W cm⫺2 as shown in Fig. 8. In addition, in this intensity region, the theoretical curves expe-rience a change in slope which provides a more sensitive test for fitting the experimental data. The values are found to be in good agreement to within a factor of 1.5. Since the attenu-ation was made using two antireflection coated mirrors placed in the beam after the last transmissive optic, no addi-tional distortion of the pulse due to addiaddi-tional B integral is expected as the pulse energy is scaled up to the maximum FIG. 7. Argon ion spectra measured at laser energies of 共a兲0.03 mJ,共b兲
0.19 mJ, and共c兲0.41 mJ. The plots have been separated in the y axis for ease of viewing.
[image:5.612.320.554.51.275.2]energy used. The uncertainty in focused intensity can there-fore be scaled up. A maximum intensity of (3.0⫾1.8) ⫻1019W cm⫺2 was obtained on target.
III. TARGET PARAMETERS
A. Target mount arrangement
When a laser pulse with peak intensity of the order of 1019 W cm⫺2 interacts with a thin solid target共of the order of 10 m兲 the target material breaks down resulting in a characteristic hole centered on the laser focal point. Each laser pulse must therefore be focused onto fresh target mate-rial. The use of a laser with the repetition rate of a few hertz demands the adoption of a mechanical system to advance the target material in synchronization with the laser-pulse train. This facilitates a large number of laser shots to be taken before the vacuum conditions in the interaction chamber are recycled to replace the target. Two target mount arrange-ments were developed for use in the present study to accom-modate Cu, Al, and mylar targets with a thickness between 0.2 and 125m.
Figure 9共a兲 shows a double-reel set up employed for 10-mm-wide tape targets. This mounting system was used with both plastic and metal tapes with thickness above 10
m. A computer-controlled stepper motor facilitated motion of the reels in either direction with the target tape moving across two support rods, each a few millimeters to either side of the laser focus. The drive was designed to operate at a velocity that ensured the tape remained under tension, and therefore flat, but not deformed. Experience showed that tapes thinner than 10 m could not be used for this reason. Typically, nearly 200 laser shots were taken on a 2-m-long tape. In this way, measurements could be carried out for extended periods facilitating various parameter scans. Target tapes were loaded on spare reels in advance to ensure rapid target changeover.
A second target mount mechanism, shown in Fig. 9共b兲, involved sandwiching thin target foils 共⬍10 m兲 between two halves of a circular wheel. A stepper motor was used to rotate the wheel, to advance each target to the laser focus. Although only 24 shots could be taken between each change-over, several targets of differing material and thickness could be mounted on a single wheel.
taken to ensure that the optimum focal conditions on target are maintained for each laser shot. Ensuring a target does not move out of the focal plane as it is progressed between shots presents an engineering challenge.
A retro-focus imaging system was developed for the present study, to monitor movements of the target from the optimum focal point. The arrangement, shown in Fig. 4, comprised of a 532 nm diode laser beam expanded through a 共⫻40兲microscope objective. The beam was spatially filtered using a 10 m pinhole and collimated using an achromatic lens, positioned at focal length from the pinhole. A large percentage of the beam passed through a beam splitter and was directed into the target vacuum chamber 共via a fused silica window兲and through mirror A. From here, the 532 nm probe beam passed along the path of the main 790 nm pulse train. For the normal incidence configuration used, a reflec-tion of the 532 nm light from the target surface passed back down the chain of mirrors and into the retro-focus system. The beam splitter reflected a large percentage of the light, which was steered through a focusing optic and onto a CCD camera. Infrared filters were used to remove stray 790 nm light. The image from the CCD was monitored before each laser shot to check the position of the target relative to the probe 532 nm focus and hence the main 790 nm focal spot. Prior to using the arrangement to reference the target position, the optics were located to capture a prime image of the 532 nm light reflected from a wire prealigned to its focus. By small adjustment of the position of all subsequent targets 共along the z axis in Fig. 4兲they could be relocated at the 532 nm focus by reproducing the retro-reflected image. To use the 532 nm probe light to provide a reference for the main 790 nm pulse train, care was taken to ensure both beams were colinear and came to focus at the same point. The 532-nm light was adjusted to accommodate this.
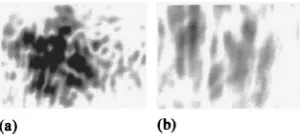
Figure 10共a兲 shows an enlargement of a typical retro-focus spot reflected from a moving Al tape target. For com-parison, a corresponding image with the tape out of focus is also shown 关Fig. 10共b兲兴. Calibrations using Sony Magni-scale readings indicated that the target could be repositioned in the z axis to⫾25m using this arrangement. A z displace-ment of⫾25m from the optimum focus reduces the inten-sity on target from 3.0⫻1019 W cm⫺2 to 2.1⫻1019 W cm⫺2 for these focusing conditions. The principal merit of the tech-nique is it provided a visual alignment system for new tar-gets. This simplified target changeover and proved to be ex-tremely useful for setting up targets of differing thickness.
[image:6.612.363.513.53.122.2] [image:6.612.61.290.55.192.2]IV. PROTON DIAGNOSTICS
Measurements of the proton energy spectra were carried out using a ‘‘Thomson parabola’’ spectrometer with a CR-39 plastic nuclear track detector, as shown schematically in Fig. 11. CR-39 can be used to detect protons with energies above 100 keV.
The spectrometer was located along the target normal direction共and therefore the laser axis兲at a distance of 2.2 m behind the target. A 1 mm aperture was positioned to subtend a solid angle of 0.1sr. Between the two poles of the spec-trometer, parallel electric and magnetic fields were estab-lished in opposite directions along the x axis of Fig. 11. For a positively charged ion, this resulted in an electric force in the⫹x direction and a magnetic force in a downward direc-tion along the y axis. In this way, ions entering through the defining aperture experienced a parabolic deflection between the poles according to their velocity. Although ions of differ-ent charge-to-mass ratio (q/m) are separated into distinct parabolas, only protons were detected in the present study.
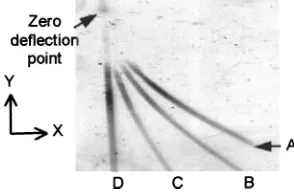
The characteristic proton parabolas were imprinted on pieces of CR-39 located at a distance of 35 cm behind the spectrometer. As protons come to rest, the energy they de-posit causes structural damage to the plastic material. After etching the plastic in NaOH solution for several hours, a series of small pits visible under a microscope provides the signature of the ions. A spectrum is unfolded by sampling the number of pits in various energy bins along the parabola. Figure 12 shows an example of a piece of CR-39 illustrating some of the parabolas obtained in the present study. The sharpness of the trace depends on the acceptance angle of the instrument and hence the aperture size. The traces all result from protons, but produced under varying experimental con-ditions. The measurements were made with the same target
共25-m-thick aluminum兲, but trace 共A兲 was obtained at an intensity of 7.4⫻1018W cm⫺2, with 共B兲 and 共C兲 resulting from measurements at 6.2⫻1018W cm⫺2 and 5.2 ⫻1018 W cm⫺2, respectively. The parabolas were separated by changing the electric-field strength in the spectrometer between measurements. Fields of strength 3, 2, and 1 kV cm⫺1were used for traces共A兲,共B兲, and共C兲, respectively. The magnetic field was held constant at a value of 0.1 T as determined by the fixed position of the permanent magnetic pole pieces. The result was a change in deflection along the x axis for each measurement and therefore a change in the resulting parabola. In this way, various parameter scans could be made with a single piece of CR-39. This avoided the need to recycle the vacuum conditions to change the detector frequently and thus made full advantage of the high-repetition rate of the laser and the moving target mecha-nisms. Trace共D兲in Fig. 12 was made at a laser intensity of 7.4⫻1018W cm⫺2 关as with共A兲兴, but with the electric field turned off. This line trace highlights the magnetic deflection in the downward direction along the y axis. A measurement of this nature was routinely made after each parameter scan and at the initial parameter condition to check reproducibility in the unfolded spectrum.
Additional pieces of CR-39 with up to eight steps of mylar filter were positioned at various angles from target normal in the main target chamber. The filters had a thick-ness up to 20 m, which provided a proton spectrum of cutoff energies up to 1 MeV. These were used to provide measurements on the directionality and angular spread of the proton beams. Nuclear activation techniques were unfeasible due to the energy of the protons produced.
V. EXPERIMENTAL RESULTS
The experimental configuration described above was used in the measurement of proton energy spectra as a func-tion of target material 共copper, aluminum, and mylar兲 and target thickness in the range 6 to 125m. A fuller descrip-tion of these results is presented in a separate publicadescrip-tion, Spencer et al. 共2002兲,13 which also details the relevant mechanisms giving rise to proton acceleration. In the present paper, measurements of the energy distribution of protons as a function of laser intensity are presented.
A. Comparison of proton spectra obtained using different target mounts
[image:7.612.65.280.54.154.2]First, to experimentally establish if the target mount mechanisms of Fig. 9 had any influence on the interaction process, the same target material was irradiated using both arrangements and the reproducibility of the energy distribu-tion of protons emitted was checked. Figure 13 shows the corresponding spectra measured at the back of the 36 m mylar targets irradiated at normal incidence. A total of 50 laser shots were made on the moving tape target and a maxi-mum of 24 shots on the wheel-mounted target. The averaged laser intensities were 7.2⫻1018W cm⫺2 and 7.5 ⫻1018 W cm⫺2, respectively. The data have been normal-ized to present the number of protons observed per shot 共in one steradian and within a 50 keV energy bin兲. Both spectra have a characteristic plateau over a similar energy range. The
[image:7.612.99.246.608.706.2]FIG. 11. Schematic of proton diagnostic setup.
FIG. 12. Proton parabolas imprinted on CR-39. The measurements were made with 25 m Al target. The laser intensity was A,D: 7.4 ⫻1018
highest-energy points represent a cutoff, above which no pro-tons were detected. There is a small difference of about 200 keV in comparing the maximum energies observed, but oth-erwise the spectra are quite similar.
B. Proton measurements as a function of laser intensity
Proton measurements as a function of focused laser in-tensity for low energy共⬍200 mJ兲pulses are presented here. Figure 14 shows proton energy distributions measured be-hind a 25m Al target, irradiated at normal incidence with laser intensities between 5.2⫻1018W cm⫺2 and 7.4 ⫻1018W cm⫺2. The overall shape of the spectra are quite similar and in good overall agreement with the results of Maksimchuk et al.共2000兲12 for a 1.8m Al target at inten-sities up to 3⫻1018W cm⫺2. Maksimchuk12 presents maxi-mum proton energy of about 1.5 to 2.0 MeV for a 25m Al target at a laser intensity of 1.5⫻1018 W cm⫺2. The maxi-mum proton energies in the present results for the same tar-get thickness are lower, increasing from about 0.4 to 0.8 MeV over the intensity range studied. Measurements were
also made with copper target foils, which yielded similar maximum proton energies to the aluminum target.
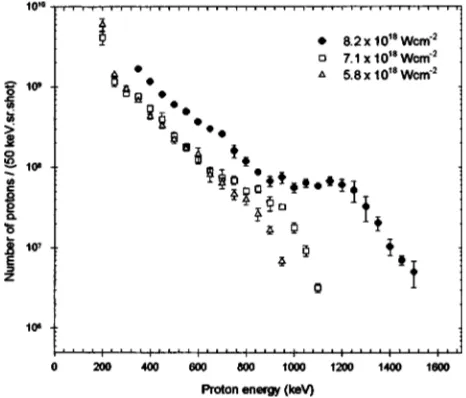
In Fig. 15, a similar set of measurements is presented for a 23 m mylar target for intensities between 5.8 ⫻1018 W cm⫺2 and 8.2⫻1018 W cm⫺2. As with the alumi-num target, the maximum energy to which protons are accel-erated is observed to scale with intensity. However, the maxi-mum proton energies are higher for the mylar target than for the metal targets. This is contrary to the results of Maksimchuk,12who observed no significant difference in the maximum energy of protons for different materials.
VI. DISCUSSION
In this article, the importance of good characterization of multi-terawatt laser–solid interactions is highlighted. Spe-cifically, the characterization of parameters used on a recent program of experiments on the acceleration of protons using the Astra high-repetition rate laser at the Rutherford Apple-ton Laboratory is detailed. Experimental results produced by groups using a number of laser systems worldwide have con-centrated on the measurement of maximum proton energies as a function of intensity I and irradiance I2. Similar mea-surements, but with lower-pulse energies of up to 200 mJ are presented here. The uncertainty in the focused laser intensity was calibrated by adopting time-of-flight spectrometry tech-niques to measure the laser-produced stages of ionization of an inert gas and comparing the resulting ion yields with pre-dictions of an atomic tunneling ionization model. The maxi-mum energy to which protons can be accelerated depends not only on intensity, but a number of interrelated laser and target parameters, which we have also sought to characterize. It is important that these parameters are well known so that valid comparisons can be easily made and progress en-hanced.
[image:8.612.57.292.52.216.2]By determining the mean proton energy, the number of protons 共obtained by integrating the proton energy distribu-tions as measured with the Thomson parabola兲and the angu-lar distribution of the protons, a conversion of laser energy to FIG. 13. Energy distribution of protons as measured with a 36m mylar
[image:8.612.321.554.53.252.2]target mounted in both the ‘‘tape-target’’ and ‘‘wheel-target’’ mounts.
FIG. 14. Scaling of the energy distribution of protons with laser intensity on a 25m Al target.
[image:8.612.56.291.534.732.2]proton energy of almost 0.7% was calculated. This value should be accurate to about a factor of 2 and represents an encouraging departure from the trends illustrated in Fig. 1 共where the present measurement is represented by a small cross兲. The future application of compact, low-energy, short-pulse laser systems to the commercial production of protons looks promising. The design and development of a dedicated tabletop laser system will benefit from systematic studies of the effect on ion acceleration of a number of well-characterized parameters.
ACKNOWLEDGMENTS
The authors would like to thank the mechanical and electrical technicians at the CLF Rutherford Appleton Labo-ratory who developed the target mount systems and compo-nents. The Engineering and Physical Sciences Research Council 共UK兲supported this work.
1
J. T. Mendonca, J. R. Davies, and M. Eloy, Meas. Sci. Technol. 12, 1801
共2001兲.
2R. A. Snavely, M. H. Key, S. P. Hatchett, T. E. Cowan, M. Roth, T. W.
Phillips, M. A. Stoyer, E. A. Henry, T. C. Sangster, M. S. Singh, S. C. Wilks, A. MacKinnon, A. Offenberger, D. M. Pennington, K. Yasuike, A. B. Langdon, B. F. Lasinski, J. Johnson, M. D. Perry, and E. M. Cambell, Phys. Rev. Lett. 85, 2945共2000兲.
3E. L. Clark, K. Krushelnick, J. R. Davis, M. Zepf, M. Tatarakis, F. N. Beg,
A. Machacek, P. A. Norreys, M. I. K. Santala, I. Watts, and A. E. Dangor, Phys. Rev. Lett. 84, 670共2000兲.
4K. Krushelnick, E. L. Clark, R. Allott, F. N. Beg, C. N. Danson, A.
Machacek, V. Malka, Z. Najmudin, D. Neely, P. A. Norreys, M. R. Salvati, M. I. K. Santala, M. Tatarakis, I. Watts, M. Zepf, and A. E. Dangor, IEEE Trans. Plasma Sci. 28, 1184共2000兲.
5
M. Roth, T. E. Cowan, M. H. Key, S. P. Hatchett, C. Brown, W. Fountain, J. Johnson, D. M. Pennington, R. A. Snavely, S. C. Wilks, K. Yasuike, H. Ruhl, F. Pegoraro, S. V. Bulanov, E. M. Campbell, M. D. Perry, and H. Powell, Phys. Rev. Lett. 86, 436共2001兲.
6
I. Spencer, K. W. D. Ledingham, R. P. Singhal, T. McCanny, P. McKenna, E. L. Clark, K. Krushelnick, M. Zepf, F. N. Beg, M. Tatarakis, A. E. Dangor, P. A. Norreys, R. J. Clarke, R. M. Allott, and I. N. Ross, Nucl. Instrum. Methods Phys. Res. B 183, 449共2001兲.
7A. J. MacKinnon, Y. Sentoku, P. K. Patel, D. W. Price, S. Hatchett, M.
Key, C. Anderson, R. Snavely, and R. R. Freeman, Phys. Rev. Lett. 88, 215006共2002兲; M. Key共private communication兲.
8M. Zepf, E. L. Clark, K. Krushelnick, F. N. Beg, C. Escoda, A. E. Dangor,
M. I. K. Santala, M. Tatarakis, I. F. Watts, P. A. Norreys, R. J. Clarke, J. R. Davis, M. A. Sinclair, R. D. Edwards, T. J. Goldsack, I. Spencer, and K. W. D. Ledingham, Phys. Plasmas 8, 2323共2001兲.
9
P. McKenna, K. W. D. Ledingham, I. Spencer, T. McCanny, R. P. Singhal, F. N. Beg, K. Krushelnick, M. S. Wei, A. Gopal, A. E. Dangor, P. A. Norreys, K. L. Lancaster, R. J. Clarke, S. Hawkes, M. Zepf, E. L. Clark, and R. D. Edwards共unpublished兲.
10A. P. Fews, P. A. Norreys, F. N. Beg, A. R. Bell, A. E. Dangor, C. N.
Danson, P. Lee, and S. J. Rose, Phys. Rev. Lett. 73, 1801共1994兲.
11
M. Roth共private communication兲.
12A. Maksimchuk, S. Gu, K. Flippo, D. Umstadter, and V. Yu. Bychenkov,
Phys. Rev. Lett. 84, 4108共2000兲; D. Umstadter共private communication兲.
13
I. Spencer, K. W. D. Ledingham, P. McKenna, T. McCanny, R. P. Singhal, E. L. Clark, K. Krushelnick, P. A. Norreys, R. J. Clarke, P. Foster, D. Neely, A. J. Langley, E. J. Divall, C. J. Hooker, and J. R. Davis共 unpub-lished兲.
14A. J. Langley, E. J. Divall, C. J. Hooker, M. H. R. Hutchinson, A. J-M. P.
Lecot, D. Marshall, M. E. Payne, and P. F. Taday, CLF Annual Report RAL-TR-2000-034共2000兲, p. 196.
15D. Strickland and G. Mourou, Opt. Commun. 56, 219共1985兲.
16A. E. Siegman, Lasers共University Science Books, Sausalito, CA, 1986兲. 17
K. B. Wharton, C. D. Boley, A. M. Komashko, A. M. Rubenchik, J. Zweiback, J. Crane, G. Hays, T. E. Cowan, and T. Ditmire, Phys. Rev. E 64, 025 401共R兲 共2001兲.
18
S. Augst, D. Strickland, D. D. Meyerhofer, S. L. Chin, and J. H. Eberly, Phys. Rev. Lett. 63, 2212共1989兲.
19E. A. Chowdhury, C. P. J. Barty, and B. C. Walker, Phys. Rev. A 63,
042 712共2001兲.
20M. Dammasch, M. Do¨rr, U. Eichmann, E. Lenz, and W. Sandner, Phys.
Rev. A 64, 061 402共2001兲.
21
W. C. Wiley and I. H. McLaren, Rev. Sci. Instrum. 26, 1150共1955兲.
22S. Augst, D. D. Meyerhofer, D. Strickland, and S. L. Chin, J. Opt. Soc.
Am. B 8, 858共1991兲.
23M. V. Ammosov, N. B. Delone, and V. P. Krainov, Zh. Eksp. Teor. Fiz. 91,
2008共1986兲 关Sov. Phys. JETP 91, 2008共1986兲兴.
24M. Protopapas, C. H. Keitel, and P. L. Knight, Rep. Prog. Phys. 60, 389 共1997兲.
25M. V. Ammosov, P. A. Golovinsky, I. Y. Kiyan, V. P. Krainov, and V. M.
Ristic, J. Opt. Soc. Am. B 9, 1225共1992兲.