Int. J. Electrochem. Sci., 13 (2018) 7282 – 7290, doi: 10.20964/2018.08.115
International Journal of
ELECTROCHEMICAL
SCIENCE
www.electrochemsci.org
Layered Graphite Prepared by an Ozone Aeration Treatment as
an Anode Material for Lithium Ion Batteries
Zhongyi Chen, Yan Liu, Yanzong Zhang* , Fei Shen, Gang Yang, Lilin Wang, Xiaohong Zhang, Yan He, Ling Luo, Shihuai Deng
College of Environment, Sichuan Agricultural University, Sichuan Engineering and Technical Center for Rural Environmental Protection, Chengdu 611130, Sichuan, PR China
*
E-mail: yzzhang@sicau.edu.cn
Received: 5 February 2018 / Accepted: 9 April 2018 / Published: 5 July 2018
Layered graphite was prepared by performing an ozone aeration treatment. The results showed that surface oxidation of the layered graphite formed a unique structure with more exposed ravines and gaps. As the anode material for lithium ion batteries, this graphite exhibited lower diffusion resistance compared with traditional graphite, with an improvement in the performance rate of 40%,50% and 80% at 1 C, 3 C and 5 C, respectively. Moreover, the ozone aeration-treated layered graphite electrodes exhibited a higher reversible capacity of 393 mAh g-1 compared to 340 mAh g-1 for layered graphite electrodes and offered better cycling performance compared to traditional graphite, retaining 78% of the initial reversible capacity after 800 cycles at rate 5 C. This exciting discovery based on ozone aeration treatment may provide some novel ideas for improving the performance of graphite electrodes.
Keywords: Layered graphite;Ozone aeration; Commercial battery; Electrical properties; Edges and defects
1. INTRODUCTION
To improve the properties of graphite electrodes, a large number of researchers have focused on the modification of graphite. Deng [8] used Sn-coated mesocarbon microbeads (MCMBs) as an anode to make an LIB with a reversible capacity of up to approximately 339.6 mAh g−1. Then, Saito [9] fabricated a Sn–C composite as an anode material for LIBs, which exhibited the highest reversible capacity of 588 mAh g-1 after 100 discharge-charge cycles. Jiang [10] found that oxidation treatment of natural graphite can enhance the reversible capacity from 251 to 335 mAh g-1. The reversible capacity of a graphite anode modified by catalytic oxidation can be increased from 251 to over 372 mAh g−1 [11]. Yang [12] prepared carbon-coated isotropic natural graphite spheres, which exhibited a superior rate capability of 346 mAh g−1 at 3 C. These graphite-modification methods increase the specific capacity and decrease the surface activity, but they do not improve the diffusion rate of Li ions in graphite crystals. Porous graphite prepared by MoOx-catalysed gasification offers better cycling
performance compared to that of pristine graphite, retaining 84% of the initial reversible capacity after 1500 cycles at a rate of 5 C [2]. In recent years, graphene has become the focus of study for use as the anode material for LIBs [13-15]. Electrodes based on Cu-supported graphene nanoflakes can reach a specific capacity of 1500 mAh g-1 at a current rate of 100 mAh g-1 over 150 cycles [16]. However, the complex preparation, processing and low yield of graphene limits its wide application in industry. Based on a comprehensive analysis of anode materials, to the best of our knowledge, there have been no reports of porous graphite materials for LIB anodes through ozone aeration due to the instability of ozone. As a result of the destructiveness of ozone, the edge structure of graphite layers can be changed to enable the intercalation-deintercalation of lithium ions at the edges to improve the lithium diffusion rate [17, 18].
In this work, we were inspired by the oxidation process in wastewater treatment to prepare layered graphite using an ozone treatment with a convenient ozone control device. Lithium ions can be intercalated into the graphite crystals through the gaps. Additionally, the channels with pores and ravines may buffer the volume change of graphite in the charging-discharging cycles so that the oxidized layered graphite exhibits a high rate and stable cycle performance. This simple processing method provides a novel direction for future research based on the graphite electrode.
2. EXPERIMENTAL
2.1. Materials and reagents
Commercial layered graphite (Qingdao Huatai Limited from China) with a particle size of 5 μm was used to fabricate the battery anodes. We used lithium metal for the counter electrode for half cells and LiNi0.4Co0.2Mn0.4O2 for the cathode material for the full cells (The Jianzhong Li-ion battery
carbonate/ethyl methyl carbonate (EC/EMC) (3:7) was provided as the electrolyte solution (Chengdu Expert of battery design technology limited from China).
2.2. Preparation of oxidized layered graphite
[image:3.596.167.433.330.406.2]A total of 5 g of commercial layered graphite was dispersed in 250 mL of distilled water by ultrasonic vibration. The mixed solution was then loaded into a special aeration bottle. Mildly oxidized graphite [19] was prepared by ozone aeration treatment (Ozonizer, HF-15, Yinhe plant from China), as shown in Fig. 1. Ozone (flow rate: 0.15 L/min, concentration: 50 mg/m3) was bubbled into the bottom of the aeration bottle, which was placed in a water bath at 80 °C, for 20 min. The mixed solution was then filtered through a vacuum filter with vacuum degree 0.096-0.097 MPa for 1 h (SHZ-D3, Yuhua Instrument plant from China) and dried in a vacuum oven at 60 °C for 4 h. The commercial layered graphite was labelled GL. The oxidized layered graphite was labelled GLO.
Figure 1. Ozone aeration process of multiple channels layered graphite
2.3. Characterization
The morphology of the products was examined using field-emission scanning electron microscopy (FE-SEM) (Hitachi, S-4800). The specific surface area was analysed with a N2 absorption
apparatus (Quantachrome, Autosorb-1MP). Fourier transform infrared (FT-IR) spectra were recorded by an FT-IR spectrophotometer (Bruker Optics) using the KBr method. Raman spectroscopy was performed using an NRS-7000 series instrument with a maximum resolution of 0.7 cm-1/0.3 cm-1 and a measurement range from 50 to 8000 cm-1. The graphite structure was characterized by X-ray diffraction (XRD, Rigaku D/max 2500) with Cu Ka radiation (l = 1.5405 Å).
2.4. Assembly of battery
foil with the slurry comprising the LiNi0.4Co0.2Mn0.4O2 material, carbon black and a PVDF binder with
a weight ratio of 85:5:10 (dispersed in N-methyl-2-pyrrolidone). The electrode was formed by a roller press (LDHY500-N55, Nakeer Pole Film Manufacturing Equipment limited from China). Electrodes based on the GL materials were prepared in the same way.
For the assembly of the half cells, the as-prepared graphite electrode was used as the positive electrode, and the lithium metal was used as the counter electrode. The polyethylene (PE) separator and electrolyte solution (LiPF6) were integrated into the cell with the electrodes. Coin-type half cells
(2025) were then assembled in a glove box. The dry mass loading of the graphite material was 2.3 mg/cm2.
For the assembly of the full cell (2.0 Ah), a lug was welded onto the prepared anode and cathode supplied by the LIB factory. Following the welding step we assembled the PE separator. The semi-finished battery was then placed into a glove box before being filled with electrolyte and assembly into a commercial battery. The loading of GLO (or GL) was 10.8 mg/cm2 and the LiNi0.4Co0.2Mn0.4O2 loading was 27.3 mg/cm2.
2.5. Electrochemical test
Rate performance, charge-discharge curve and electrochemical impedance spectroscopy (EIS) of the half cell were measured by a battery testing system (BTS-4008, Xinweier, China). The cut-off potential range was varied from 0 V to 1.5 V at 45 °C.
Cycle performance of the full cell was tested using a different battery testing system (CT3008 W, Xinweier, China). The charge-discharge potential range was varied from 2.5 to 4.5 V at 6.0 A (3 C) and 10.0 A (5 C) at 45 °C.
3. RESULTS AND DISCUSSION
[image:4.596.122.478.561.692.2]3.1. Surface morphology
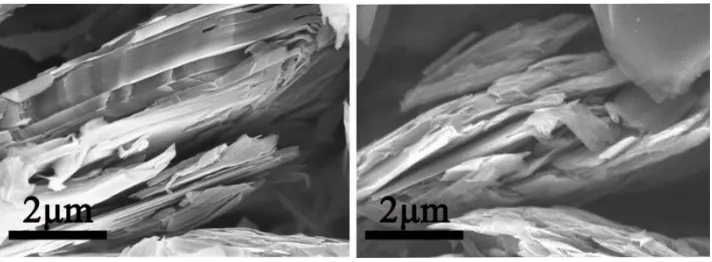
Fig. 2 shows the morphology of the sample materials. It can be seen from the SEM images that there are obvious differences in the structure of the layered graphite before and after oxidation. The changes in the structure of the graphite resulting from the ozone treatment mainly occur at the edges. The edge of GL exhibited a multilayered and ordered structure (Fig. 2a). The layers of graphite overlap each other closely. In contrast, GLO presented a multilayered and disordered structure with a certain amount of ravines and gaps (Fig. 2b). The data in Table 1 shows that the specific surface area of graphite increased from 8.9 m2/g to 22.5 m2/g. The bulk density of graphite was reduced from 1.04 g/mL to 0.98 g/mL. These results indicate that gaps and ravines have been created in the graphite crystals.
Table 1. Specific surface area and bulk density of GL and GLO
SSpecific surface area (m2 g-1) Bulk density (g mL-1)
GL 8.9 1.04
GLO 22.5 0.98
3.2. Chemical characterization
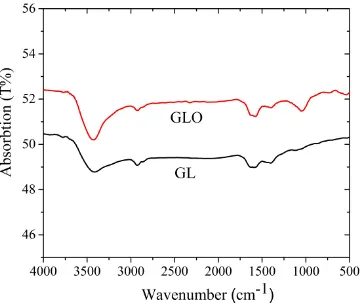
The FT-IR spectra of the sample materials are shown in Fig. 3. The absorption bands corresponding to the stretching vibrations for the C=C ring at 1612 cm-1, aromatic C-H at 2860 cm-1, and O-H at 3430 cm-1 were observed for GL and GLO [2, 19, 20]. However, in addition to these absorption bands, GLO showed a large C-O stretching peak at 1031 cm-1 [21]. Therefore, the GLO was oxidized by ozone aeration treatment, but the other functional groups all remain the same.
Figure 3. FT-IR spectra of GLO and GL. Prominent features in the FT-IR spectrum of the carbon materials include C-O stretching at 1031 cm-1,C-C ring stretching at 1612 cm-1, aromatic C-H stretching at 2860 cm-1, and O-H stretching vibrations at 3430 cm-1.
The Raman spectra of the four samples (Fig. 4a) showed the D peaks at 1580 cm-1 and the G peaks at 1350 cm-1. GLO has the higher ratio of ID/IG (intensity of D band/intensity of G band), which is approximately three times as high as that of GL. The higher ratio of ID/IG corresponds to graphite
[image:5.596.85.512.268.310.2] [image:5.596.208.388.480.632.2]
with more edges and defects [22, 23]. Fig. 3b contains the X-ray diffraction patterns of the GL and GLO (Fig. 4b). They both have a strong diffraction peak at 26.5° (002) with the d002 value, which is the
distance between any two closest crystal facets [24]. After enlarging the image, we found that the diffraction peak of GLO (002) is shifted to the left compared with GL. Furthermore, another diffraction peak of GLO at 43.5° (101) had broadened. These data are consistent with the Raman spectra (Fig. 4a), which indicated that the interlayer spacing of the graphite crystals increased, and the particle size decreased.
Figure 4. (a) Raman spectra of GL and GLO with a maximum resolution of 0.7 cm-1/0.3 cm-1 and a measurement range from 1000 to 2000 cm-1. (b) XRD patterns of GL and GLO with Cu Ka radiation (l = 1.5405 Å)
[image:6.596.122.471.227.372.2]3.3. Electrochemical performance
Figure 5. Initial charge and discharge curves at a current density of 40 mA/g for GL and GLO in half cells
The initial charge and discharge curves of GL and GLO are shown in Fig. 5. It is found that the discharge capacity of GLO is higher than that of GL at 90 mAh/g. On the other hand, the voltage of the GLO cell is higher than that of the GL cell during the discharge process, while in the charge process the voltage of the GLO cell is lower than that of the GL cell. These results indicate that the GLO
[image:6.596.207.393.472.626.2]
electrode has a lower lithium ion diffusion resistance. Furthermore, the initial coulombic efficiency of GLO is lower than that of GL. This observation could be due to the existence of a larger number of edges and defects and the increased specific surface area (Table 1), leading to increased irreversible capacity [17, 24, 25].
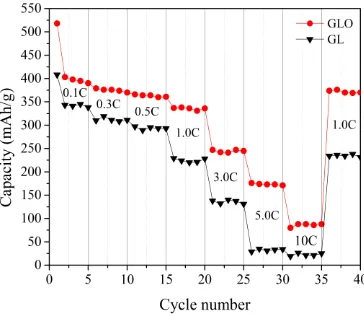
All samples were first charged and discharged at 0.1 C for 5 cycles before being charged and discharged at varying current densities from 0.3 C to 10 C for 5 cycles, with a final charge and discharge cycle at 0.1 C (Fig. 6). The GLO showed the higher rate performance under the conditions of charge and discharge, with the coulombic efficiency of the cell maintained above 98%, which equates to capacity 50% and 80% higher than that of GL at 1C and 3C, respectively. Moreover, when the current was restored to 0.1 C, the GLO maintained better recovery performance. It is worth noting that the gap in the rate performance of the two kinds of graphite was increasing. This phenomenon shows that the structure of the GLO could withstand a larger current, while the structure of the GL is damaged. The data for GLO could confirm the existence of gaps, ravines and defects. These structures are similar to channels, which facilitate the transmission of lithium ions at a high rate [26, 27].
Figure 6. Charge-discharge curves for GLO and GL from 0.1 C to 10 C for 5 cycles and the final set of charge and discharge cycle at 0.1C
[image:7.596.207.389.337.494.2]
Figure 7. (a) The cycling performances in the 800 cycles at 3 C charge and discharge. (b) The cycling performances at 5 C charge and discharge with 800 cycles.
For solid graphite, the square of the diffusion length (L) is proportional to the diffusion time (t) of lithium ions (t ≈ L2/D) (D is the diffusion coefficient) [15]. In the battery, the GLO electrode is able to contact more lithium ions because of its special structure, in which many gaps can be filled in by the electrolyte solution and more edges may be exposed to the electrolyte. Thus, it enables the lithium ion to have a shorter diffusion distance and lower diffusion resistance. In addition, it is worth noting that the channel structure with many ravines forms a natural buffer for volume change [28]. This structure helps to promote the stable charging and discharging cycle for graphite. The above reasons explain why the GLO electrode has better electrochemical performance than GL.
4. CONCLUSIONS
In this work, multiple-channel layered graphite was prepared by ozone aeration treatment. A distinct structure composed of oxidized layered graphite may increase the probability of lithium ion contact with the graphite edges, while the gaps in the graphite crystal may reduce the Li-ion diffusion distance, resulting in a better rate capability and specific capacity. The multiple-channel structure may act as a buffer for volume expansion of the graphite in the battery charging-discharging cycles. Hence, batteries with multiple-channel layered graphite anodes show a more stable cycle performance even at high rates compared with pristine layered graphite anodes. This method is convenient for practical use. It is expected that the technique and material will provide some novel ideas for future research based on graphite electrodes.
ACKNOWLEDGEMENTS
This work was supported by the Science and Technology Department of Sichuan Province (2017JZ0021, 2017SZ0039) and the Education Department of Sichuan Province (17ZA0298).
References
1. D. Zuo, G. Tian, X. Li, D. Chen, K. Shu, J. Alloys Compd., 706 (2017) 24.
2. Q. Cheng, R. Yuge, K. Nakahara, N. Tamura, S. Miyamoto, J. Power Sources., 284 (2015) 258.
b
3. M. Walter, R. Erni, M.V. Kovalenko, Sci. Rep., 5 (2015) 8418.
4. B. Jin, A.H. Liu, G.Y. Liu, Z.Z. Yang, X.B. Zhong, X.Z. Ma, M. Yang, H.Y. Wang, Electrochim. Acta., 90 (2013) 426.
5. C.D.L. Casas, W. Li, J. Power Sources., 208 (2012) 74.
6. S.F. Amalraj, R. Sharabi, H. Sclar, D. Aurbach, Springer., 47 (2014) 283. 7. A.V.W. Cresce, O. Borodin, K. Xu, J. phys. Chem. C., 116 (2017) 26111.
8. K.A. Striebel, J. Shim, E.J. Cairns, R. Kostecki, Y.J. Lee, J.A. Reimer, T.J. Richardson, P.N. Ross, X.Y. Song, V. Zhuang, J. Electrochem. Soc., 151 (2004) A857.
9. M.J. Deng, D.C. Tsai, W.H. Ho, C.F. Li, F.S. Shieu, Appl. Surf. Sci., 285 (2013) 180.
10.G. Saito, C. Zhu, C.G. Han, N. Sakaguchi, T. Akiyama, Adv. Powder Technol., 27 (2016) 1730. 11.Y.P. Wu, C. Jiang, C. Wan, R. Holze, J. Power Sources., 111 (2002) 329.
12.Y. Wu, C. Jiang, C. Wan, E. Tsuchida, Electrochem. Commun., 2 (2000) 272. 13.X. Wu, X. Yang, F. Zhang, L. Cai, L. Zhang, Z. Wen, Ceram. Int., 43 (2017) 9458. 14.K. Chen, D. Xue, S. Komarneni, J. Colloid. Interface. Sci., 487 (2017) 156.
15.K. Chen, L. Chen, Y. Chen, H. Bai, L. Li, J.Mater. Chem., 22 (2012) 20968.
16.Z. Dong, C. Jiang, H. Cheng, Z. Yang, G. Shi, J. Lan, L. Qu, Adv. Mater.(Weinheim, Ger.)., 24 (2012) 1856.
17.J. Hassoun, F. Bonaccorso, M. Agostini, M.Angelucci, M.G. Betti, R. Cingolani, R. Cingolani, M. Gemmi, C. Mariani, S. Panero, V. Pellegrini, B. Scrosati, Nano Lett., 14 (2014) 4901.
18.T. Deng, X. Zhou, Mater. Lett., 176 (2016) 151.
19.T. Deng, X. Zhou, J. Solid State Electrochem., 20 (2016) 2613.
20.M. Acik, G. Lee, C. Mattevi, A. Pirkle, R.M. Wallace, M. Chhowalla, C. Kyeongjae, C. Yves, J. Phys. Chem. C., 115 (2015) 19761.
21. M. Naebe, W. Jing, A. Amini, H. Khayyam, N. Hameed, H.L. Lu, C. Ying, F. Bronwyn, Sci. Rep., 4 (2014) 4375.
22.U. Zielke, K.J. Hüttinger, W.P. Hoffman, Carbon., 34 (1996) 983.
23.C. Casiraghi, A.C. Ferrari, J. Robertson, Phys. Rev. B: Condens. Matter Mater. Phys., 72 (2005) 85401.
24.Z. Ni, Y. Wang, T. Yu, Z. Shen, Nano Res., 1(4) (2008) 273.
25.C.N. Barnakov, G.P. Khokhlova, A.N. Popova, S.A. Sozinov, Z.R. Ismagilov, Eurasian. Chem. Technol. J., 17 (2015) 87.
26.L. Qie, W.M. Chen, Z.H. Wang, Q.G. Shao, X. Li, L.X. Yuan, X.L. Hu, W.X. Zhang, Y.H. Huang, Adv. Mater.(Weinheim, Ger.)., 24 (2015) 2047.
27.X. Song, Q. Ru, Y. Mo, S. Hu, B. An, J. Alloys Compd., 606 (2014) 219. 28.Z. Liu, K. Suenaga, P.J. Harris, S. Iijima, Phys .Rev. Lett., 102 (2009) 5501. 29.R. Sharma, J.H. Baik, C.J. Perera, M.S. Strano, Nano Lett., 10 (2010) 398. 30.N.X. Zhang, H.Q. Tang, J. Power Sources., 218 (2012) 52.