Regional variability in the trophic requirements
of shelf sea fisheries in the Northeast
Atlantic, 1973
e
2000
Michael R. Heath
Heath, M. R. 2005. Regional variability in the trophic requirements of shelf sea fisheries in the Northeast Atlantic, 1973e2000.
Hydrographic, plankton, benthos, fisheries landings, and fish diet data from shelf sea areas in the Northeast Atlantic have been combined into an analysis of the foodweb structure and secondary production requirements of regional fisheries. Fish landings from the Baltic and North Sea are shown to be taken from a lower trophic level and are shown to be overall more planktivorous than those from shelf edge regions. The secondary production required per unit of landed fish from the North Sea was approximately half that for landings from the southwest approaches to the UK, referred to as the Celtic Seas, where zooplankton production accounted for only a small fraction of the secondary production demands of the fisheries. In the North Sea, variability in zooplankton production seems to have exerted a bottom-up effect on fish production, which in turn has exerted a top-down effect on the benthos. Conversely, Celtic Seas benthos production has been a bottom-up driver of fish production, which seems to have been independent of variability in plankton production. Thus, climate and fishing pressures can be expected to influence these regional fisheries in very different ways. Overall, the results indicate very strong spatial patterns in the fish foodweb structure and function, which will be important considerations in the establishment of regional management plans for fisheries.
Keywords: benthos, fish diet, fisheries, food consumption, foodweb, plankton, production.
M. R. Heath: Marine Laboratory, PO Box 101, Victoria Road, Aberdeen AB11 9DB, Scotland, UK; tel:C44 1224 876544; fax:C44 1224 295511; e-mail:heathmr@marlab.ac.uk.
Introduction
There has been great progress in recent years towards understanding, quantifying, and modelling the factors that lead to geographical patterns and temporal changes in the structure and function of the low trophic levels of marine foodwebs, i.e. microbial, auto and heterotrophic plankton systems (e.g. Baretta Bekker et al., 1997). However, equivalent understanding of higher trophic level foodweb properties has not progressed to the same extent. Various mass balance and dynamic models have been applied to simulate fish foodwebs (Steele, 1974; Jones, 1982, 1984; Pauly et al., 2000; Christensen and Walters, 2004), but coupling these to lower trophic levels and models of the physical environment is challenging (deYounget al., 2004). Moreover, the data for evaluating such models are fragmentary and have rarely been analysed in such a way as to diagnose foodweb fluxes. However, as fisheries management moves towards a more regionally based
ecological approach to setting targets for exploitation, it is vital to know how the basic structure and function of foodwebs vary regionally and in response to climatic fluctuations and different exploitation regimes.
benthos due to the decline in groundfish abundance was correlated with an increase in benthic production and an expansion of crustacean fisheries. Hence, both bottom up and top down processes were active in the changing function of the foodweb. The results seem to confirm the North Sea as a case of ‘‘fishing down the foodweb’’ in the terminology ofPaulyet al.(1998). This is vital information for fisheries managers seeking to move away from independent, single species catch control measures for regulating North Sea fisheries, towards a regime that seeks to take a view of the overall status of fisheries and their role in the ecosystem.
The aim of this study was to replicate the North Sea foodweb analysis in different Northeast Atlantic shelf ecosystems in order to compare and contrast the fish foodweb structure and function. Some of the key issues to be addressed by the analysis were: (i) has ‘‘fishing down the foodweb’’ been a general feature of Northeast Atlantic fisheries; (ii) how does climate driven variability in plankton production affect the fish foodweb in different systems; and (iii) is benthos production generally subject to top down control by fish grazing pressure? These are some of the important structural and functional issues that will need to be addressed to support the development of regionally based management programmes for fisheries (Murawski, 2000).
Material and methods
The methods employed in this study have been explained in detail byHeath (2005), and will be only briefly reviewed here. The approach was originally based on an analysis by Greenstreet et al. (1997), and basically involved four stages:
(1) Annual landings (wet weight) of fish species from the region of interest were extracted from the ICES STATLANT database (http://www.ices.dk/fish/ statlant.asp) using the FAO FishStatC database program. Each species was assigned to one of four guilds (planktivores, benthivores, demersal pisci vores, or pelagic piscivores) based on documented feeding habits.
(2) The annual rations and diet compositions of landed fish from each guild were calculated from detailed data on weight specific rations and diets for a number of well studied species (2e4 species per guild). Clearly, it was important that these well studied species were also major constituents of the landing. The food ration of each guild was defined in terms of consumption (wet weight) of other fish from each of the four guilds, plus carnivorous and omnivorous zooplankton, and macrobenthos carnivores, filter and deposit feeders. Omnivorous zooplankton and
macrobenthos filter and deposit feeders were
considered to be the lowest trophic level in the analysis and referred to as secondary producers.
(3) The rations and diets of the landings from each guild were extrapolated to the whole community on the basis of estimates of the proportion of gross pro duction by each guild that was landed by the fishery. Gross production was derived from an analysis of the age structured stock assessment data for each of the main commercial species, and of trawl survey data to determine the contribution of the assessed species to the total biomass of each guild.
(4) The ration and dietary requirements of the fish community were converted from wet weight units to carbon units and standardized to the sea surface area of the region. These data were then compared with estimates of zooplankton and macrobenthos pro duction (g C m2y1) derived from zooplankton and benthic invertebrate larvae biomass estimates from Continuous Plankton Recorder (CPR) survey data and temperature data.
Heath (2005)focused on the North Sea, for which there are well published analyses of trawl survey data for estimating the biomass proportions of assessed species in each guild (e.g.Sparholt, 1990). However, the aim of this study was to widen the analysis to other regions of the European shelf seas for which there are, unfortunately, no equivalent analyses of trawl surveys, and in some areas, only rudimentary trawl survey coverage. Hence, the third stage of the methodology could not be completed. Stage 4 was therefore based on an analysis of the trophic require ments of the landings by the commercial fisheries (output from stage 2), rather than the requirements of the fish community as a whole.
To elaborate briefly on the steps involved in stage 2 of the analysis, the annual ration and composition of food consumed by each well studied species, expressed as a percentage of their biomass, were derived from the quarterly data presented byGreenstreetet al.(1997). These values were then compensated for interannual variability in temperature between 1973 and 2000 (Equation (3) in Heath, 2005). The prey composition of the annual ration was assumed constant from year to year for each species. Year specific consumption of each prey taxon per unit of well studied predator biomass was then raised to the landed weight of each well studied species. Finally, within each guild, g, the weighted average rations of the well studied species, s, were applied to all non well studied guild members, with weighting equal to the proportion of the landed catch of well studied species. Hence, the results represent the food consumed to support the fish production landed from each guild:
CdðlÞy;p;gZ Xs n
s 1
CdðlÞy;p;s !
Ly;g
X
s smax
s 1
Ly;s !
where Cd(l)y,p,sis the annual consumption of prey taxon p by
the landed fish of well studied species s in year y, n is the number of well studied species, and Ly,s and Ly,gare the
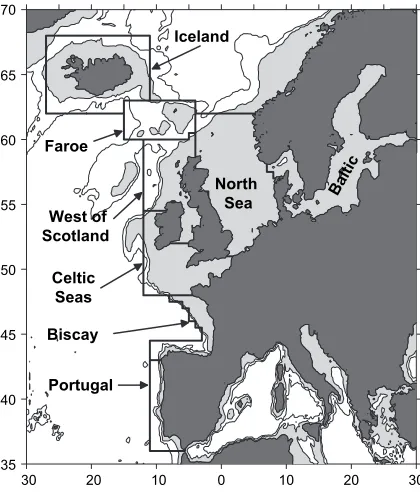
landed weights in year y of species s and guild g, respectively. The results from Equation(1)are referred to as the direct food requirements of the landed fish. However, the full impact of the fishery on lower trophic levels also included an indirect component made up of the zooplankton and benthos consumed by the fish prey of piscivorous fish landed by the fishery. This indirect component was estimated by reapplying stage 2 of the methodology to the fish prey of landed fish. The total requirement of the fishery for zooplankton and benthos productions was then the sum of the direct and indirect components. Finally, the full requirements of the fishery for secondary production (omnivorous zooplankton plus filter and deposit feeding macrobenthos) were calculated as the sum of these dietary components themselves, plus the dietary requirements of the carnivorous zooplankton and benthos consumed directly and indirectly by the fish. The latter were estimated assuming a gross growth efficiency of 0.3 for the carnivores. The ICES STATLANT database includes annual land ings from 1973 onwards for all ICES statistical data gathering areas in the Northeast Atlantic north of 36(N (Azores), and between 42(W (mid Atlantic Ridge) and 68(E (Bear Island), but excluding the Mediterranean Sea. In this study, only data from the Atlantic continental shelf areas between Portugal and the Faroe Islands, plus Iceland, were considered for analysis (Figure 1). STATLANT data are presented at various overlapping levels of geographic
resolution. In order to include all of the data it was necessary to adopt a coarser resolution than the standard ICES Statistical Areas. For example, ICES Statistical Area VIa (northwest of Scotland) had to be combined with Area VIIa (Irish Sea) to produce a region referred to as the ‘‘west of Scotland’’, and ICES Areas VIIb, d, e, f, g, h, and j (Celtic Sea, southwest Ireland, and Channel) were com bined to produce a region referred to here as the ‘‘Celtic Seas’’. The guild assignments of 149 fish species in the STATLANT database for the North Sea were given by Heath (2005). In all, 181 additional species required assignment as a result of the expanded study area, and these were carried out, as for the North Sea species, on the basis of dietary habits obtained from the literature, and in particular from FishBase (http://www.FishBase.org). An nual diet and ration data for the 13 well studied species (Table 1) needed for stage 2 of the methodology were taken fromHeath (2005).
Compilation of topographic, temperature, and CPR data for each region was carried out exactly as described by Heath (2005). Topographic data were used to estimate the sea surface area within ranges of seabed depth for each STATLANT region. Monthly average sea temperature data were compiled for two layers (surface 30 m depth, and 30 m seabed) in each STATLANT region, from data archived in international databases. Monthly average abundances (g C m2
) of a range of mesozooplankton taxa were compiled for those STATLANT regions covered regularly by the CPR surveys (North Sea, west of Scotland, and Celtic Seas) following the methodology of Broekhuizen et al. (1995), and used to estimate annual production. Mesozooplankton omnivore production estimation fol lowed the temperature dependent equation ofHuntley and Lopez (1992).
The estimation of benthic production was most prob lematic, since there are no regional scale time series data on benthic fauna that could be used to derive production estimates, apart from CPR data on the abundance of planktonic larvae of benthic invertebrates (Echinodermata and Decapoda).Heath (2005)devised a crude method to estimate benthic production from these data, which in volved scaling the log mean abundance of the larvae such
that the mean value during 1983e1985 matched the
estimate of North Sea benthic carnivore production assumed by Greenstreet et al. (1997) (1.3 g C m2y1).
This rate of production was derived from analyses of the ICES North Sea Benthos Survey data (Duineveld et al., 1991; Heipet al., 1992). The logic for the approach was that the abundance of larvae could represent an index of the spawning biomass of the parent stock. For the study described here, the issue was whether the same scaling factor could be applied to estimate benthic production in regions other than the North Sea. Unfortunately, there are currently no clear answers to this question so, while the same scaling factor was applied in all areas, the results should be considered as tentative.
30 20 10 0 10 20 30
35 40 45 50 55 60 65 70
Iceland
Faroe
West of Scotland
Celtic Seas
Biscay
Portugal
North
Sea B
[image:3.539.44.254.414.661.2]alti c
Table 1. Species ranking according to 1973e2000 average landings (tonnes) by region for each fish guild. The listed species cumulatively accounted for a minimum of 90% of total average landings in each case. Also shown for each guild are the total numbers of landed species by region. Data compiled from the ICES STATLANT database. Species shown in bold with an asterisk in the left-hand column were the well studied species for which ration and diet data were available fromGreenstreetet al.(1997).
Common name Scientific name Portugal Biscay Celtic
Seas
West of Scotland Baltic
North
Sea Faroe Iceland
(a) Planktivore guild
Capelin Mallotus villosus 1
Redfish Sebastes marinus 3 2
*Atlantic herring Clupea harengus 1 2 1 3 3
*Norway pout Trisopterus esmarkii 3 3 2 2
Blue whiting Micromesistius poutassou 2 3 2 1 4 1
*Sandeels Ammodytesspp. 1
*Sprat Sprattus sprattus 4 2 4
Pilchard Sardina pilchardus 1 1 3
Anchovy Engraulis encrasicolus 3 2
Pomfret Brama brama 4
Cumulative % of guild landings 91.3 91.3 90.6 92.1 93.1 96.4 90.7 96.7
Total number of species recorded 40 35 29 28 28 34 19 12
(b) Benthivore guild
*European plaice Pleuronectes platessa 7 2 1 1 1 2 1
Lumpfish (Lumpsucker) Cyclopterus lumpus 8 2
*Common dab Limanda limanda 8 6 3 3 3
American plaice (Long rough dab)
Hippoglossoides platessoides 4
*Lemon sole Microstomus kitt 6 5 5 1
Common sole Solea solea 4 4 4 3 2
Grey gurnard Eutrigla gurnardus 4
European flounder Platichthys flesus 2
Eelpout Zoarces viviparus 4
European perch Perca fluviatilis 4
Witch flounder Glyptocephalus cynoglossus
9 9 4 4
Roach Rutilus rutilus 7
Megrim Lepidorhombus whiffiagonis 1 1 1 2
Pouting Trisopterus luscus 2 2 3 7
Red gurnard Chelidonichthys cuculus 5 5 8
Black sea bream Spondyliosoma cantharus 3 3 7
Wedge sole Dicologlossa cuneata 5
Turbot Psetta maxima 6
Grunt Haemulidae
(Pomadasyidae)
8
Dentex Dentexspp. 6
Axillary sea bream Pagellus acarne 7
Cumulative % of guild landings 90.2 90.3 91.9 90.4 90.7 91.4 91.5 90.2
Total number of species recorded 54 42 38 35 30 35 20 20
(c) Demersal piscivore guild
*Atlantic cod Gadus morhua 3 2 1 1 2 1
*Saithe (Pollock) Pollachius virens 10 1 3 2 1 2
*Haddock Melanogrammus aeglefinus 9 4 4 3 3 3
Greenland halibut Reinhardtius hippoglossoides 7 4
Tusk Brosme brosme 4
Blue ling Molva dypterygia 5
Ling Molva molva 9 5 5 5 6 6
*Whiting Merlangius merlangus 8 4 1 3 2 4 8
Results
The species composition of the landings from the four fish guilds varied with latitude across the Northeast Atlantic shelf regions. Within each guild, the number of species recorded in the landings decreased with increasing latitude, and the dominant species were different at the northern and southern ends of the latitudinal range (Table 1). The well studied diet and ration species used by Greenstreetet al. (1997) and Heath (2005) as the basis for calculating the prey consumption of fish guilds, were dominant only in the mid latitude regions (Celtic Seas, west of Scotland, North Sea, and Baltic). Derivation of foodweb fluxes was therefore constrained to these four regions.
The Celtic Seas and west of Scotland regions have, within their domain, waters of ocean depth (O1000 m), as well as shallow shelf seas. However, the majority of landings from these regions were of species that inhabit the continental shelf and slope waters (!500 m). The main exception was the planktivore species blue whiting (Micromesistius poutas sou). This is a deepwater migratory species, and the fishery is conducted mainly off the continental shelf to the west of Ireland and Scotland in spring, and later in the year around
Faroe and in the Norwegian Sea (see Figure 6.2.2 inAnon., 2004). Landings from the inner shelf regions (North Sea and Baltic) comprise mainly juveniles. Hence, there was no rationale for a foodweb connection between the bulk of the blue whiting catch and the other landed species from the Celtic Seas and west of Scotland. Blue whiting catches from these regions were therefore discarded from the calculations below, and all area scaling was based on the sea surface area of waters shallower than 500 m.
For each region, the annual consumption and composi tion of food eaten by the landed fish in each guild during 1973e1999 was estimated as described in theMaterial and methods. The total harvest of fish by the fisheries was viewed as being made up of a direct component (landed by the fishery), plus an indirect component representing piscivorous feeding during the year by the landed fish up to their time of capture. The fraction of total planktivore and benthivore harvest by the fishery, which was due to the indirect (piscivory) component, varied considerably be tween the regions. For the planktivores, direct fishery landings greatly exceeded indirect piscivorous component in the North Sea and Baltic (indirect losses: 20e30% of total), whilst the indirect component formed the major part Table 1 (continued)
Common name Scientific name Portugal Biscay Celtic
Seas
West of Scotland Baltic
North
Sea Faroe Iceland
Angler Lophiidae 6 2 4 9 9
Dogfish Squalusspp 7 7 6 5
European hake Merluccius merluccius 1 1 2 7
Raja rays Rajaspp 4 6 6 8
Roundnose grenadier Coryphaenoides rupestris 10
Pollack Pollachius pollachius 7 8
Small-spotted catshark Scyliorhinus canicula 11
European conger Conger conger 3 3 12
European sea bass Dicentrarchus labrax 8 Silver scabbardfish Lepidopus caudatus 2 Black scabbardfish Aphanopus carbo 5
Cumulative % of guild landings 90.3 90.31 91.3 91.1 90.2 91.6 90.4 93.2
Total number of species recorded 74 65 64 62 33 64 41 39
(d) Pelagic piscivore guild
Various sharks Selachimorpha (Pleurotremata)
1
*Atlantic mackerel Scomber scombrus 3 2 1 1 1 1 1 2
Porbeagle Lamna nasus 3
*Atlantic horse mackerel Trachurus trachurus 1 1 2 2 2 2 2
Albacore Thunnus alalunga 4 3
Chub mackerel Scomber japonicus 2
Swordfish Xiphias gladius 5
Cumulative % of guild landings 91.7 93.9 99.1 99.9 99.4 99.8 99.6 98.9
[image:5.539.45.485.88.393.2]of the total harvest off the west of Scotland, and particularly in the Celtic Seas (70e80%) (Figure 2). By far the largest
fraction of the indirect harvest was predation by demersal piscivores. Thus, the results are an indication that the fishery was much more intensively focused on piscivores than planktivores in the western shelf edge regions than in the North Sea and Baltic.
The biomass of secondary producers (g C m2y1 of omnivorous zooplankton, filter and deposit feeding macro benthos) consumed directly and indirectly each year by the landed fish was calculated for each of the four mid latitude regions (Figure 3). Averaged over time, the fish landed
from the regions consumed between 1.25 and
1.75 g C m2y1of secondary production. However, whilst
60e80% of this production was accounted for by
zooplankton in the Baltic, North Sea, and west of Scotland, only 40% on average was supplied by zooplankton in the Celtic Seas. Piscivores (demersal and pelagic) accounted forO70% of the demand for benthic deposit and filter feeder production in all areas. Planktivores represented the majority (60e90%) of the fishery landings demand for omnivorous zooplankton production in the Baltic and North Sea. However, piscivores were once again the major component of the fishery demand for zooplankton pro duction in the western regions, as a result of their predation on the planktivores.
The total direct and indirect fishery demand for secondary production decreased between 1973 and 1999 in all areas except the Celtic Seas. Demersal piscivores accounted for a decreasing proportion of the demand in all areas (Figure 4). The corresponding increase in proportion of demand by other guilds was mainly due to planktivores in the Baltic and North Sea and pelagic piscivores in the Celtic Seas and west of Scotland. Similarly, the proportion of fishery demand for secondary production, which was supplied by zooplankton, increased in the Baltic and North Sea, and decreased in the Celtic Seas and west of Scotland.
The trophic efficiency of the guild harvesting pattern in each region was estimated as the amount of secondary production required per unit of landed fish biomass (g C g C1). Approximately 3 g C of secondary production
was required per g C of landed fish from the Baltic, North Sea, and west of Scotland. The Celtic Seas stood out as being very different. From 1980 onwards, efficiency decreased as pelagic piscivore (mackerel and horse mackerel) landings increased as a proportion of the total, and from the late 1980s onwards approximately 6.5 g C of secondary production was needed per g C of landed fish (Figure 5).
Omnivorous zooplankton gross production, based on the analysis of CPR and temperature data, was between 10 and 60 g C m2y1in the Celtic Seas, North Sea, and west of Scotland regions, with no significant underlying trends in any of the areas (1973e1999 average production: Celtic Seas
44.3 g C m2y1, North Sea 35.3 g C m2y1, and west of Scotland 22.6 g C m2y1) (Figure 6a). There were no equivalent estimates for benthic secondary producers (deposit and filter feeders), but the spatial and temporal pattern in the tentative estimates of benthic carnivore gross production was in contrast to the zooplankton. Benthic carnivore gross production was estimated to be between 0.1 and 1.9 g C m2y1, with an underlying increasing trend in all areas (1973e1999 average production: Celtic Seas
0.8 g C m2y1, North Sea 1.3 g C m2y1, and west of Scotland 0.5 g C m2y1) (Figure 6b). No equivalent data on plankton or benthos production were available for the Baltic. The North Sea and west of Scotland fishery demands for omnivorous zooplankton prey were positively correlated over time with omnivorous zooplankton production, and apparently governed by a common relationship (Figure 7a). In those regions, the demands for zooplankton represented, on average, 5% of zooplankton gross production. Data from the Celtic Seas clearly did not conform to this relationship. There was no significant relationship over time between demand and production and, on average, the fishery demanded only 1% of the zooplankton gross production. This was partly due to the low contribution of planktivores to the total fishery landings.
Unlike the zooplankton, the macrobenthos was subjected to both a direct fishery and an indirect fishery impact through consumption by landed finfish. However, for the macro benthos carnivores, direct landings were only a small component of the total direct plus indirect fishery harvest (!10% in all areas,!3% in the Celtic Sea). The proportion of benthic carnivore gross production required as food by the fish landings apparently varied considerably between regions (1973e1999 averages: North Sea 5.2% s.d. 2.2%, Celtic Seas 14.4% s.d. 6.1%, and west of Scotland 24.2% s.d. 13.6%). As for the zooplankton, the temporal variations in North Sea and west of Scotland fishery demands for benthic carnivore prey were correlated with benthic carnivore production, and apparently governed by a common relationship (Figure 7b). However, in this case, the relationship was inverse. Once again, the Celtic Seas stood out as being different from the 0
0.2 0.4 0.6 0.8
1973 1976 1979 1982 1985 1988 1991 1994 1997 2000
North Sea Baltic West of Scotland Celtic Seas
Proport
on of p
ankt
vore harvest
taken
nd
rect
[image:6.539.59.265.495.647.2]y
other regions, having a significant positive relationship between production and demand.
Discussion
Limitations and assumptions of the methodology
A major limitation of the present analysis, and that ofHeath (2005), was the use of fixed diet compositions and weight specific rations (albeit temperature adjusted) for each well studied species. These were established from the literature
and the data survey of Greenstreet et al. (1997), which gathered fragmentary information from a number of age classes, years, and study areas. However, changes in prey composition and abundance, and the age composition of the well studied species must influence the population level diet and ration. There is little that can be done to avoid the assumption of a fixed diet composition in a data based analysis such as this. Alternatives include equally uncertain assumptions about prey selectivity, and the implementation of dynamic equations to estimate consumption directly from measures of prey abundance and availability.
Secondary product
on requ
rements of the f
shery gC m
-2 y
-1
0 0.5 1 1.5 2 2.5 3
0 0.5 1 1.5 2 2.5 3
0% 20% 40% 60% 80% 100%
0 0.5 1 1.5 2 2.5 3
0% 20% 40% 60% 80% 100%
1973197619791982198519881991199419972000 1973197619791982198519881991199419972000 0%
20% 40% 60% 80% 100%
0 0.5 1 1.5 2 2.5 3
0% 20% 40% 60% 80% 100%
Benthic filter-feeders
Benthic
deposit-feeders a) Baltic
b) North Sea
c) West of Scotland
d) Celtic Seas
[image:7.539.127.407.72.502.2]Omnivorous zooplankton
Assigning fish species to guilds will always involve some potentially controversial decisions. There are few data on diet composition for many of the less commonly encoun tered species in the landings data for the region. In those cases it was necessary to reach a decision on qualitative data, often from studies outside the region, or on similar species. However, provided that the major species, and especially the well studied and assessed species, were correctly assigned, this limitation should not be critical for the analysis presented here. The first priority of the guild aggregation was to condense the taxonomic detail to a level that still reflected the fundamental structure of the foodweb, without the intricacies of individual species.
The methodology for estimating zooplankton production also involved some potentially controversial assumptions that have been discussed byHeath (2005). They included the methodology for the conversion of CPR data into depth integrated abundance of plankton taxa and the use of temperature dependent, weight specific growth rates esti mated from empirical relationships (Huntley and Lopez, 1992) to determine production. The results indicate an average gross production rate of around 35 g C m2y1in the North Sea, roughly equivalent to 80 g dry weight m2y1, which is high compared with the 44 g dry weight m2y1 estimated by Steele (1974). However, Steele’s estimate was for herbivore production, whereas the
Secondary product
on requ
rements of the f
shery gC m
-2 y
-1
0 0.5 1 1.5 2 2.5 3
0% 20% 40% 60% 80% 100% 0
0.5 1 1.5 2 2.5 3
0% 20% 40% 60% 80% 100%
0 0.5 1 1.5 2 2.5 3
0% 20% 40% 60% 80% 100%
0% 20% 40% 60% 80% 100%
0 0.5 1 1.5 2 2.5 3
a) Baltic
b) North Sea
c) West of Scotland
d) Celtic Seas
Pelagic piscivores
Demersal piscivores
Planktivores Benthivores
[image:8.539.138.418.69.480.2]1973197619791982198519881991199419972000 1973197619791982198519881991199419972000
calculations made here represent the gross production of omnivores, and hence include an unquantified component of recycled production within the guild attributable to carnivory.
More difficult than the estimation of changes in zooplankton production was the derivation of benthic production. In this case, there were no precedents for a methodology and few previously published estimates of production. The logic for the empirical approach adopted here was that the abundance of planktonic larvae of macrobenthos could represent an index of the spawning population biomass and hence production, assuming a constant P:B ratio. However, this is a somewhat tentative aspect of the study.
Fishery and foodweb fluxes
The first clear conclusion from this study is that fisheries in the Baltic and North Seas have been concentrated at a lower trophic level in the foodweb than in the shelf edge regions west of Scotland and especially in the Celtic Seas. Thus, the indirect harvest of planktivorous fish through the diet of landed piscivores was greater than the direct fishery landings from the Celtic Seas and west of Scotland, but substantially less in the North Sea and Baltic. Twice as much secondary production was required to support a unit biomass of landed fish from the Celtic Seas than from the North Sea. Presumably, this is primarily a consequence of the practice of large scale industrial fishing for sandeels and Norway pout in the Baltic and especially in the North Sea. In contrast, there have been only small scale industrial fisheries for sandeels off the west of Scotland and in the Celtic Seas. The data indicate that, over time, fisheries in the North Sea and Baltic have moved down the trophic scale, becoming more dependent on planktivores and benthivores, whilst those at the shelf edge, especially in the Celtic Seas, have tended to move up the trophic scale, becoming more dependent on piscivores.
The results indicate a positive correlation between the annual production of omnivorous zooplankton in the North Sea and west of Scotland regions, and the amount of zooplankton needed to support the fishery landings. The latter is a reflection of both the quantity and guild/species composition of the landings. The implication is that the fishery landings (in the broadest sense) in these regions are, to a large extent, bottom up, driven by zooplankton production. In the North Sea, 60e70% of the demand for
zooplankton was due to planktivore landings, whilst the proportion was rather smaller (30e50%) off the west of
Scotland where pelagic piscivores (mainly Atlantic
mackerel) were significant consumers of zooplankton. However, in both regions the fishery demand was approximately 5% of zooplankton production. The Celtic Seas stood out as being very different. There was no underlying relationship between zooplankton production and demand from the landed fish, and the average demand was only approximately 1% of zooplankton production. In this region, less than 20% of the fishery demand for zooplankton production was contributed by planktivores, and zooplankton constituted only 40% of the total demand for secondary production, compared with 60e80% in the other regions.
The proportions of benthic invertebrate carnivore pro duction needed, directly and indirectly, to support the landed fish seem greater than for omnivorous zooplankton (up to 25% on average for benthos, compared with 5% for zooplankton). In addition, for the North Sea and west of Scotland, benthic carnivore production has been inversely related to the demands of the fishery. As a consequence, in this case the indications are of high predation pressure on the benthos, and top down effects on benthic production. Once again, the Celtic Seas stand out as being different in this respect. The fisheries there made high demands on macrobenthos production (average 15% per year), and benthos supplied around 60% of the secondary production needs of the fisheries. Yet, the relationship between benthic carnivore production and fishery demand was clearly positive, implying a bottom up effect of benthic production on fisheries.
To summarize, fisheries in the interior of the continental shelf, in the North Sea and Baltic, have been concentrated at a lower trophic level than those at the shelf edge, in the Celtic Seas and west of Scotland. In the North Sea, variability in plankton production has exerted a bottom up effect on the fisheries (landings and guild/species compo sition), which in turn have exerted a top down effect on the benthos. In marked contrast, the piscivore dominated fisheries in the Celtic Seas have made heavier demands on, and been driven more by variability in, benthic production. It appears that the west of Scotland ecosystem has behaved in a manner somewhere in between the North Sea and Celtic Seas. In the absence of plankton and benthos production data, the Baltic is assumed to have behaved more like the North Sea.
0 1 2 3 4 5 6 7 8
1973 1976 1979 1982 1985 1988 1991 1994 1997 2000
Secondary product
on per un
t
of
anded f
sh (gC gC
-1)
[image:9.539.51.254.69.212.2]The above summary begs the question as to what is driving variability in benthos production in the Celtic Seas, and how does this differ from the North Sea, given that annual production in the two regions is similar. One possible hypothesis is that, after accounting for fish predation, other losses from the benthos are essentially density dependent (Ebenho¨het al., 1995). If this is so, then for given annual rates of consumption by fish and gross production by benthos, the net production will be directly related to productivity, i.e. gross production per unit
biomass. One would then expect that, all things being equal, a low productivity system would have a greater propensity for top down control than a high productivity system. So, following this hypothesis to its logical conclusion would indicate that the benthic productivity of the Celtic Seas must be higher than that of the North Sea. There is relatively little information on which to base a comparison of benthic productivity in the Celtic Seas and North Sea. Temperature will certainly be an important factor, and the Celtic Seas are on average about 3(C warmer than the North Sea (Figure 6c). Species composi tion, coupled with sediment type, will be another major factor affecting productivity. Analysis of average life spans indicates that annual production/biomass ratios are around three times higher for species that inhabit sandy sediments such as in the southern North Sea and Celtic Seas, than those in muddy areas such as the northern North Sea (Duineveldet al., 1991). Carbon input to the benthos from the euphotic zone will also be a major driver of variability in production. In hydrographically stratified waters such as much of the northern North Sea, primary production in the euphotic zone generates a vertical flux of detrital material to the seabed which is grazed by the filter and deposit feeders. However, in vertically well mixed areas, the benthic filter feeders have direct access to the material in the euphotic zone and can operate as if they were ‘‘anchored omnivorous zooplankton’’. If the area is also subject to strong horizontal exchanges, as in the Celtic Seas, then the filter feeders have a particular advantage and should exhibit enhanced productivity.
On the basis of these results, one can speculate as to how climate might affect the fisheries in the different regions of the European shelf seas. There are probably two main mecha nisms for climateefisheries correlations: zooplanktone
fish foodweb connections, and temperature/advective
effects on life cycle processes. One could hypothesize that systems such as the North Sea and Baltic, where the focus of fisheries is closer to zooplankton production, would be most likely to display foodweb based fish erieseclimate correlations, since it is clear that zooplank ton production and seasonal cycles are rather tightly coupled to aspects of climate variability (Beare et al., 2002; Beaugrand et al., 2002; Edwards and Richardson, 2004). Indeed, there is strong evidence for a foodweb based connection between cod production in the North Sea and zooplankton species composition and abundance, correlated with temperature variability (Beaugrand et al., 2003).
On the other hand, fisheries, which have operated at a higher trophic level, might be less likely to show clear links between climate, zooplankton, and fish. In this case, climate connections may operate through physical effects on the life cycles and migrations of key species, such as horse mackerel that, as in the North Sea (Reidet al., 2001), have increased their northerly range in parallel with temperature changes, becoming a major component of the 0
10 20 30 40 50 60 70 80
0 0.4 0.8 1.2 1.6 2
4 6 8 10 12 14
1973 1976 197 9
1982 1985 198 8
1991 1994 1997
North Sea Baltic West of Scotland Celtic Sea
Omn
vorous zoop
ankton
product
on gC m
-2 y
-1
Benth
c carn
vore
product
on gC m
-2 y
-1
Average temperatur
e
a)
b)
[image:10.539.60.265.72.493.2]c)
fishery. However, the discovery here of an apparent bottom up linkage between benthic production and fisheries in the Celtic Seas means that in some areas, perhaps those characterized by strong vertical mixing and horizontal flushing, we should also consider the role of planktone
benthos coupling processes in the connections between climate and fisheries.
Acknowledgements
This work was supported by the Scottish Executive Environment and Rural Affairs Department. Thanks to John Steele for helpful review comments, the Sir Alister
Hardy Foundation for Ocean Science for supplying Continuous Plankton Recorder Data, and the ICES Hydrographic Service for providing temperature data.
References
Anon. 2004. Report of the Northern Pelagic and Blue Whiting Fisheries Working Group. Chapter 6, Blue Whiting. ICES CM 2004/ACFM:24. pp. 141e142. http://www.ices.dk/reports/
ACFM/2004/WGNPBW/S6.pdf.
Baretta-Bekker, J. G., Baretta, J. W., and Ebenho¨h, W. 1997. Microbial dynamics in the marine ecosystem model ERSEM II with decoupled carbon assimilation and nutrient uptake. Journal of Sea Research, 38: 195e213.
Beare, D. J., Batten, S., Edwards, M., and Reid, D. G. 2002. Prevalence of boreal Atlantic, temperate Atlantic and neritic zooplankton in the North Sea between 1958 and 1998 in relation to temperature, salinity, stratification intensity and Atlantic inflow. Journal of Sea Research, 48: 29e49.
Beaugrand, G., Brander, K. M., Lindley, J. A., Soussi, S., and Reid, P. C. 2003. Plankton effect on cod recruitment in the North Sea. Nature, 426: 661e664.
Beaugrand, G., Reid, P. C., Iban˜ez, F., Lindley, J. A., and Edwards, M. 2002. Reorganisation of North Atlantic marine copepod bio-diversity and climate. Science, 296: 1692e1694.
Broekhuizen, N., Heath, M. R., Hay, S. J., and Gurney, W. S. C. 1995. Modelling the dynamics of the North Sea’s mesozoo-plankton. Netherlands Journal of Sea Research, 33: 381e406. Christensen, V., and Walters, C. J. 2004. Ecopath with Ecosim:
methods, capabilities and limitations. Ecological Modelling, 172: 109e139.
Duineveld, G. C. A., Ku¨nitzer, A., Niermann, U., de Wilde, P. A. W. J., and Gray, J. S. 1991. The macrobenthos of the North Sea. Netherlands Journal of Sea Research, 28: 53e65. Ebenho¨h, W., Kohlmeier, C., and Radford, P. J. 1995. The benthic
biological submodel in the European regional seas ecosystem model. Netherlands Journal of Sea Research, 33: 423e452. Edwards, M., and Richardson, A. J. 2004. Impact of climate change
on marine pelagic phenology and trophic mismatch. Nature, 430: 881e884.
Greenstreet, S. P. R., Bryant, A. D., Broekhuizen, N., Hall, S. J., and Heath, M. R. 1997. Seasonal variation in the consumption of food by fish in the North Sea and implications for foodweb dynamics. ICES Journal of Marine Science, 54: 243e266.
Heath, M. R. 2005. Changes in the structure and function of the North Sea fish foodweb, 1973e2000. ICES Journal of Marine Science, 62.
Heip, C., Basford, D., Craeymeersch, J. A., Dewarumez, J-M., Do¨rjes, J., de Wilde, P., Duineveld, G., Eleftheriou, A., Herman, P. M. J., Niermann, U., Kingston, P., Ku¨nitzer, A., Rachor, E., Rumohr, H., Soetaert, K., and Soltwedel, K. 1992. Trends in biomass, density and diversity of North Sea macrofauna. ICES Journal of Marine Science, 49: 13e22.
Huntley, M. E., and Lopez, M. D. G. 1992. Temperature dependent production of marine copepods: a global synthesis. American Naturalist, 140: 201e242.
Jones, R. 1982. Species interactions in the North Sea. Canadian Special Publication of Fisheries and Aquatic Sciences, 59: 48e63.
Jones, R. 1984. Some observations on energy transfer through the North Sea and Georges Bank food webs. Rapports et Proce`s-verbaux des Re´unions du Conseil International pour l’Explora-tion de la Mer, 183: 204e217.
Murawski, S. A. 2000. Definitions of overfishing from an ecosystem perspective. ICES Journal of Marine Science, 57: 649e658.
0 0.4 0.8 1.2 1.6 2
0 20 40 60
a)
0 0.1 0.2
0 0.5 1 1.5 2
b)
F
shery requ
rement for
zoop
ankton gC m
-2 y
-1
Benth
c carn
vore
harvest gC m
-2 y
-1
Zooplankton production gC m-2 y-1
Benthic carnivore production gC m-2 y-1
North Sea West Scotland Celtic Seas Figure 7. (a) Direct and indirect requirements (Q, g C m 2y 1) of the landed fish from the North Sea, west of Scotland, and Celtic Seas for omnivorous zooplankton, compared with omnivorous zooplankton production (P, g C m 2y 1). North Sea, Q
Z
1.075C0.009P, r2
Z0.15, p!0.025; West of Scotland, QZ0.793C0.008P, r2
Z0.20, p!0.010; Celtic Seas, r2
Z
[image:11.539.47.254.69.375.2]Pauly, D., Christensen, V., Dalsgaard, J., Froese, R., and Torres, F. 1998. Fishing down marine foodwebs. Science, 279: 860e863.
Pauly, D., Christensen, V., and Walters, C. 2000. Ecopath, Ecosim, and Ecospace as tools for evaluating ecosystem impact of fisheries. ICES Journal of Marine Science, 57: 697e706. Reid, P. C., Borges, M.de F., and Svendsen, E. 2001. A regime
shift in the North Sea circa 1988 linked to changes in the North Sea horse mackerel fishery. Fisheries Research, 50: 163e171.
Sparholt, H. 1990. An estimation of the total biomass of fish in the North Sea. Journal du Conseil International pour l’Exploration de la Mer, 46: 200e210.
Steele, J. H. 1974. The Structure of Marine Ecosystems. Blackwell, Oxford. 128 pp.