Rochester Institute of Technology
RIT Scholar Works
Theses
Thesis/Dissertation Collections
1997
A Study of the effects of damage on 7781/795
E-glass/Eproxy laminates: Investigations of
experimental techniques and development of a
predictive model
Blake Carnahan
Follow this and additional works at:
http://scholarworks.rit.edu/theses
This Thesis is brought to you for free and open access by the Thesis/Dissertation Collections at RIT Scholar Works. It has been accepted for inclusion in Theses by an authorized administrator of RIT Scholar Works. For more information, please [email protected].
Recommended Citation
A STUDY OF THE EFFECTS OF DAMAGE ON
7781/E-795
E-GLASS/EPOXY LAMINATES: Investigation of
Experimental Techniques and Development of a
Predictive Model
by
Blake A. Carnahan
A Thesis Submitted
In
Partial Fulfillment
of the
Requirements for the
MASTER OF SCIENCE
In
Mechanical Engineering
Approved by:
Professor
M.R.
ScanlonThesis Advisor
Professor
_
Professor
_
Professor
_
Department Head
DEPARTMENT OF MECHANICAL ENGINEERING
COLLEGE OF ENGINEERING
ROCHESTER INSTITUTE OF TECHNOLOGY
A STUDY OF THE EFFECTS OF DAMAGE ON
7781/795
E-GLASS/EPOXY LAMINATES: Investigation of Experimental
Techniques and Development of a Predictive Model
I, Blake A. Carnahan, hereby grant permission to the Wallace Library of the
Rochester Institute of Technology to reproduce my thesis in whole or in part.
Any reproduction will not be for commercial use or profit.
ACKNOWLEDGMENTS
I would like to take time tothank the
following
people who helped methroughoutmy research:
Dr. Scanlon for hercontinuous confidence and guidance as an advisorand friend
Richard Fuse and Fibercote Industries Inc. fortheirdonation of materials
Professor
Creveling
for his instruction in Taguchi MethodsDr. Gupta for the facilities and advice
Dr. Nilsen for his
imaging
assistanceProfessor Lundgren for his recommendations
Mike
Gartley
for hiskey
and modelinghelp
I would especially like to thank my
family
for all oftheirendless support andA STUDY
OF THE EFFECTS OF DAMAGE ON
7781/E-795
E-GLASS/EPOXY
LAMINATES:
Investigation
ofExperimental Techniques
andDevelopment
of aPredictive Model
ABSTRACT:
Composite materials are used in a vast number of areas. Typical areas of
use are in aircraft, space, and marine applications. Due to the nature of these
applications, the materials may be exposed to various conditions which can
inhibit their performance. Factors such as moisture and temperature are
constantly changing, and measures must be taken to
fully
understand howenvironmental variations effect the performance of the components. Physical
damage is also regularly encountered in these harsh environments as well as
throughout the manufacturing and assembly of the products. The focus of this
research is to explore and quantify the effects which these damage types have
on the tensile strength of 7781/E-795 bi-directional
E-glass/epoxy
compositelaminates after an environmental exposure. Orthogonal arrays and Taguchi
Techniques were used to accomplish this task in an efficient, repeatable, and
well structured manner. An exposure time/tensile strength predictive model is
also developed which can be used to simulate and test material performance in
TABLE OF CONTENTS
LIST OF
FIGURES
iiiLIST OF TABLES iv
1.0 INTRODUCTION 1
2.0 LITERATURE REVIEW
2.1 ENVIRONMENTAL EFFECTS ON PROPERTIES 5
2.2 STRESS CORROSION FAILURE METHODS 10
2.3 INTERLAMINARCRACK GROWTH 16
2.4 MOISTURE ABSORPTION 18
3.0 BACKGROUND
3.1 ROBUST DESIGN 20
3.2 ASTM TESTING 31
3.2.1 ASTMD638 32
3.2.2 ASTM D3039 37
3.2.3 ASTM D5083 41
4.0 SPECIMEN PREPARATION
4.1 MATERIALS 43
4.2 PROCESSING 43
5.0 GENERAL TESTING PROCEDURES
5.1 IDENTIFICATION 45
5.2 MEASUREMENTS 45
6.0 NOISE EXPERIMENT
6.1 EXPERIMENTAL
6.1.1 PROCEDURES 47
6.2 RESULTS 51
7.0
HEAT/MOISTURE
7.1
EXPERIMENTAL
7.1.1 PROCEDURES 60
7.2 RESULTS 61
7.3 DISCUSSION 62
8.0 MODELING
8.1 EXPERIMENTAL
8.1.1 PROCEDURES 63
8.2 RESULTS 65
8.3 DISCUSSION 71
9.0 CONCLUSIONS 76
10.0 FUTURE RECOMMENDATIONS 79
LIST OF FIGURES
Figure 3.1: General Noise Diagram 22
Figure 3.2: Composite Laminate Noise Diagram 25
Figure 3.3: Standard L4
Array
26Figure 3.4: General Factor Effects Plot 28
Figure 3.5: D638 Tensile Specimen Dimensions 34
Figure 3.6: D3039 Tensile Specimen Dimensions 38
Figure 6.1: Noise Experiment Test
Array
47Figure 6.2:
Nicking
Fixture 49Figure 6.3: Micrograph ofCross-section 100x 52
Figure 6.4: Noise Factor Response Plot 55
Figure 8.1: Tensile Strength vs. Exposure Time 67
Figure 8.2: Weight Gain vs. Exposure Time 68
Figure 8.3: Experimental and Model Tensile Strength vs. Exposure Time 69
Figure 8.4: Verification and Model Tensile Strength vs. Exposure Time 70
Figure 8.5: Interface/Fiber Damage 1000x 72
Figure 8.6: Rectangular
Step
Input(Boiling)
73Figure 8.7: Exponential
Decay
(TensileStrength)
74Figure 9.1: Warp/Fill Interfacial Voids 200x 76
Figure 10.1: Crossed
Array
80LIST
OF
TABLES
Table 6.1:
Baseline
ResultsSummary
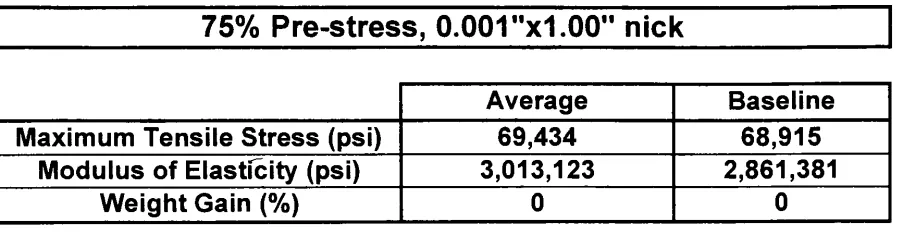
52Table 6.2: 75% Pre-stress and Nick Results
Summary
53Table 6.3: 75% Pre-stress and Boil Results
Summary
54Table 6.4: Nick and Boil Results
Summary
54Table 6.5: Noise Factor Response Table 55
Table 6.6: Analysis ofVariance Table 56
Table 7.1: 6hrBake
@
212F ResultsSummary
61Table 7.2: 6hr Distilled Water Soak Results
Summary
61Table 8.1: Model Development Times 63
Table 8.2: Model Verification Times 64
Table 8.3:
Modeling
ResultsSummary
651.0
INTRODUCTION
Composite
materials are used in a vast number of areas. The typicalareas of use are in aircraft, space, and marine applications. Due to the nature of
these applications, the materials may be exposed to environmental conditions
that can inhibit their performance. Airplanes operate in environments ranging
from
dry
deserts to humid rain forests. A radome must also retain its structuralintegrity
throughouttropical,
desert,
and arctic climates. Constant exposure tomoisture in marine environments also effects the performance of composite
materials. Because these factors such as moisture and temperature are
constantly changing, measures must be taken to
fully
understand howenvironmental variations effect the performance of the components. Adverse
environments are not the only way
by
which composite materials are degraded.Physical damage is also regularly encountered in these harsh environments as
well as throughout the manufacturing and assembly ofthe products. Throughout
their
lifetime,
aircraft, space vehicles, and marine vessels become damagedby
everyday abuse and contact with various debris
during
their voyages. Theimpairments may appear to be insignificant or even microscopic, so the damage
goes unnoticed
during
routine inspections. For this reason, it is important thatmeasures be taken such that the cumulative effects of incurred damage are well
This research focuses on the investigation of various damages and their
effects on the mechanical properties of 7781/E-795
E-glass/epoxy
compositelaminates. Moisture is an environmental factor which is most
likely
to vary. Asfor physical
damage,
nicking and stressing are constantlybeing
encountered.When comparing materials, tensile strength is the most commonly referenced
mechanical property. Due to the relevance of the previously mentioned
environments and properties, the effects of moisture, nicking, and stressing on
the tensile strength of a composite material were chosen to be investigated.
When a composite laminate becomes immersed in a fluid environment,
the fluid tends to permeate into the system. The extent to which this ingress of
fluid effects the properties of the composite system depends on the specific
environment, amount absorbed, and laminate type. These three elements
determine the magnitude and speed of the reaction between the environment
and laminate. In order for the fluid to penetrate into the
laminate,
a pathwaymust be available. This path allows the environment a means to travel through
the matrix and reach the fibers. Once the fibers have been reached, the
environment can attackthese reinforcements which may lead to a degradation in
the properties of the laminate. There is also a deterioration of the fiber/matrix
interface which leads to degradation of laminate properties [3].
Any
mechanismwhich promotes the ingress of moisture can have a detrimental effect on the
where moisture is able to penetrate the matrix more rapidly.
Any
processingdefect may accelerate the penetration of moisture and in turn result in a
deterioration ofthe mechanical properties.
The amount of information available, on how material damage prior to
environmental exposure effects mechanical properties, is very limited.
During
the manufacturing and
building
stages, composite components may becomenicked or stressed due to an applied load. An evaluation of the effects of
damage prior to usage can reduce the problem of premature failures. This
investigation focuses on the physical damage of nicking and pre-stressing which
can
frequently
occurduring
assembly when materials are dropped or deformed.It is proposed that a nick may provide a direct path for the environment to
migrate into the matrix and reach the
fibers,
resulting in a deterioration of theproperties of the material. Another means
by
which the environment can reachthe fibers is through microcracks in the matrix. As the laminate is stressed, the
matrix deforms and microscopic cracks
develop
throughout.Depending
on theamount ofstress,
debonding
may also occur between the fibers and matrix. It isbelieved that these defects also allow a means for the environment to get to the
fibers and degrade the mechanical properties of the laminate. The focus ofthis
research is to explore and quantifythe effects which these damages have on the
A major consideration in this type of research is how to obtain the
maximum amount of useful knowledge in an efficient manner. In this case,
efficiency is defined as gaining reliable information with the least amount of
resources. To accomplish this
task,
one needs to utilize a repeatable and wellstructured technique. One such method is Taguchi Techniques. This method
employs the concept of orthogonal arrays. It relies on using balanced test
matrices where more than one factor can be tested at a time.
By
weightingfactors equally, multiple factors are tested simultaneously resulting in the desired
increased efficiency. The orthogonal array and Taguchi Technique was
2.0 LITERATURE
REVIEW
The ways in which environments effect composite laminates is a major
concern for the design and development of these materials. The conditions
encountered
during
actual application must be addressed and explored prior tothe release of a final product. Standard tests can be adapted in order to
simulate the various environmental conditions. This type of test is widely used
throughout the design of aircraft and marine structures. Research efforts have
also focused on the effects that environments have on laminate properties. This
literature search presents the major discoveries related to the different
categories within environmental
testing
of composite materials. Findings arereported according to these specific categories. An emphasis was placed on the
area of tensile testing. It is from this review of previous environmental
testing
that the specific criterion for this thesiswere determined.
2.1 ENVIRONMENTAL
EFFECTS ON PROPERTIES
Prior research of composite materials indicate that environmental
conditions influence their properties greatly. Moisture generally tends to have an
adverse effect on the material properties.
Testing
performed in the area of thickcomposite structures has shown that the uptake of moisture of fiber reinforced
It has also been determined that this phenomenon is more pronounced at
elevated
temperatures
in which case the moduli and strengths are furtherreduced.
Studies
were also done in an attempt to correlate accelerated agingwith natural aging in the standard environment of 26C and 84% relative
humidity. The research determined the number of days for which accelerated
aging is representative of real time aging to within a 13 percent error. This was
done for both material stiffness and strength.
Examination was also done on how the mechanical properties ofgraphite
reinforced thermoset and thermoplastic resins are effected
by
immersion inseawater[4]. Transverse
tensile,
creep, and fatigue properties were studiedbefore and after exposure to moisture at ambient temperature. The specimens
were nicked along the gage length to control fracture and then exposed for 1
week to 3 months. It was found that the tensile strength decreased
by
17% inone of the systems tested. It is believed that this reduction is a result of the
degradation ofthe interfacial strength.
The
long
term behavior of glassfiber reinforced plastics exposed to water,dilute sulfuric acid, dilute sodium
hydroxide,
ethanol, perchforethylene, andmineral oil has also been studied [6]. Samples included chopped strand mat,
woven roving, and multifilament roving in polyester resins. Failure was chosen
environment after prolonged immersion in the environment had little variation of
results from the tests carried out without prolonged immersion.
An investigation was done
focusing
on the effect corrosive environmentshave on the tensile failure times of E-glass fibers [8]. Sulfuric acid,
orthophosphoric acid, sodium
bisulphate,
hydroflouric acid, and sodiumhydroxide environments were used to compare the corrosion of 0/90/0 epoxy
laminates with that of the fibers alone. Research determined that the rate at
which single fibers failed had very little correlation to the rate at which the
laminates developed damage. Orthophosphoric acid and sodium hydroxide
corroded the unstressed laminates rapidly while
having
a minimal effect on theindividual fibers. On the other
hand,
hydroflouric acid caused little damage tothe laminates and corroded the singlefibers at avery high rate.
Another study was performed in order to ascertain how different
environments change the mechanical properties of glass reinforced polyester
and vinylester composites [9]. The laminates were exposed to saturated salt
water, No. 2 diesel
fuel,
lubricating
oil, anti-freeze, and indolene at two differenttemperatures. Six months were spent examining the varying effects on weight,
tensile strength, tensile modulus, shear strength, and shear modulus. It was
concluded that the saltwater, anti-freeze, and indolene atthe highertemperature
had the greatest impact on the mechanical properties. Comparisons also led to
greatest decrease in tensile strength.
However,
a distinct relationship betweenweight gain and the reduction of tensile strength was not obtained. It has also
been found that
drying
the material after environmental exposure does notrestore the laminate to its original strength.
Some general conclusions were made concerning factors affecting the
strength and performance oflaminates under various conditions [14].
1. In inert environments or at low
temperatures,
where reaction rate ofcorrosion processes should be negligibly slow, the
breaking
strengths ofmaterials become independent of the speed at which the load is applied
and always reach a relatively high value.
2.
Equivalents
high strengths are observed if theloading
rate is rapidwith respectto the reaction rate.
3.
Exposing
these materials to reactive environmentsbefore,
but notduring
atest,
generally has little effect on test results, suggesting that thecorrosion rate is accelerated
by
the applied stress.4. Exposure of these materials to reactive environments
during
a testleads to delayed rupture at strengths substantially reduced with respect to
(1)and(3).
5. There is a continuous influence oftemperature on the relationship
between the time of
loading
and the failure stress. In general, aAnother study revealed that a water boil generally reduces the glass
transition temperature
(Tg)
of composite laminates [24].However,
it was foundthat
depending
on the processing curetemperature,
a short duration of exposureto the
boiling
environmentcan cause post curing ofthe resin. This effect actuallyincreases the
Tg
of the laminate. This phenomenon occurs only in the earlyexposure stages, and eventually, the
Tg
begins to decrease. It was alsosuggested that the increased water temperature may mask the effects of
2.2
STRESS
CORROSION
FAILURE
METHODS
An
investigation
was done on the effects that hybrid fibers have on thecorrosion resistance of laminates [1 ].
Glass/Epoxy
andCarbon/Epoxy
unidirectional laminates were used for comparison with the
Carbon/Glass/Epoxy
hybrid. The specimens were subject to a tensile stress until rupture, while
being
immersed in either water, humid air, or 0.5M sulfuric acid. Carbon fiber
placement had no effect on the time to failure when the cut edges were
directly
exposed to the environment. When the cut edges were protected, the location of
the carbon fibers did influence the failure time. This implies that open edges
serve as the major passage for fluid permeation. If
they
are left exposed, theireffects overwhelm any reduction of ingress through the faces
by
carbon fibers.However,
the carbon fiber is resistant to water and dilute acid attack, and whenedge effects are minimized, it acts as an external cladding which tends to
increase the failure time. The other
theory
behind the enhanced performance isthat,
by
adding a second reinforcingfiber,
the first (morebrittle)
glass fiber canwithstand a higherstrain.
In studying glass fiber reinforced polymers
(GFRP),
it was confirmed thatacid attack on glass fibers occurs only after the acid diffuses through the matrix
[2]. Under a no load condition; diffusion does not occur or it is too slow to be
detected. Acid permeation must occurthrough damage existing as small cracks,
resistance to stress corrosion can be determined
by
matrix toughness. Afterexamining
cloth GFRP under stress, it was found to demonstrate an initialcracking
along the transversefibers,
which then propagates to the loadbearing
fibers parallel to the tensile direction.
It was discovered that moisture induced degradation oftransverse tensile
strength is due to degradation of interfacial strength [4]. A proposal was made
that the fracture process switches from one
involving
matrix cracking to onewhich is predominately at the interface. The first
theory
isthat,
moistureattracted to the fiber/matrix interface replaces or weakens chemical
bonding,
thus reducing transverse tensile strength. The second
theory
is that afterprocessing, residual thermal stresses form at the interface upon cure cycle
cooling due to a greater thermal contraction in the resin. As the laminate is
exposed to moisture, the resin begins to swell relieving residual stresses and
reducing transverse tensile strength.
Studies have been performed which examine the fracture surfaces of
unidirectional
Glass/Carbon/Epoxy
laminates after environmental stress crackingin dilute sulfuric acid [5]. It was found that the acid does not diffuse through the
uncracked matrix, and
they
suggested that it must travel through microcracks.The carbon failed to stop the acid from migrating further into the laminate and
attacking the inner glass fibers. The sulphate anions did not diffuse through the
hybrid laminates. This diffusion is not consistent with the
theory
of confined acidattack used
by
Hull andHogg [22]
to explain planar fracture surfaces found inenvironmental stress corrosion of glass laminates. Cracks
traveling
throughglass plies towards carbon plies became blunted and were diverted to travel
parallel with the carbon fiber without debonding. The conclusion is that there is
little or no migration of sulphate ions through the resin due to activated diffusion.
The diffusion of sulphate and sulfuric acid does however occur through
microcrack formation. It is hypothesized that acid bridges the carbon plies
by
means of transverse microcracking as a result of an applied load and pre
existing stress. These stress concentrations in the
boundary
region betweenglass and carbon plies are thought to be minute longitudinal cracks formed
during
cure.A two stage mechanism has been proposed to explain environmental
stress failure [6]. The first stage is an initiation stage where resin cracking
occurs and fibers bridge the crack. The second stage is the actual corrosion
stage where the environment enters the resin crack and attacks the fibers. Here
the acid reduces the fiber strength and increases the stress concentration
intensity
of the crack damage region. It is believed that the initiation stage is afunction of the applied stress and its duration will depend on the rate of
environmental ingress and attack.
Some theories in the area of corrosion resulted after investigation into
exposed to a tensile load while exposed to a 0.5M hydrochloric acid solution.
Previous
to the study, itwas believed that a chemical resistant matrix would slowthe corrosion rate.
However,
these chemical resistant resins tended to have alow
fracture
toughness. Aftertesting,
it was found that these resins in fact hadan increased failure rate. Calcium sulphate crystals were found at fracture
surfaces
leading
to the conclusion that acid had penetrated the chemicalresistant matrix somehow. The low toughness had allowed the matrixto fracture
more readily, exposing the adjacent fiber to the environment. It was concluded
that there appears to be no evidence of change in the stress corrosion rate, and
the chemical resistant matrix has a contradictory effect due to its low toughness.
The role of the resin matrix was also examined in the stress corrosion of
glass reinforced plastics [11]. Previous data on crack growth rate and stress
intensity
was re-examined and an estimation was done to predict the stress atthe crack tip. The model assumed resin yielding at the crack
tip
and led to thediscovery
that the crack growth rate is related to the applied stress. Thisinformation was recorded for chemical resistant, general purpose, and
toughened resins. These studies resulted in the conclusion that tougher resins
provide improved resistance to stress corrosion cracking. The concept
supporting this conclusion is that the toughened resin acts to modifythe stresses
acting on the fibers atthe cracktip.
Further studies also verified the
importance
of matrix toughness in stresscorrosion cracking [12]. Glass fiber polyester composites were exposed to a
0.6M hydrochloric acid and examined using
fractography
and fracture mechanicstesting. It again was found that the velocity of stress corrosion cracking was
directly
dependent on the matrixtoughness.Several materials have been tested in a water environment with varying
temperatures and pressures [13].
Modeling
of the infiltration of water throughcracks and pinholes has been performed using Poiseuille Flow. The equation is
given by:
V ttPt4
t
8Lr]
where V/t is the rate of
flow,
P is pressure, r is radius ofcapillary, L islength,
andr| is the viscosity ofthe liquid. This infiltration correlated to degradation vs. time
of exposure curves which are characterized
by
rapiddegradation,
followedby
areduced degradation rate, and
finally
show a leveling-off of the curve. Theconclusion was made that no further degradation occurs after the
teveling
point.The early effects of moisture absorption can be reversed
by
drying
the material,but as fibers become degraded the damage is irreversible upon drying.
Testing
showed that elevated pressure does not have any greater effect on material
that an
increase
in temperature did accelerate the effects of the environment.This
discovery
can be used to perform accelerated tests which can predict theperformance of materials immersed at ambient conditions for extended times.
After investigation into this form of
degradation,
a conclusion was made whichequates a "two hour boil" to one month's exposure at room temperature. This
accelerated
testing
is now a commonlaboratory
technique,
and it is included inmany specifications.
Caution must be taken in understanding the degradation mechanisms
involved in the laminates. As
testing
temperatures change relative to thematerial's melting
temperature,
the degradation mechanism may also vary. Adeformation diagram could be consulted as a precaution.
2.3
INTERLAMINAR
CRACK GROWTH
A method for
testing
interlaminar crack growth has been developed inorder to provide greater knowledge about fiber matrix
debonding
[16]. The method was formed around a compliant load-frame device. One leaf of thelaminate is rigidly attached to the
frame,
while the other is connected in serieswith a
loading
bolt. This fixture was designed specifically to be able to test double-cantilever beam specimens(DCB)
in order to better understand theories for stress corrosion cracking (SCC). The test device was also designed toperform in-situ tests which will enhance the statistical reliability of long-term
environmental data. Initial
testing
confirmed that no SCC threshold becameobservable
forfiberglass/epoxy
laminates in distilled water.Further
testing
was carried out in the area of interlaminar fracture usingthis same device [17]. The graphite/epoxy sample immersed in seawater was
subjected to static and fatigue
loading
conditions. This investigation revealedthat a fiber
bridging
occurs at the cracktip
which increases the fractureresistance. Fiber
bridging
can be defined as reinforcing fibers spanning thedeveloping
cracktip
as the laminate halves are pulled apart. The crack growthrate in seawater dropped to a level five times lower than thatexposed to air. Itis proposed that the environment weakens the fiber/matrix
bond,
which increasesincreases the fracture resistance. The wicking of moisture along the fiber/matrix
interface aids in weakening fiber/matrix bonds which then increases the
bridging
effect.
2.4
MOISTURE ABSORPTION
A study was performed which later characterized moisture absorption in
graphite/epoxy laminates
[7]. The uni-directional GR/EP prepreg was exposedhydrothermally
at various temperatures for 9000+ hours. The absorbed waterwas discovered in various measures ofthe
following
three forms:1)
residing atcrack
tips,
interfaces,
and voids,2)
associated with weak hydrogen bonds in theresin,
3)
strongly bonded to hydrophilic groups in the resin. Two approaches forcharacterization were
developed,
the free volume approach and the interactionapproach. The first mechanism proposes that the water diffuses into the
microvoids, internodal voids, and morphological defects with no chemical
interaction. The second suggests that the water forms a strong bond with
hydrophilic groups such as hydroxyl and amine.
Combining
the two theoriesleads to the assumption that some ofthe water molecules link to the hydrophilic
groups while the others remain in the free volume of the epoxy resin. If the
temperature was large compared to the glass transition
temperature,
cracks,voids, and surface peeling occurred causing weight variation to be related to
cracking as well as mass loss.
The guidelinesfor this specificresearch effort were developed after
reviewing the previous
testing
in the area ofcomposite materials. There is notmuch information pertaining to the effects that physical damage has on
to be focused onlyon insitu type conditions. No substantial exploration has been
done in
developing
a method ofpredicting material performance under varyingenvironmental conditions. Due to a lack ofinformation in these areas, itwas
chosen that physical damage will be studied and a predictive model will be
developed. These testswere also chosen to be performed after exposure to the
environment.
3.0 BACKGROUND
3.1 ROBUST DESIGN
The experimental procedure for researching and
testing
of any subjectarea is very critical.
Theory
and reasoning must be employed in order tojustify
test methods and maximize the experimental efficiency. It is desirable to gain
the most knowledge using the least amount of resources.
However,
enoughtests must be performed in order to gain confidence in the results. For these
reasons, much time was spent up front to determine the best experimental
techniques for this research.
Originally,
it was proposed that standard design of experiments be usedas the only research tool. The goal for the initial test phase was to be able to
compare the relative effects that moisture, nicking, and pre-stressing have on the
tensile strength of the composite specimen. A proven technique and tool was
necessary to reveal useful results with sufficient confidence. Typical designed
experiments use the one-factor-at-a-time approach. This involves studying and
characterizing a single factor completely, and when this is complete, the next
factor can be studied and so on. This is most often used to
develop
models andto understand a single parameter completely. The drawback is that
interactions
can only be accounted for after all of the individual factors have been studied.
carefully examined. This technique requires large amounts of time to obtain
useful results. Another option considered was the full factorial experiment. The
problem with this method is that numerous experiments must be performed to
fully
understand the effects of each factor. This introduces redundanttesting
and would require the fracture of many specimens. The overall goal was to
obtain relative effects of each damage type. This could best be accomplished
through the use of Taguchi Methods and orthogonal array experiments. An
orthogonal array experiment needs only a fraction of the previously mentioned
full factorial experiment. This is possible through the use of analysis of means
and
by
adjusting the combinations of factors where no single factor is weightedmore than another.
Applying
Taguchi techniques allowstesting
forinteractions,
integration of the ASTM D638
[19]
procedures, and using the fewest number ofspecimens. These reasons were thejustification for using Taguchi techniques in
the firststage of experimentation and analysis.
The first step in setting up the experiment is creating a noise diagram [23].
This consists of all ofthe inputs and outputs to a given system. The diagram for
a general case can be seen in Figure 3.1.
Unit-to-Unit Noise
External
Noise
Output
Response
Variable
Deterioration
[image:31.612.140.480.82.274.2]Noise
Figure 3.1: General Noise Diagram
The first component ofthe noise diagram to define is the output response
variable. The output response is most often the physical factor of greatest
importance to the
functionality
of the system. This item must be able to bemeasured quantitatively so that the magnitude of its response can be
determined. The response will change according to variations in the noise
factors. It is the changes in this response which will eventually be correlated to
the variations in the noise levels. In this experiment, the response of major
concern is the tensile strength ofthe composite specimen.
The second component which needs to be defined fs the external noise.
External noises are those which the operator will inflict on the system in orderto
simulate a variation that a product mayencounter in its operational environment.
factors
being
studied. It is these factors which are varied to produce a change inthe output response of the system. The effects of these factors are based on
physics and commonly involve an energy transformation. The variations are
referred to as levels and are generally limited to two distinct values or physical
set points. As the levels ofthe external noises are altered, the output response
will adjust accordingly based on physical principles. These adjustments and
noise levels are then compiled so that the effect each noise factor has on the
output response can be determined. The external noise factors for this study
were chosen to be
boiling
distilled water, a 1.00"long
by
0.001"deep
nick, and a75% pre-stress. The noise levels are assigned a high or low level. For the
distilled water, the specimen will either be exposed to a boil for six hours or zero
hours. For the nicking, the specimen will either be nicked 1.00" x
0.001"
or not
nicked. For the pre-stressing, the specimen will either be pre-stressed to 75% of
the maximum tensile stress or 0% ofthe maximum tensile stress.
The third component to be defined is the unit-to-unit noise. Unit-to-unit
noise is the difference thatexists between each system. No two products can be
fabricated
identically
and this noise is in many cases due toprocessing
techniques and material differences. These differences are in most cases
inherent in the system, and
they
cannot be eliminated, only minimized. Itis,
however,
possible to make a processing method or characteristic a variablecontrol factor and test the effectthat it has on the product performance. For this
specific study, the system was fixed and the processing methods could not be
varied. As a result, these variations would be embedded in the experimental
error. Some of the unit-to-unit noises that may exist among the composite
laminates will be discussed. Thefiber orientation could vary due to misalignment
and tolerances throughout the specimen cutting process. The void content and
volume fractions of the specimens may vary
depending
upon the processingtimes,
temperatures,
and pressures. The surface finishes may not be identicaldue to material processing variations. Another factor that varies from part to part
are the dimensions. The Type I tensile specimen dimensions were not identical
due to the precision ofthe router
jig
used to produce them. These factors couldnot be controlled in this particular experiment, and as a result any effects oftheir
variation leads to inaccuracies in the results. The significance of the unit-to-unit
noise can be evaluated when deviations in values are compared relative to the
effects of external noise imposed on the system. If the unit-to-unit noise
overwhelms the external noises, changes in the system performance is not
necessarily attributable to the external noise. In this case, tighter control would
need to be retained over the unit-to-unit variations. A judgment must be made
as to the relative effects of the various noises in order to gain confidence in the
experimental results.
The final component which needs to be defined is the
deterioration
noise.of a system could change solely due to time exposure
following
production ofthesystem. Examples for composite laminates are phenomena such as
drying,
corrosion, and outgassing ofthe material.
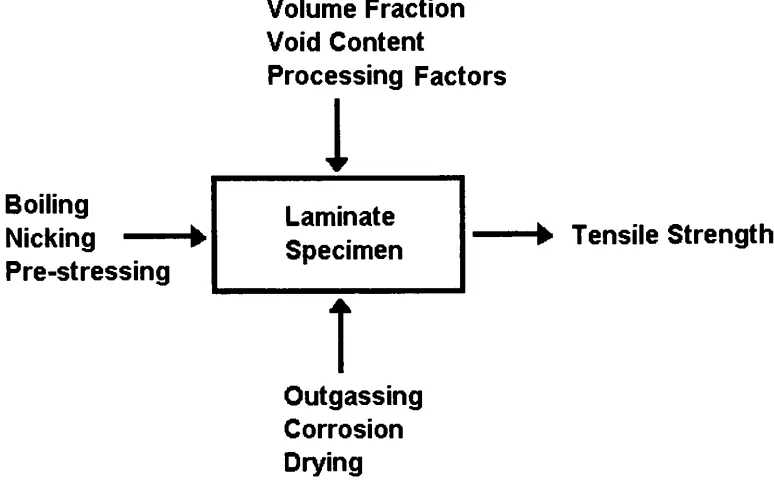
The noise diagram forthis specific investigation can be seen in Figure 3.2.
Volume Fraction
Void Content
Processing
Factorsi
Boiling
Nicking
Pre-stressing
Laminate
Specimen Tensile Strength
i
Outgassing
Corrosion
[image:34.612.111.498.202.447.2]Drying
Figure 3.2: Composite Laminate Noise Diagram
The second step in setting up the noise experiment is choosing which
orthogonal array to use. The orthogonal array is a test matrix which is tailored
specifically to the number ofnoises
being
tested and the number of noise levels.The array is balanced so each noise factor has an equal opportunity to express
its effect on the response. There are three noise factors
being
tested in thistest,
and each noise has two levels. After viewing the available arrays, it was
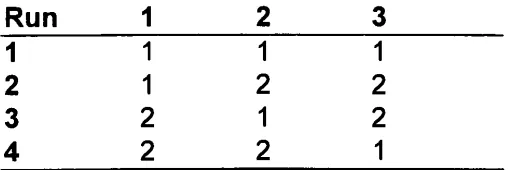
determined that a standard L4 array is needed forthis case.
A general outline of a standard L4 array can be seen in Figure 3.3. The
upper horizontal axis
(1,2,3)
corresponds to the three noises. The vertical axiscorresponds to the number of runs. The center region of the array specifies
which levels the noises are at for each run. Level 1 is the low value, and level 2
is the high value. Notice each noise is weighted equally throughout the array.
For example, noise2 is at level 1 for run
1,
level 2 for run2,
level 1 for run3T
andlevel 2 for run 4. The first run would go as
follows,
the system would besubjected to noise 1 at level
1,
noise 2 at level1,
and noise 3 at level 1 all in thesame test. In the second run, the system would be subjected to noise 1 at level
1,
noise 2 at level2,
and noise 3 at level2,
again, all at the same time. Thistechnique allows the
testing
of multiple noise levels within a single run.Run
1 1 1 1
2
1 22
3
2 12
[image:35.612.171.425.501.586.2]4 2 2 1
As with any
testing,
repeatability and verification are necessary. This isaccomplished
by
making use of the ASTM D638[19]
requirements which statethat for each test case, five samples should be taken. Taguchi Methods refer to
the multiple test specimens for each run as replicates. This means that run 1
would be performed on five separate specimens, run 2 would be performed on
five separate specimens, and so on.
Hence,
this L4 test required the use oftwenty
total specimens (four runs xfive specimens per run).Once the test setup and procedure have been
defined,
the actualtesting
can be performed. Extreme care must be taken throughout the experimental
process in order to attain
highly
repeatable results. When all the tests havebeen performed and the data has been recorded, the post-processing can begin.
The data should first be tabulated such that the replicate values for the
characteristic response are grouped according to their specific run within the L4
array. At this point, the experimental results can be determined through manual
techniques or a computer program. Information pertaining to the necessary
equations and derivations can be obtained in the reference literature [23].
Numerical results as well as graphical output can be acquired upon manipulating
the data. Examination will reveal the effect that each noise has on the
characteristic response.
When the calculations are completed, each run will have a mean
characteristic response associated with
it,
and the entire test matrix will alsohave an average characteristic response. The most useful result is the factor
effects plot. This provides a visual
display
of the relative effects that each noisefactor has on the characteristic response. This is done
by
plotting thecharacteristic response value versus the noise line for each factor. For the two
level case, the line is determined
by
the two end points. The left most end pointis the mean response value resulting from the low level noise setting, and the
right most point is the mean response value resulting from the high level noise
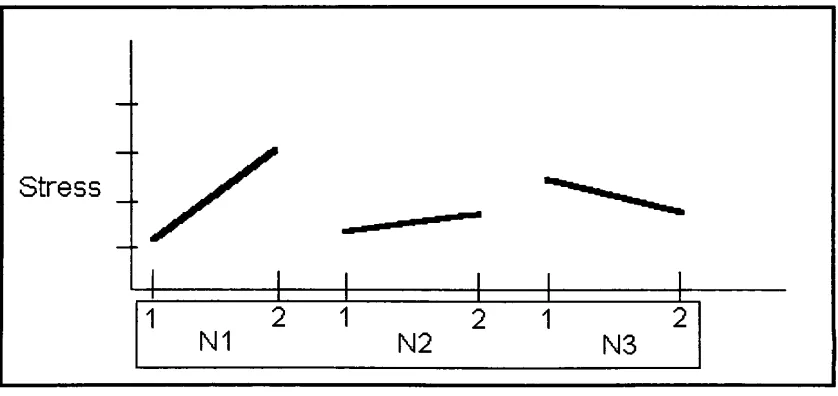
setting. A general factor effects plotcan be seen in Figure 3.4.
Stress
1
II
II
1
i ii ii i
1 2 1 2 1 2
[image:37.612.99.518.353.551.2]N1 N2 N3
Figure 3.4: General FactorEffects Plot
The influence each noise factor has on the response characteristic can be
determined
by
the slope of its respective line. The direction of the slopeon the response value. A positive slope means
that,
as the noise goes from thelow level to the high
level,
the value ofthe response increases. A negative slopeimplies exactlythe opposite response behavior. The gradientofthe slope is also
of great value to the observer. This demonstrates the sensitivity ofthe response
to the noise. An almost vertical slope implies that the noise has a large influence
on the response. If the slope approaches
horizontal,
the implication is that theresponse is insensitive to that particular noise. Horizontal gradients signify that
the system is robust, and the noise effects are not a concern regarding the
system performance. The more vertical gradients are of great
importance,
andsteps should be taken to make the system more robust in order to desensitize
the system to such noise factors.
An analysis technique for predicting the characteristic response value is
also available when using these methods. It allows the estimation of the
response value at any ofthe desired noise level settings. This tool can be used
to determine the maximum and minimum range that the system may operate at
given the particular noises.
Another useful tool is an analysis of variance table (ANOVA). This
provides the researcher with another way of comparing the relative effects that
various noises have on the system
being
studied. The most useful value in thetable is the F-factor. This value is a ratio between the variance of noise
factor
effects and the experimental variance due to random experimental error and
unrepresented interactions [23]. The ratio is comprised of the mean square
value of the noise factor over the mean square value of the experimental error.
Therefore,
the F-factor is larger when the effect of a noise is greater. This againis similar to the gradient found in the factor effects plot. The ANOVA table and
F-factors also give an idea of the experimental error and how significant the
noise effects are compared to this experimental error. In this particular
application, the F-factor was used in a non-rigorous statistical manner and was
3.2 ASTM TESTING
One of the problems encountered in environmental stress corrosion
cracking is
finding
a way to expose the specimen to the environment while thestress is
being
applied. Large environmental chambers are available in whichtemperature,
pressure and the environment can be varied, but these are noteasily adaptable to all machines. One
fairly
simple universal method has beenused for in-situ testing. This method utilizes box shaped cells which contain the
environment. These are then attached to the specimen. This allows the
environment to be controlled as desired [1]. The drawbackwith this procedure is
that the tensile machine may become in
jeopardy
of environmental exposureupon fracture of the specimen. Another method of comparison which is often
used is performing material property tests after environmental exposure.
Specimen
testing
has taken place as much as one hour after its removal fromthe environment [6].
Testing
should take place as soon after the specimen isextracted as possible.
However,
the most important factor for comparing valuesis to
keep
the time between removal andtesting
consistent.Three test methods are available for
determining
material properties in thearea of composites. These three procedures will be discussed in order to
explain their differences and why one would be chosen versus another. ASTM
D638
[19]
was preferred for this study, so an emphasis will be placed on thatsection. This method was mainly picked because of its widespread acceptance.
As discrepancies arise between two methods, the ASTM D638 results are
accepted overthe other two.
3.2.1
ASTMD638[19]
ASTM D638
[19]
is primarily used to determine tensile properties of plasticmaterials. The conditions of pretreatment can be defined according to the
application. Variations can be made in the area of
temperature,
humidity,
machine speed, etc.. This method is valid for a material thickness up to 0.55
inches. These tests may also be performed on materials such as phenolic
molded resins or laminated materials.
The specifics of the method are as follows. This method shall produce
material property data which can be used to aid in the specification of plastic
materials or qualify characteristics for research and development. Control of
experiments is very important throughout the
testing,
because the properties areextremely dependent upon preparation, speed, and environment. In order to
obtain data which will be useful for comparisons, the material preparation and
test conditions must be recorded. It is important to make sure that all the
specimens are prepared in the same way. If
testing
is used forengineering
design purposes, a broad range of load-time scales and various environments
The tensile
testing
machine must be capable ofdelivering
a constant rateof crosshead motion. The tensile machine shall also be equipped with load
indicator. This must be free of inertia
lag
and have an accuracy within 1% oftheindicated value. The total elastic longitudinal strain of the system must not be
greater than 1% of the strain within the gage length ofthe specimen. The final
piece of equipment is the extension indicator (extensometer). This device is
responsible for measuring the distance between two points within the gage
length of the tensile piece
during
stretching. It is very beneficial that thisextension is recorded as a function of the tensile load or test time. This too
should be free ofinertia
lag
and must be accurate within +/- 1% ofthe strain.Specimens should be fabricated to predetermined dimensions. These
specifications can be found in Figure 3.5.
#
0 638TYPES1 It>4 K
4 *<0
CiT"*"
\i
H-r* lO -rvpttv
-i
Specimen Omensions forThickness.T mmfm.)
Dimensions (seedrawings)
7(0.28)or under Over 7 to 14 (0 28 to 055)met 4(0.16)or under
Tolerances Typel Type II Type III TypelV TypeV
WWidthof narrowsection**-s 13
(0.50) 6 (025) 19(0.75) 6(0.25) 316(0.125) 0.5{tQ.QI!)-3''
{.Lengtho*narrowsection 57(2.25) 57(2.25) 57 (2.25) 33(130) 9.53(0.375) 0.5(0.02)'
>VOWidthoverall,mm* 19
(0.75) 19(0.75) 29(1.13) 19(0.75) +6 4(+0.25)
WO-Widthovor-al.mm* 9.53
(0.375) +3.18(+0.125)
LO Length over-al,rnin*
165 (65> 183(7.2) 246(9.7) 115(45) 63.5(2.5) no max(no max)
SGagetengthc 50(2
00) 50(2.00) 50(200) 762(0300) +0.25(0010)' GGagslength0
25(100) +0.13(0.005)
0 Distancebetweengrips 115(4.5) 135(5.3) 115(4.5) 65(2.5)" 25.4
(1.0) 5(0.2)
fl Radusoffltet 76 (300) 76(300) 78(3.00) 14(0.56) 12.7(0.5) 1(0.04)'
[image:43.612.60.530.64.392.2]RO Outerradius(TypeW) 25(1.00) 1(0.04)
Figure 3.5: D638 Tensile
Specimen Dimensions
[19]
A Type I specimen is the most common specimen and these dimensions shall be
used on materials with a thickness less than or equal to 0.28 inches. A Type II
specimen may be used if the Type I specimen will not break within the narrowed
section. The Type III specimen is to be used for materials which have a
thickness greaterthan 0.28 inches but less than 0.55 inches. The tensile pieces
should be formed
by
machining methods or die cutting from a sheet or plate.orientation, these specimens may have
differing
properties. The specimensshould be free ofvisible
flaws,
scratches, and imperfections.Conditions
fortesting
can varydepending
on the research applications.Standardized
testing
should be performed inlaboratory
conditions of 23 +/- 2C(73.4
+/-3.6F)
and 50 +/- 5% relative humidity. If results begin tovary the
tolerances should be adjusted to +/-1C
(1.8F)
and +/- 2% relative humidity.A minimum of five test specimens are necessary for each sample when
testing
isotropic materials. In the case of anisotropic materials, ten specimensare needed, five normal and five parallel to the principal axis. Tensile pieces
which do not break within the gage length due to a flaw in the material shall be
discarded.
The speed of the moveable head with respect to the stationary head is
specified in thetestfor a Type I specimen to be 0.2 in./min. to 20 in./min.. When
the speed is not
directly
specified, the lowest speed shown should be used. Forthis
testing
a speed of0.2 in./min. was selected.The first step in the tensile
testing
procedure is to measure the width andthickness of the specimens.
Next,
the piece should be aligned in the grips, sothe
long
axis is parallel to the load axis. The grips are then tightenedevenly
andfirmly
to the point that slipping does not occur and damage is not done to thematerial. At this point, the extension indicator can be attached to the specimen.
Now,
the speed should be adjusted, andloading
can begin. The load-extensionwill be recorded throughout the testcycle.
After performing the experiments and obtaining the results, various
calculations must be made. The tensile strength of the material is calculated
by
dividing
the maximum loadby
the minimum cross-sectional area of thespecimen. The units are in N/m2 (lb/in2). The result should be reported to three
significant digits and displayed as "Tensile Strength at Break". The modulus of
elasticity is calculated
by
extending the linear section ofthe load-extension curveand
dividing
any difference in stressby
the corresponding difference in strain.Elastic modulus values shall be determined using the initial cross-sectional area
of the tensile piece. The mean of the five pieces should also be calculated for
each sample lot. The standard deviation must also be determined.
All of the
following
information should be reported upon conclusion of thetesting:
1. Identification of materialtested
(type,
source, manufacturer code,form,
dimensions,
history...)
2. Specimen preparation method
3. Type oftestspecimen and dimensions
4.
Conditioning
performed5. Test room atmospheric conditions
7.
Testing
speed8. Tensile strength at yield, average, standard deviation
9. Tensile stress at
break,
average, standard deviation10. Percentelongation atyield or
break,
average, standard deviation1 1. Modulus ofelasticity, average, standard deviation
12. Test date
3.2.2 ASTM D3039
[20]
The specifications and procedures for this test method are very similar to
ASTM D638 [19]. For this reason, only the major changes and differences will
be presented.
This test is specifically used for examining the tensile properties of fiber
reinforced resins, either continuous or discontinuous. Fiber modulus values are
typically
largerthan 20Gpa (3Msi). Thefollowing
characteristics are suitable fortesting: continuous or discontinuous unidirectional fiber with 0 and 90
properties, orthotropic symmetric laminates with continuous or discontinuous
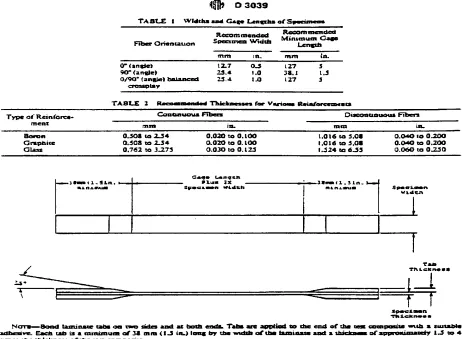
fibers. The geometry ofthe specimen can be found in Figure 3.6.
till}) D3039 TAflUE I Widthsu4G|t L*ft-chsof
Recommended Fiber Omnuuon Specimen Width
Mintmum G-Lenath in. 0-an*e W(an-ale) 0/90* r angle* croscplsy 12.7 23-1 0X3 1.0 1 o 127 3S.1 127 5 1.3 3
TABLE 2 Rmmh Thirfciw-n-ra for vpmiRarin/e
Goncuiuoua Fibe-m _,,. Typeof
Rnorc-rneni
mm in. mm in.
Boron Crapnite Class
0.3O3to2-34 0. 5OSto2.3* 0.762to3.275
0.02OTO 0.100 002OtoO. LOO 0.03OIO G.L 23
1.016co3.0S 1.016to-3.0" 1.324 CO 6J5
0.CMO lO 0.200 0.O*Oto0.20O O.OoOtoQJZ3Q
ImU.Un. .J *am < 1.Sin.
Tan
ThleMMM
n
uma the tbieknen-i
-Ttildcnw** laminatecabs oo two sides and axbothendavTabsareappliedtotheend ofthe teatcomposte-witha suitable catstsa mtnimaa of3*mm( l-Jin.)lone;bythn-mditiofthetunioaicand a thackneaa of apnroiutnatrry i_5 to 4
of the ten com pome.
Figure 3.6: D3039 Tensile Specimen Dimensions
[20]
The test piece has a constant cross-section with tabs adhered to the ends. The
previous table shows the gage lengths and widths for each fiber orientation. A
one inch wide specimen is recommended when
testing
is performed with fibers90
to the
loading
direction.By
having
the greater width, the edge effects arereduced and the more accurate representation of the bulk of the
lay-up
isobtained. For discontinuous fiber
testing,
the gage length is to be at least two [image:47.612.74.536.78.417.2]This too gives a more accurate representation of the bulk material. The
specimen must not vary greater than 2% in thickness. Thickness is varied in
order to promote material failure between the end tabs and also assure a
reasonable amount of fibers are within a cross-section to represent the bulk
composite. Again specimens may be molded or cut from sheets, but care must
be taken to minimize notches and surface defects. The Specimens should be
cut slightly oversized and ground or milled with water flow to the exact
dimensions. Tabs are generally 0/90 cross-ply pieces obtained form
unidirectional E-glass. The tab strain shall be relatively close to that of the
material
being
tested. Tabs should be a minimum of 38mm(1.5in.)
long by
thewidth of the specimen. Tab thickness can range between 1.5 to 4 times that of
the test specimen. High elongation adhesive should be used to fix the tabs to
the specimen.
The
following
are the calculations needed for the important results whichareto be presented atthe conclusion ofthe testing.
Tensile strength: S = P/bd
S = ultimate tensile strength (Mpa or psi)
P = maximum load (N or
Ibf)
b = width (mm or
in)
d = thickness (mm or
in)
Elastic modulus: E =
(AP/AI)(l/bd)
E = modulus of
elasticity (Mpa or psi)
AP/Al = slope of linear portion ofload-deflection
curve
I = gage length (mm or
in)
b = width (mm or
in)
d = thickness (mm or
in)
Poisson's ratio: \i=
-Asx/As,
(i = Poisson's ratio
Asx/As1
= slope of linear portion of stress-strain curven
Average Value: X=(Z*,-)/ n
Standard Deviation: s =
MILxf
)/(n-\)
/=i
CoefficientofVariation: cv =
100s
/
XXj
= test valuen = sample number
The report should contain all the same information as for the D638
[19]
report with a few additions. The material identification must also include resin
content, void content, and filament count. The method of fabrication and
3.2.3 ASTM D5083
[21]
The specifications and procedures for this test method are very similar to
ASTM D638
[19]
and ASTM D3039 [20]. For this reason, only the majorchanges and differenceswill be presented.
This particular method is used in
determining
the tensile properties ofthermosetting
reinforced plastics with a constant width. The method may beused with materials up to a 14mm
(0.55in.)
thickness. The results of this testprocedure are very subject to variation. Large differences can exist between the
cross-head rate of motion and the strain rate within the gage length of the
specimen. As the speed of
testing
changes, material properties also differ.Significant effects in the plastic state may go unnoticed due to the testspeed.
This test is primarily used in quality
testing
applications and as ascreening test for laminated composites. If the results of this test differ from
D638 or
D3039,
the latter two will govern. Extreme care must be taken to assurethat the specimens are prepared
by
the same method as properties can varygreatly
depending
on preparation techniques. Information obtained fromtesting
is not valid for all applications.
Straining
rates and environmental conditionshave different effects on the performance of materials.
Therefore,
in order togain confidence in a material's usefulness, it must be tested over a great range
ofstrain rates and environmental conditions.
Specimens
forthis test are of a constantwidth.They
can also be cut froma sheet or plate or be made individually. The typical dimensions of the test
pieces are 25.4 x 3.175 x 215.9mm (1 x 0.125 x 8.5in.).
Machining
the thicknessof the laminate can vary the material properties greatly. Injection molded
specimens may also have different properties due to the orientation induced
during
the injection process.The standard speed for this particular test is 5mm/min (0.2in./min). This is
to be used for most applications. A different speed may be used as necessary
depending
on the test type and goals.Afterexamining the three methodsfor composite material
testing,
ASTMD638 was chosen. This method uses the standard Type I tensile specimens
which require no adhesive tabs so no furtherpreparation is necessary. The
material specifications which suppliers publish are acquired using this
testing
technique,
and the comparisons are done using this data from this test. Thismethod was also preferred because its results are accepted overthe othertwo if
4.0
SPECIMEN
PREPARATION
4.1
MATERIALS
Bi-directional
E-glass/Epoxy
laminates were manufactured at FiberCoteIndustries
Inc.,
inWaterbury
Connecticutby
stacking sheets of prepreg (37-44%resin content) to form 12 ply (0.125
in.)
sheets. The system is E-795 (350Fcuring epoxy) on 7781 glassfabric with a S550 finish.
4.2
PROCESSING
The system was processed using an autoclave. A 24
in.Hg
vacuum and50 psi pressure were applied initially. The vacuum was vented when the
autoclave pressure reached 15 psi. Atthis point, the temperature was increased
from room temperature to 350 +/- 10F at a rate of 3 to 5F per minute. This
temperature was held for 90 minutes. The temperature was then allowed to cool
below 150F priorto releasing the pressure.
The sheets were machined into parallel strip specimens using a diamond
wheel. The approximate dimensions were 8 in.
long
x 0.75 in. wide x 0.125 in.thick. The rectangular strips were then machined to ASTM Type I tensile
specimen dimensions
[19]
through the use of a Skil table style router and anASTM Type I tensile specimen template. The routed edges were then sanded
with 600 grit silicon carbide paper.
The
previously
described material compositions and processing5.0
GENERAL TESTING
PROCEDURES
5.1
IDENTIFICATION
Each specimen was identified with a permanent marker prior to any test
preparation. The identification consisted of a letter to
identify
the test type(sample)
and a number(1-5)
to indicate the specific specimen within thatparticular run.
5.2 MEASUREMENTS
Initial measurements of the specimen dimensions and mass were
recorded before any preparation or testing. The specimen thickness and width
were taken within the gage area of the tensile piece. The values used in
calculations were composed from the average of three readings for each
dimension. The mass readings were done using a Metier AE163 balance.
These were also measured three
times,
and the average was again computed.The tensile strength of the specimens was measured using an Instron model
1125 test apparatus. The machine was equipped with an MTS Sintech ReNew
upgrade package, one inch gage length extensometer, and 10
kip
load cell. Thesoftware used to control this device was MTS TestWorks Version 3.0
(Advanced
Software for Material Testing). All of these components satisfied the
requirements of the ASTM D638 standards [19]. All data was acquired with the
crosshead speed set at the minimum value of 0.2
in./min.,
and the standard6.0 NOISE
EXPERIMENT
6.1 EXPERIMENTAL
6.1.1 PROCEDURES
ORTHOGONAL ARRAY
An initial noise experiment was done on the specimens to determine the
relative effects of three types of damage. The test setup of this experiment
followed that of a standard L4 array. The characteristic responsewas the tensile
stress at failure of the material. The three noise factors were nicking,
pre-stressing, and boiling. The levels ofthese noise factors were no nick/nicked, no
pre-stress/pre-stressed, and no boil/boiled respectively. The exact specifications
for each type ofdamage can be found in their corresponding procedure sections.
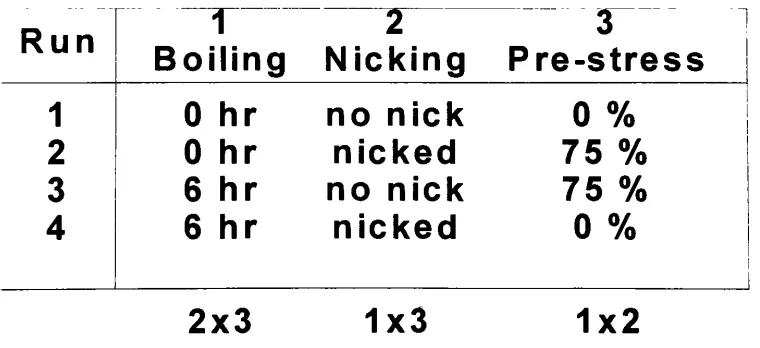
The general test array used for the experiment can befound in Figure 6.1
r
u1
2
3
Boiling
Nicking
Pre-stress
[image:56.612.120.500.459.633.2]1
2
3
4
0 hr
0 hr
6 hr
6 hr
no nick nicked no nick nicked2x3
1x3
0
%
75
%
75
%
0
%
1x2
Figure 6.1: Noise Experiment Test
Array
The
testing
procedure which was followed throughout this research was that ofthe ASTM D638 Standard Test Method for Tensile
Properties
of Plastics [19].This was chosen due to its
being
ack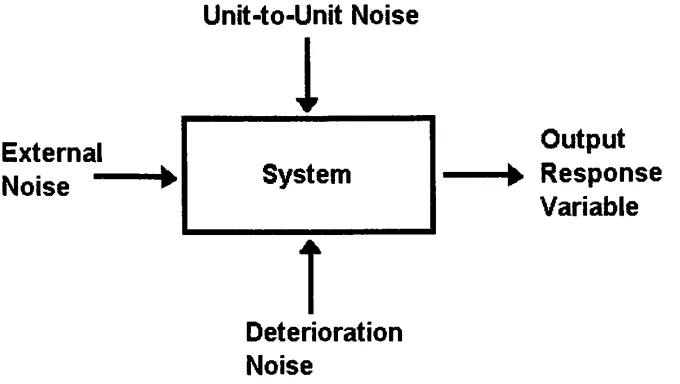
![Figure 3.5: D638 Tensile Specimen Dimensions [19]](https://thumb-us.123doks.com/thumbv2/123dok_us/59110.5498/43.612.60.530.64.392/figure-d-tensile-specimen-dimensions.webp)