ISSUE 2011/16
NOVEMBER 2011
ASSESSING
COMPETITIVENESS:
HOW FIRM-LEVEL
DATA CAN HELP
CARLO ALTOMONTE, GIORGIO BARBA NAVARETTI,
FILIPPO DI MAURO AND GIANMARCO OTTAVIANO*
Highlights
• As policymakers refocus on growth, the ability to take a firm-level view is key to disentangling the various factors at the root of competitiveness, and thus to designing appropriate policies.
• Firm-level data provides critical information for the design of appropriate competitiveness measures that complement traditional macro analysis.
• More work remains to be done assembling firm-level information, but the variance of the distribution of firm characteristics already conveys important information in addition to standard averages.
• New indicators should be developed to translate the distribution of firm characteristics into indicators of competitiveness designed to capture not only average performance but also the heterogeneity of firm performance.
This Policy Contribution builds on ongoing research within EFIGE(www.efige.org), a project to help identify the internal policies needed to improve the external competitiveness of the European Union. EFIGE has received funding from the European Community's Seventh Framework Programme under grant agreement n° 225551, and from Unicredit Group. The views expressed are the authors’ and do not necessarily reflect those of their institutions or the European Commission. The authors gratefully acknowledge comments from Matteo Bugamelli. * Carlo Altomonte: Bruegel and Bocconi University ([email protected]); Giorgio Barba Navaretti: University of Milan and Centro Studi Luca d’Agliano ([email protected]); Filippo Di Mauro: European Central Bank ([email protected]); Gianmarco Ottaviano: Bruegel and London School of Economics ([email protected]).
Telephone
+32 2 227 4210 [email protected]
ASSESSING COMPETITIVENESS:
HOW FIRM-LEVEL DATA CAN HELP
CARLO ALTOMONTE, GIORGIO BARBA NAVARETTI, FILIPPO DI MAURO AND GIANMARCO OTTAVIANO
1. For information about the EFIGE project (European Firms in a Global Econ-omy) see http://www.efige.org/.
THE DEBATEabout how to define, measure and assess ‘competitiveness’ has recently taken an unexpected turn, which is easily understandable, but rather unwarranted. The recent literature on trade1 has increasingly underlined and shown
empirically that aggregate industrial performance depends strongly on firm-level factors, such as size, organisation, technological capacity, and other conditions firms are confronted with in the specific environment in which they operate. How-ever, the policy debate in Europe increasingly focuses on macro factors, such as whole economy labour costs or current account dynamics, which are seen as the preponderant determinants of aggregate economic performance. Other factors, if any, are left to the domain of structural/non-price competitiveness matters, possibly to be tackled within the European Union's Europe 2020 reform agenda.
The prominent attention to macro factors relies squarely on the fact that – in the midst of a major fiscal crisis in the euro area – when referring to ‘competitiveness’, the emphasis is on macro and financial stability considerations. As a result, the indicators referred to most often are those that i) are easy to communicate, most notably unit labour cost differentials, and ii) are generally iden-tified as being responsible for macro imbalances, which are to be quickly corrected. Against this background, however, there is a risk that sustain-able growth considerations may be neglected or actually contradicted.
In this Policy Contribution we attempt to complement the (much debated) commonly used definition of ‘competitiveness’, mostly driven by considerations related to macro stability, with
‘When referring to competitiveness, the emphasis is on macro and financial stability
considerations. However, there is a risk that sustainable growth considerations may be
neglected or actually contradicted.’
considerations more strictly related to the idea of
sustainable growth. The two views are in fact often
complementary, for instance regarding competitiveness rankings across countries, but firm-level considerations turn out to be essential when actual policies are set in place to address competitiveness issues. To do so, we suggest a definition of competitiveness together with a number of firm-level indicators, which could usefully and systematically be added to the set of macro indicators commonly used. In advocating the broadening of the scope of the firm-level analysis – from the present almost exclusive purpose of producing research papers, to a more systematic use in formulating policy – we also attempt to support the case for better and more complete data collection.
1 CONCEPTUAL UNDERPINNINGS OF FIRM-LEVEL ANALYSIS AND ITS ROLE FOR POLICY MAKING
To begin with, we define competitiveness as the ability of firms in a given country – not of the country itself – to mobilise and efficiently employ (also beyond the country’s borders) the produc-tive resources required to offer goods and serv-ices. The factors affecting this ability range from the firm-specific (such as the sector of activity, size, technology and so on) to the macro/institu-tional (eg price/cost structure, investment envi-ronment and so on). In this sense, we agree with Paul Krugman’s idea of competitiveness being ‘a poetic way of saying productivity’ (Krugman, 1997).
for policy purposes to consider not only the aver-age outcomes (eg productivity), but also their dis-tribution around the mean. We devote the remainder of this Policy Contribution to this issue.
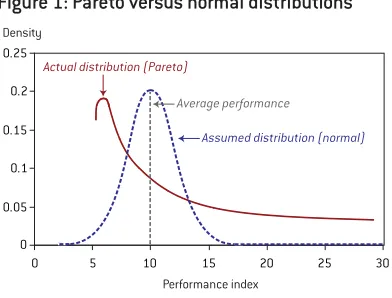
[image:3.595.261.457.117.266.2]Empirical evidence for both the United States (Bernard et al, 2011) and a number of EU coun-tries (Mayer and Ottaviano, 2007) has shown that in general firm-level data on a given performance index (eg productivity) is typically distributed as shown in Figure 1 (a distribution proxied by what is known as a ‘Pareto’ distribution) versus an assumed standard normal distribution. In Figure 1, both distributions are assumed to have the same average value of the performance index. The latter is not surprising, as this type of distribution is frequent in natural and social phenomena: the length of rivers in the world, or the size of cities, are roughly Pareto-distributed, with a large number of relatively short rivers (or small cities), and few very long rivers (or very large cities). The performance of firms is no exception. Rather than having many firms centered around an ‘average’ performance level, with few very bad or very good firms symmetrically distributed around the mean in equal numbers (as in normal distributions), in reality, within a given industry or country, there is a large heterogeneity of firms (larger than gener-ally assumed), with many relatively ‘bad’ firms performing below the mean, but also a certain number (although less numerous, and hence the asymmetry, or skewed nature, of the distribution) of particularly good firms, as depicted by the rel-atively long right-hand tail of the distribution (Figure 1).
The first policy implicationassociated with the above finding is linked to the accuracy with which we are able to measure competitiveness. In gen-eral, performance indicators (retrieved by statis-tical offices) starting from firm-level observations are derived as averagesover the available indi-vidual observations. Comparing the two distribu-tions in Figure 1, we immediately understand that the same averages in fact synthesise very differ-ent distributions in the characteristics of the underlying populations. Consequently an aggre-gate performance measure calculated at the mean is probably biased, thus delivering a distorted pic-ture of the real underlying competitive position of a given industry or country. This calls for using
0 0.05 0.1 0.15 0.2 0.25
0 5 10 15 20 25 30
Assumed distribution (normal) Actual distribution (Pareto)
Average performance
Density
Performance index
Figure 1: Pareto versus normal distributions
Source: Bruegel.
aggregation functions that correctly weight indi-vidual observations based on their actual repre-sentativeness in the sample when deriving aggregate statistics; or, at least, for using median
rather than average values when discussing aggregate indicators for policy-making. Moreover, if different industries or countries are charac-terised by different underlying distributions of the measured performance, aggregation across industries (eg to retrieve country averages) or across countries (eg to retrieve EU-wide aver-ages) may introduce a further bias and generate a distorted message, if weighting is not appropri-ately taken into account.
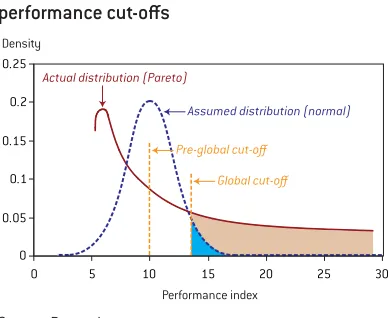
A second policy implicationis linked to the effec-tiveness of a given policy action in enhancing competitiveness. The empirical literature on inter-national trade has shown that, in the context of increasing trade openness and economic integra-tion, and thus tougher competiintegra-tion, the ‘minimum’ level of performance (ie productivity, size, etc) at which firms are able to compete on global markets (the so-called ‘performance cut-off’) has increased over time, something that is shown in Figure 2 on the next page by a shift to the right of the cut-off point (conventionally set at the begin-ning of the mean of the distribution). In fact a very large share of the exports of any country is accounted for by a relatively small share of large and competitive firms.
graph are characterised by the same average per-formance index, around 10.
Suppose now that, when we move to state 2, the new performance threshold that identifies the ‘champions’ able to successfully compete on global markets increases to 14. In this case, a policy that aims at raising the average perform-ance of the firms in the sector or country– leav-ing unchanged the density of the firms around the new performance threshold – could be misguided. While successful in increasing the average per-formance of the sector above – but possibly only marginally – the performance index of 10, the policy would have limited effects on the country’s competitiveness, since too few firms would actu-ally perform over the required threshold of 14. As a result, while the few firms with performances (productivity, size) above the new, higher thresh-old will thrive, those firms characterised by ‘aver-age’ performance indices will likely experience difficulties in the new competitive environment and will eventually be forced to exit.
In this context, a vast and growing empirical liter-ature – some results of which we will report in the final section – has shown that firms react very dif-ferently to shocks depending on their specific characteristics; most notably size, industrial organisation, technology/research content, market conditions, entry/exit barriers and trade frictions in the main sectors of specialisation.
This calls for a new set of policies able to foster the dynamic transition of firms already above the industry average towards even higher perform-ance. Hence, rather than just working on the ‘aver-age’ performance of the sector, a successful policy for competitiveness should aim at generating a 'thicker' right-hand tail of the distribution over time. In this sense, policies aimed at fostering the internal growth of firms via more efficient product and factor markets (cross-firm competition and agglomeration, removal of financial constraints and better access to capital, wage-setting mech-anisms more in line with individual firms’ produc-tivity) are instrumental in reallocating resources towards better performing firms and thus increas-ing the aggregate level of competitiveness. Instead, policies aimed at supporting weaker firms, such as those targeted towards small and
medium enterprises, may result in barriers to growth and the thickening of the upper tail of the performance distribution.
2 FIRM-LEVEL INDICATORS: A SAMPLE OF RESULTS OF USE IN ROUTINE
COMPETITIVENESS ANALYSIS
Despite its obvious superiority for assessing com-petitiveness, firm-level analysis is hampered by two sets of problems. First, data availability remains an issue, as the data – when available – is in general not homogenous and comparable across countries (see Appendix). Second, the analysis at present is not systematic. The focus tends to be mainly on research/case studies with an emphasis on the limitations of the data cur-rently available. Little attention is given to the ways in which available data could be used for policy analysis. The result is that in policy envi-ronments, firm-level analysis is considered possi-bly promising, but of little practical use.
Against this background, in the remainder of this Policy Contribution we mention a number of prac-tical results arising from existing studies, which provide useful insights for routine competitive-ness assessment. These results support the argu-ment that micro data is essential for competitiveness analysis.
2.1Trade-off performance’s average vis-à-vis dispersion
Consistent with the discussion in section 1.1, there is a conceptual interaction between overall industry performance and firm heterogeneity. We
0 0.05 0.1 0.15 0.2 0.25
0 5 10 15 20 25 30
Assumed distribution (normal) Actual distribution (Pareto)
Pre-global cut-off Density
[image:4.595.348.543.125.284.2]Performance index Global cut-off
Figure 2: International operations and performance cut-offs
2. Means and averages are computed from firm level data from the EFIGE and Amadeus databases. 3. The positive correlation between the variance and the average value of a given measure is a statistical property of Pareto distribu-tions. The relationship re-ported in Figure 3 is robust across a range of European countries and industries, even if outlier observations are excluded.
4. The sample is derived from the Amadeus dataset.
present here two applications with rich policy implications:
2.1.1 More dispersion, higher average performance
If a sector has a higher average performance than another, does this mean that all of its firms are better than those in the weaker sector? Not nec-essarily; it can mean the opposite because aver-age performance improves if the heterogeneity of firm characteristics grows. Figure 3 shows that
the average sector added value is positively cor-related to its variance, the within-industry disper-sion of firms’ performance, for both France and Italy2. This is because the greater the variance of
firms performance, the greater the share of high performing firms, ie the thicker the right hand tail of the distribution in Figure 1 and consequently the higher the average sector performance3. The
intuition behind this result is that the more a sector is populated by firms with different per-formances – which in turn can be related to dif-ferent individual characteristics, such as size, product differentiation, organisation, and so on – the more there is scope for market forces to real-locate productive resources from worse to better performing firms within the sector. As sectors become more competitive, the gap between the best and worst performers increases.
2.1.2 Trade shocks and the happy few
What is the effect of a trade shock on firms’ pro-ductivity and competitiveness? It can be shown that the effect is heterogeneous across the distri-bution of firms’ performance. If the shock goes in the direction of reducing trade barriers, it will raise dispersion and the share of high performers. As an example, examine how the productivity of a rep-resentative sample of Italian machinery produc-ers changed following the introduction of the euro. Figure 4 shows the evolution of the (Pareto-shaped) distribution of their productivity levels between 1997 and 20044. Its salient feature is
that the distribution had 'fatter tails' in 2004 than in 1997 with a relative hollowing out of the inter-mediate range of productivity levels. Based on the
1500
2000
2500
3000
Added value (€000s)
0 0.0002 0.0004 0.0006
France
Italy
0 0.0002 0.0004 0.0006
1500
2000
2500
3000
Added value (€000s)
Variance of performance indicator
Variance of performance indicator Average added value of industry Fitted values
[image:5.595.52.239.312.766.2]Average added value of industry Fitted values
Figure 3: More variance, more average industry added value, France and Italy
Source: Bruegel based on EFIGE/AMADEUS data.
0
0
.5
1
1.5
Density
10 10.5 11 11.5 12 12.5
Performance index (TFP)
1997 2004
Figure 4: Introduction of the euro and changes in firm-level productivity distributions, machinery industry in Italy
‘Larger firms are generally more efficient and more likely to compete successfully in global
markets, through an expansion of their international operations. Firm-level characteristics are of
paramount importance, relative to overall country conditions, in explaining competitiveness.’
insights gained in section 2.1.1, this is good news as 'fatter tails' promote higher added value. It also means that the proportion of firms above the per-formance threshold at which firms become com-petitive on global markets has likely increased (see section 1).
These two examples show – once again – that policies aimed at improving industry performance should not focus only on the average firm but should also pay specific attention to the thickness of the 'tails' of the distribution of firm-level per-formance. Along these lines, appropriate compet-itiveness indicators would need to be constructed taking into consideration both the average as well as the variance of the distribution. At the very least, policymakers should be made aware of both dimensions to provide a complete picture of underlying competitiveness.
2.2 The role of firm size
The role of firm size in fostering business per-formance as measured by productivity or export performance is by now well established in the lit-erature (see Mayer and Ottaviano, 2007). Larger firms are generally more efficient and more likely to compete successfully in global markets, through an expansion of their international oper-ations. Barba Navaretti et al(2011), in their com-parative study of European firms, show that firm-level characteristics are of paramount impor-tance, relative to overall country conditions, in explaining competitiveness. In particular, accord-ing to Barba Navaretti et al, if Italian firms had the same size distribution as German firms (keeping their sector specialisation constant), the value of Italian exports would have increased by some 25 percent. The same exercise for Spain would yield an increase of some 10 percent. This suggests the vital role of the size distributions in determining aggregate performance. The effect of country characteristics on performance are critically fil-tered through their effects on the entire distribu-tion of firm-level performance (see also Di Mauro
et al, 2009).
2.3 Changes in productivity and labour reallocation
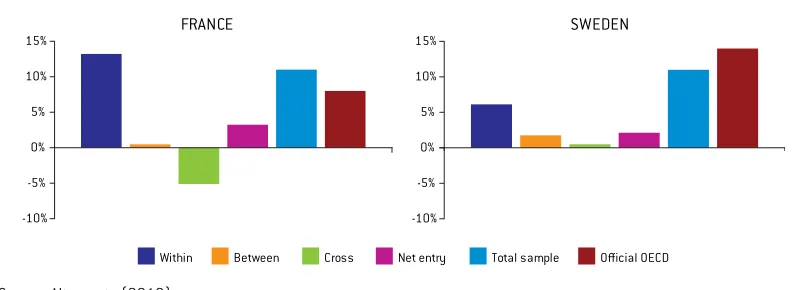
In the following application, firm-level data is used to enrich the analysis of productivity changes at the aggregate level. Using a representative sample of French and Swedish firms, changes in productivity between 2000 and 2008 are computed at the country level (blue bars). As a control, the red bars – which represent the OECD macro official figures – yield similar aggregated results. We use firm-level data to decompose the total productivity increases into changes i) taking place withinfirms (for a given market share), ii) resulting from the reallocation of workers between
existing firms (switch of market shares between firms, keeping productivity constant), iii) resulting from the net entry of new firms, and iv) from
cross-firm changes (because of overall market
adjustments in size and productivity). The effect on aggregate productivity crucially depends on the ability of the labour market to reallocate resources across firms. Note that in France, where most of the adjustment is driven by within-firm effects, total productivity increases less than in Sweden, where labour reallocation is a more important driver (Figure 6 on the next page). Once again, examining firm-specific patterns is fundamental for policies aimed at enhancing competitiveness.
0 5 10 15 20 25 30 35 40
% c
h
an
ge
in t
ot
a
l e
xp
or
ts
France Italy Spain
[image:6.595.350.538.218.346.2]Interaction Size Sector
Figure 5: Percentage change in the value of exports using German size-sector employment distribution with constant total employment
Within Between Cross Net entry Total sample Official OECD
FRANCE SWEDEN
-10% -5% 0% 5% 10% 15%
[image:7.595.52.451.125.270.2]-10% -5% 0% 5% 10% 15%
Figure 6: Decomposition of aggregate productivity growth across countries
Source: Altomonte (2010).
3 TOWARDS A FIRM-LEVEL TOOL FOR ASSESSING COMPETITIVENESS
Taking a firm-level view is key if the various fac-tors lying at the root of competitiveness are to be appropriately disentangled. Since firms are very different from each other, however, the issue of fostering competitiveness boils down to the dynamic problem of moulding the distribution of firms across different performance levels in order to thicken the tail of better performing firms. Deep-ening the analysis of firm-level data provides crit-ical information for the design of appriopriate competitiveness-enhancing policies that will com-plement traditional macro analysis.
To do so, however, we need to substantially
strengthen the firm-level databases already avail-able. This implies, first, making them comparable across countries using well-designed surveys that are homogenous and sufficiently detailed. The EFIGE project coordinated by Bruegel offers a crit-ical benchmark in this respect (see www.efige.org).
Equally, there is a need to develop new synthetic indicators able to translate the distributions of firms’ characteristics into measures of competitiveness. In this short note we have argued that the variance of the distributions already conveys important additional information, complementing standard averages. However further work is necessary.
REFERENCES
Altomonte, C. (2010) ‘Microfounding Europe 2020: firm-level evidence in four European economies’, XXII Villa Mondragone International Economic Seminar, Rome
Barba Navaretti G., M. Bugamelli, F. Schivardi, C. Altomonte, D. Horgos & D. Maggioni (2011) The
Global Operations of European Firms, Blueprint 12, Bruegel
Bernard A., J. Jensen, S. Redding and P. Schott (2011) ‘The empirics of firm heterogeneneity and international trade’, Annual Review of Economics, forthcoming
Di Mauro, F., Ottaviano, G.I.P. and Taglioni, D. (2009) ‘The competitiveness of European firms and the euro’, Vox EU, 10 March
EFIGE (European Firms in a Global Economy: internal policies for external competitiveness), http://www.efige.org
Krugman, P. (1997) Pop internationalism, MIT Press: Cambridge, Mass.
APPENDIX: AVAILABILITY OF FIRM-LEVEL DATA
In terms of data availability, the ability to perform a cross-country exercise based on firm-level data can vary across the EU because of at least three possible situations: 1) detailed and comprehensive firm-level data exists within national statistical offices and is generally available to researchers; 2) firm-level data exists within national statistical offices but is protected by non-standardised or strict and impractical access procedures, so is difficult, if not impossible, to obtain and use for trans-national teams of researchers; 3) firm-level data does not exist within national statistical offices, or the data that does exist has a very narrow scope/quality.
Even assuming that detailed and comprehensive firm-level data exists and is accessible, however, cross-country analyses risk being limited in scope. An assessment has to be made of the comparabil-ity of data, as there might be a limited set of overlapping variables, or the thresholds on which the sample of firms have been constructed might differ. Moreover, while the results might be only partially informative (only for certain variables and only for a subset of countries) the coordination of efforts can be substantial.
One alternative route taken by some statistical offices or national central banks in order to overcome the limitations of existing firm-level data is to deepen the scope of the analysis in terms of surveyed variables through the set up of ‘specialised’ surveys. These exercises, the most famous being the
Com-munity Innovation Survey(CIS), have the advantage of covering in detail one particular aspect of