Ship Design Optimization in the Multimodal Logistics Framework
E.K. Boulougouris
1a, C. Gohari
1band A.D. Papanikolaou
1c1Ship Design Laboratory, National Technical University of Athens, 9, Heroon Polytechniou Street, Greece
a[email protected], b[email protected], c[email protected]
Keywords: Logistics based ship design, multi-modal transportation, multi-objective optimization, neural networks, genetic algorithms
Abstract. The significance of multimodal transportation systems has worldwide increased significantly over the past two decades. European Union, United States and Japan have increased their efforts in studying the dynamics of multimodal transportation networks. In EU a Trans-European Transport Network (TEN-T) Committee has been setup by the Commission in its search for new mechanisms promoting motorways of the sea, which could relieve bottlenecks on land. On the other hand the EU States’ aid to the shipbuilding and shipping industry is very limited; the shipbuilding cost has climbed recently significantly, among others due to great demand, while the worldwide competition among shipyards has increased; freight rates are standing at very high levels while the cost of fuel has continuously increased. The interest of ship owners in investing in additional capacity and services in seaborne alternative routes is negatively affected by the increase of ship and fuel prices, the competition by other means of transportation and the lack of tools for assessing market niches and real business opportunities. This creates an increasingly high risk in a traditionally conservative industry such as the maritime industry, making the main actors reluctant to invest. From the scientific point of view, the above complex business scenario can be approached as a Multi-objective optimization problem, aiming at the maximization of the capacity transported by sea while shipyards and ship-owners are looking for the maximization of their profits. The latter are clearly conflicting requirements. In the paper the authors present part of their recent research work on the above optimization problem of the design of ferries and Ro-Ro cargo ships using pattern recognition techniques (Artificial Neural Networks), Multi-objective Genetic Algorithms (MOGA) and the know-how created through the EU FP6 Research Project LOGBASED. A case study of the transportation of agricultural goods from the Greek Island of Crete to the markets of Munich is presented. The results of this study prove useful for the assessment of viable solutions serving in a balanced way the interests of shipyards, ship operators, cargo owners, banking and financial institutions, investors and government administrations in the framework of optimized transportation scenarios.
Introduction
The physical distance between the production locations and the consumers’ markets in EU creates the requirement for reliable and timely transportation of goods. The vast increase of the number of cars and the slow expansion of the motorway infrastructure, led EU to setup the Trans-European Transport Network (TEN-T) Committee in an attempt to promote motorways of the sea which could relieve bottlenecks on land [1]. In this respect EU plans to include into the “Marco Polo II” program new actions such as motorways of the sea and traffic avoidance measures. This is also an attempt to take measures against global warming, since the fuel efficiency of cargo transport by ship per ton-kilometer is better than by motor transport ([2], [3]). However, the existing sea transportation network is sometimes inefficient and incapable to meet the new service expectations and the shipowners are in most cases reluctant to take the risk of establishing new routes without long periods of thorough investigation. Even though, the ships put in service on these routes (existing or new) are not always efficient for the assigned mission, being too expensive or too slow, too big or too small for market demands.
On the other hand the EU States’ aid to the shipbuilding and shipping industry is very limited; the shipbuilding cost has climbed recently significantly, while the worldwide competition among shipyards has increased; freight rates are standing at very high levels while the cost of fuel has continuously increased. The interest of ship owners in investing in additional capacity and services in seaborne alternative routes is highly disturbed by the increase of ship and fuel prices, the competition by other means of transportation and the lack of tools for assessing market niches and real business opportunities. This creates an increasingly high risk in a traditionally conservative industry such as the maritime industry, making the main actors reluctant to invest.
In this business environment, the optimization of the design of the tailor-made ship for the particular sea route is the ideal situation that reduces the risk and maximizes the returns of the investment. This is well known among the ship operators. The problem is how to define the “perfect ship” for the route given:
The fluctuations of the market (passengers and cargo)
The uncertainty for the behavior of the rest of the stakeholders (cargo owners, port authorities, international regulatory bodies etc.)
The uncertainly of the environmental factors
These facts have made many shipping companies being traditional and conservative, reluctant to accept the evolution in the logistical field [4]. They prefer using ships similar to those of their competitors and provide services in well-established routes under the assumption that in this way they minimize their risk. Therefore, when they decide to build a new ship, they usually come up with a set of owners’ requirements that resembles those of existing ships. These requirements are mandatory for the ship designers, who rarely have the capability or the opportunity to question their rationality. This has been addressed within the EU FP6 Research Project LOGBASED ([5] and [6]) which attempts to provide designers, shipbuilders and ship operators with better guidance to develop effective ship designs for business opportunities relating to multimodal transportation solutions of freight, particularly rolling cargo. This paper although it follows the LOGBASED approach, goes one step further, trying to establish a rational optimization procedure for aiding the Decision Maker (DM), whether this is the designer or the ship operator, to find the optimum ship for his needs.
Multimodal Network
The transportation network represents the physical flow of goods and resources and it consists of nodes and links. The first are the places where the flow of goods is or may be stopped, while the latter represents the movements connecting the nodes (i.e. a truck transport or a sea voyage). The connection between locations L1 and L2 in the multimodal
framework has many different solutions as can be seen in Figure 1. Each solution route has its own properties. For the land network these properties are:
Distance
Speed limitations
Traffic limitations (prohibited traffic)
Tolls, border crossings
Traffic congestion likelihood
For the sea network these properties are:
Distance
Port speed and draft limitations
Port congestion probability
Adverse sea conditions probability in the sea route
Port fees
[image:2.595.163.433.523.733.2] Port loading/unloading time
Problem Description
In its general form the multimodal logistic design problem can be defined us:
Design the “optimum” ship for a multimodal transport chain with Volume V of Cargo type T from location L1 to L2 given the existing motorway network M and the available ports in the region P, under the constraints imposed by the shipowner CS and the cargo owner CC, in the sea environment S and the business environment B.
In the above definition all the quantities have to be described carefully. Starting from L1 and L2 we should clarify that
[image:3.595.61.535.251.332.2]given the multimodal nature of the approach, we are considering the whole Door-To-Door (D2D) network and not the Quay-To-Quay (Q2Q) as it is mostly commonly done, given the fact that the latter represents only about 20% of the first in some cases [5]. Therefore, any attempt to optimize the ship design considering only the sea leg of the transportation network is very shortsighted, and it is failing to see the “big picture” (see Figure 2).
Figure 2. Door-to-Door multimodal transportation network [5]
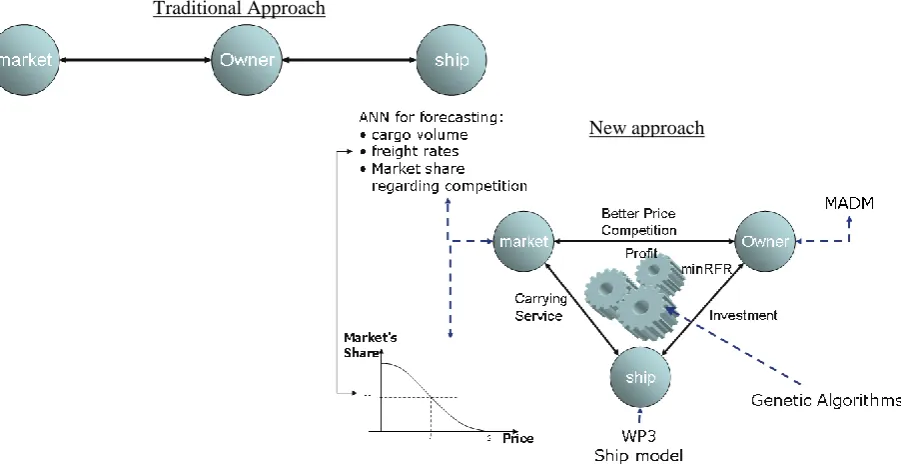
In this respect the design of the ship becomes and integral part of the whole business, which has three key-players, namely the market (cargo owner), the ship owner and the shipyard/ship designer. These three players used to take decisions sequentially (see Figure 3). The shipowner was estimating according to his knowledge the present condition of the market/cargo-owner regarding the demand levels and the freight rate he could ask for and based on his financial capabilities he was quoting the shipyard for a newbuilding. His requirements were based on:
Requirements or constraints imposed by other stakeholders such as large cargo owners
Previous experience with similar ships or the particular market
Ships that “successfully” were operating on the market
This situation prohibited the ship designer from taking into account the whole picture and providing the optimum solution for the service.
The new approach introduced by LOGBASED requires the parallel communication between all three key-players as shown in Figure 3. It is basically a transport system and ship design development methodology using corresponding analysis techniques and it can successfully facilitate a better understanding of almost any interactions and relationships among critical factors influencing the goodness of fit of market, owner and ship performance expectations [6].
Each of the three key-players introduces his parameters, constraints and expectations into the overall business model [7], namely:
The cargo owner specifies the What, Where, How Much and When: o the cargo type,
o the locations L1 and L2 and any constraints he may have on the sea transportation and the other
transport alternatives (rail, road or air)
o the cargo volume, and its sensitivity to freight rate, o the importance of the time element (timetable)
The ship owner/operator specifies the sea freight and the cargo handling (on board and in port) and he is interested in the daily running cost, the voyage cost and the capital cost in order to maximize his profit while remaining low in price, in order to safeguard the cargo volume.
Figure 3. Comparison of Traditional and the New approach to Ship Design Specification
Demand analysis and forecasting
A critical parameter in this optimization problem is the cargo volume. This refers to the total volume demanding transportation as well as the market share that we are looking to take after providing the service. For the first, the existing total volume of goods moved between the source and the destination points in the network can be estimated on an annual base according to statistics (i.e. EUROSTAT). The actual cargo flow available for transportation is a function of:
The demand forecast
The freight rate of the new service and its relationship with the freight provided by the competitors
For the first, estimations could be based on conservative flat growth rates or more advanced Artificial Neural Network models based on the historical values (see [8], [10] and[11]). Sacrifice models have also been used by Katuhara et.al. [12], where the amount of sacrifice is the burden assumed in transport, which consists of the costs, time required, and other factors committed in the course of transporting the cargo goods. In their approach, the total cost and time required, etc. to move cargo (goods and commodities) along each transport route in the network is determined, the time value that the cargo has is multiplied by the time required to transport it for each respective route, and finally the route with the least amount of sacrifice with costs added is selected. Katuhara et.al. are using Dijkastra’s method for route search utilizing the sacrifice function used is given equation in Eq. 1 [12]. Another alternative for this it would be to use the more efficient A* (A-star) algorithm, that is has been used for route finding in the ship evacuation simulation [13]. The freight rate is a function of the land transportation cost, the ship transportation cost and the profit margin. For the ship design optimization purposes, the cost used for all the other players (e.g. competitor shipping companies, truck companies) is the final price that the cargo owner will pay. For the ship itself the costs are considered in more details and they are inherently related to the design.
Ship Design
In this business environment, ship’s characteristics are very important in order to determine the two most important elements of the provided service: cost and time. The first is a function of [7]:
The daily running cost, that includes crew, supplies and maintenance cost
The voyage cost, that includes fuel cost and port fees
The capital cost, that includes financing and newbuilding cost
The time element is a function of:
The service speed
The speed reduction due to the effects of the sea environment Traditional Approach
The loading/unloading speed, including the maneuverability performance in port
To determine these costs, a preliminary study of the ship is required. It is based on the carrying capacity, the speed and the required autonomy it will try to come up with a feasible design. The design itself is an iterative process requiring several decisions to be taken until it converges. These decisions could extend throughout the whole building phase of a newbuilding project but the initial decisions taken in the early design phase could commit almost 70% of the total cost [5]. This fact depicts that based on the main features of the ship design and using the appropriate methodology, a rough estimate of the actual building and operating cost is feasible.
Optimization
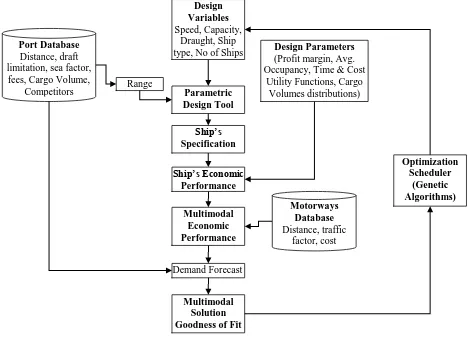
There are two sets of design variables. The first one is used for the individual ship design, while the second is used for the fleet. The design variables for the ship are the speed and capacity, draught and the ship type (i.e. Ro-Ro Cargo vessel). The design variable for the fleet is number of ships, from which the number of services can be easily calculated. There are also two sets of design parameters. The first is provided by the shipowner and it refers to the average occupancy required in order to estimate the Required Freight Rate (RFR), and the profit margin. The second refers to the cargo owner’s utility functions for cost and time for the particular cargo. These values are provided (see Katuhara et.al. [12]) or they are guesstimated.
Two databases are used for the sea and the land routes. The first contains the distance between the port nodes of the network, the draft limitations, the sea factor, the total cargo volume to be transported, the presence of any competitors and their market share. The second contains the distances between land nodes of the network, the costs and the traffic factor.
The design variables and the range are fed into a Parametric Design Tool (PDT), which has been developed by SDL-NTUA within the LOGBASED project in MS Excel 2003, with Visual Basic for Applications (VBA) macros. PDT is able to develop very rapidly different design solutions and exploit the feasible design space. Furthermore, the PDT has also used in the LOGBASED approach to benchmark or calibrate heuristically selected system design parameters for extreme values or outliers [6]. It consists of five (5) main functional elements:
Element I: A database of existing ship designs and their main particulars (ship types, sizes and special features)
Element II: A query tool for the analysis of the database and the extraction of useful relationships among the various design parameters and an ANN tool
Element III: A tool for the design and the trade-off analysis around a Design Point (DP)
Element IV: The “Ideal Ship Price”, Net Present Value (NPV) and Required Freight Rate (RFR) calculator
Element V: The parametric and ratio goodness-of-fit test.
The existing design database provides a library of information of proven designs for the designer. Two datasets were used for the set-up of this database. The first one is a ship database for various ship types, including Ro-Ro Cargo vessels, introduced by SDL-NTUA. A second set of data was provided by the LOGBASED project partner DNV and it was further analyzed by SDL-NTUA. The database of Element I currently includes data of 872 Ro-Ro Cargo and other ships [14], disposed by the partners of the LOGBASED project. For these ships most of their data is known, including their displacement.
In the optimization version the query tool (Element II) is not used because it requires user interference. On the contrary, the Artificial Neural Networks (ANN) tool of Element II, that has been trained using the databases in order to identify hidden relationships in the datasets, is used. Using the design variables, the ANN creates an initial estimation for the main particulars of the design. These are fed into the Element III of the PDT.
tanks can be taken into account. A valid design occurs when all the weight, power and cargo lane meter requirements have been satisfied. The process is highly automated and it uses the Solver MS Excel Add-on in order to converge. Given the ship main particulars, range and the power requirements, Element IV of the PDT is used to calculate the RFR. Using the design parameter for the profit margin, the freight rate for the sea route is calculated. The motorway database provides all the required information for the land transportation, including cost and time. Thus, both cost and timetable for the whole proposed network is estimated.
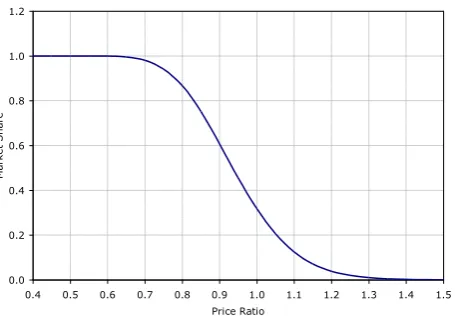
The next step is to calculate the market share, which the proposed service will attract. This was based on the time and price utility functions of the cargo owner. The market share will obviously drop as the price and time increases. The most appropriate function to depict this behavior is the lognormal distribution. The calibration of the utilities function is based on the input parameters for the price/time ratio for which the new service will gain 98% of the cargo volume and the price/time ratio for it will get only 2% of the cargo volume. Figure 4 shows the utility function for 0.4 and 1.25 values respectively (e.g. 60% reduction to the existing service wins 98% of the market while 25% increase of the existing price provides only 2% of the market). The weighting factor between those two obviously depends on the cargo type and therefore it should be provided by the cargo owner. Therefore the final market share is calculated according to the Eq.(1) below:
MSh = TUF( T ) *W1 + CUF( C ) *W2 (1)
where: MSh: The market share gained TUF: The time utility function CUF: The cost utility function
W1: The relevant importance of the time
W2: The relevant importance of the cost
0.0 0.2 0.4 0.6 0.8 1.0 1.2
0.4 0.5 0.6 0.7 0.8 0.9 1.0 1.1 1.2 1.3 1.4 1.5
Price Ratio
M
ar
ke
t
S
h
ar
[image:6.595.186.414.395.553.2]e
Figure 4. Price Utility Function
Multiplying the market share with the available cargo volume, the total transported volume by the service can be estimated. Multiplying it with the freight rate, the total income can be calculated, whereas dividing it with the total number of services per year, the average occupancy can be estimated. Using this income, the NPV of the whole investment into the purchase of the fleet can be estimate.
In order to take into consideration the adaptability of the design to market fluctuations, 7 different cargo volumes are used. These are predefined fraction of the forecasted cargo volume Q. These are Q/3, Q/2, 3Q/4, Q, 5Q/4, 3Q/2, 2Q. The final adaptability index is formed by the NPV calculated for each of these cargo volumes, multiplied by the probability of accruing according to shipowner’s or cargo owner’s estimates or experts’ judgment. Thus the Adaptability Index is given by the following formula:
A.I. =
71
i
i i
P
Q
NPV
(2)Where Qi each of the seven predefined cargo volumes and Pi their assigned probability of occurrence.
- The maximization of the market share
- The maximization of the NPV of the whole investment
- The maximization of the Adaptability Index of the ship design to market fluctuations.
[image:7.595.70.542.177.515.2]Using these 3 objectives, the Pareto Surface of the non-dominated design solutions is formed using the modeFRONTIER general optimization software. The flowchart of the optimization problem is shown in Figure 5.
Figure 5. Optimization Flowchart
Case Study
The optimization process has been applied to a transportation scenario of goods using Ro-Ro cargo units from the Greek Island of Crete and more specifically the port of Iraklion to the markets of Munich in Germany. The existing transportation network requires the transportation of goods from Iraklion to the port of Piraeus and from there by truck to the port of Patras, in order to be transferred by sea to Italy through the ports of Bari, Brindisi, Ancona or Venice by ferry. Then, by truck they will reach Germany. Given the transportation corridors identified by the EU commission (see Figure 6 and Figure 7), the following alternatives were studied:
1. New sea route Iraklion - Patras and from there using the existing network
2. New sea route Iraklion – Kalamata - Patra and from there using the existing network 3. New sea route Iraklion - Bari and from there using the existing network
4. New sea route Iraklion - Brindisi and from there using the existing network 5. New sea route Iraklion - Ancona and from there using the existing network 6. New sea route Iraklion - Venice and from there using the existing network 7. New sea route Iraklion - Thessalonica – Igoumenitsa – Bari
8. New sea route Iraklion - Thessalonica – Igoumenitsa - Brindisi 9. New sea route Iraklion - Thessalonica – Igoumenitsa - Ancona 10. New sea route Iraklion - Thessalonica – Igoumenitsa – Venice
11. New sea route Iraklion - Thessalonica – Sofia- Budapest –Vienna - Munich
12. New sea route Iraklion - Volos – Thessalonica – Sofia- Budapest –Vienna - Munich
Design Variables
Speed, Capacity, Draught, Ship type, No of Ships
Port Database
Distance, draft limitation, sea factor,
fees, Cargo Volume, Competitors
Motorways Database
Distance, traffic factor, cost
Parametric Design Tool
Range
Ship’s Specification
Ship’s Economic Performance
Design Parameters
(Profit margin, Avg. Occupancy, Time & Cost
Utility Functions, Cargo Volumes distributions)
Multimodal Economic Performance
Demand Forecast
Multimodal Solution Goodness of Fit
Optimization Scheduler
Figure 6. EU major transportation axes for the studied area [19]
Figure 7. Adriatic-Ionian Transport Area [20]
The cargo volumes were estimated based on the available data from the National Statistics Service of Greece (NSSG). A sample of these data is shown in Figure 8. On the left side, the monthly Cargo demand in tons from the port of Iraklion to the port of Piraeus in 2005 is shown (domestic cargo flow). From this figure it is obvious that most of the cargo transported is of Ro-Ro type. On the right side of Figure 8, the annual cargo imports and exports from and to Germany respectively of the whole island of Crete from 1998 up to 2004 is shown (international cargo flow). It is obvious from this chart that given the imbalance between the exports and the imports, most of the Ro-Ro cargo units will travel full from Crete to Italy and a 40% to50% of the units returning will be empties.
[image:8.595.136.462.356.545.2]0 20000 40000 60000 80000 100000 120000 140000 C a rg o [to n s ] Jan-05 Feb-05 Mar-05 Apr-05 May-05 Jun-05 Jul-05 Aug-05 Sep-05 Oct-05 Nov-05 Dec-05
Total Cargo RoRo Truck+ RoRo IMPORTS AND EXPORTS FROM CRETE
[image:9.595.60.526.93.252.2]0 10000 20000 30000 40000 50000 60000 70000 80000 90000 100000 2004 2003 2002 2001 2000 1999 1998 Year An n u a l Car g o [ to n s ] Exports Imports
Figure 8. Cargo Demand for Greek Island of Crete [source: NSSG]
Based on the above described methodology the analysis of 168 Ro-Ro ship designs with 1000 to 2500 lane meters and speeds ranging from 14 to 26 knots was performed. In Figure 9 the Pareto front for the routes connecting directly the Island of Crete to the Italian ports is shown. The objective on the horizontal axis is the D2D time while on the vertical axis the variable cost of the ship’s fuel cost per truck plus the land transportation cost (e.g. truck fuel, tolls, driver’s cost) is shown. 500.00 € 1,000.00 € 1,500.00 € 2,000.00 € 2,500.00 € 3,000.00 € 3,500.00 € 4,000.00 € 4,500.00 €
40.0 45.0 50.0 55.0 60.0 65.0 70.0 75.0 80.0
D2D Time Costs Pe r L.U. Venice Ancona Brindisi Bari
Figure 9. Pareto front of the D2D time versus the ship fuel cost per truck + land transportation cost
CONCLUSION
Multimodal transportation is a complex multivariable, multiobjective problem. Any attempt to optimize any of its elements, has to consider and appreciate this complexity. Herein, a rational optimization methodology for logistics based ship design in the multimodal transportation framework has been presented and a case study of the transportation of goods from the Greek Island of Crete to the markets of Munich has been outlined. The results of the proposed methodology prove very promising for the assessment of viable solutions serving the interest of shipyards, ship operators, cargo owners, banking and financial institutions, investors and government administrations in the framework of optimized transportation scenarios.
ACKNOWLEDGEMENTS
[image:9.595.140.441.339.541.2]References
[1] EC, Article 12a of the TEN-T Guidelines of 29 April 2004, COM (2004) 0884, Official Journal L 167, 30/04/2004, p.1-38, on: http://ec.europa.eu/transport/intermodality/motorways_sea/index_en.htm.
[2] EC, COM(1999) 317, 29.06.1999, on: http://ec.europa.eu/transport/maritime/sss/doc/com_99_317_en_final.pdf [3] EC, Press release IP/04/515 on: http://ec.europa.eu/ten/transport/legislation/index_en.htm.
[4] T.A.V. Johnsen and T.J. Vabø: Strategic Planning for The Norwegian Rhine Line by use of Operations Research, Master Thesis, NTNU, Trondheim (2006).
[5] P.O. Brett, G. Carneiro, R. Horgen, D. Konovessis, I. Oestvik and J. Tellkamp: LOGBASED: Logistics-Based Ship
Design, 9th International Marine Design Conference (IMDC’06), Ann Arbor, Michigan, USA, 16-19 May 2006.
[6] P.O. Brett, E. Boulougouris, R. Horgen, D. Konovessis, I. Oestvik, G. Mermiris, A. Papanikolaou, and D. Vassalos: A Methodology for Logistics-Based Ship Design, 9th International Marine Design Conference (IMDC’06), Ann Arbor, Michigan, USA, 16-19 May 2006.
[7] K. Levander: Innovative Ship Design: Can Innovative Ships be Designed in a Methodological Way, Proceedings of the 8th International Marine Design Conference, Athens, Greece (2003).
[8] EC, Directorate-General for Energy and Transport, Motorways of the Sea Brochure (2006) on: http://europa.eu.int/comm/dgs/energy_transport/index_en.html
[9] G. Zhang, B. E. Patuwo, M. Y. Hu: Forecasting with artificial neural networks: The state of the art, International Journal of Forecasting, Vol. 14 (1998), p. 35–62.
[10] M. M. Mostafa: Forecasting the Suez Canal traffic: a neural network analysis, Maritime Policy & Management, Taylor & Francis Ltd., Vol. 31, No. 2, (2004), p. 139–156.
[11] W.H.K. Lam, P. L. P. Ng, W. Seabrooke and E.C.M. Hui: Forecasts and Reliability Analysis of Port Cargo
Throughput in Hong Kong, Journal of Urban Planning and Development, ASCE, Vol. 133, No. 3, (2004), p. 133–
144.
[12] M. Katuhara, N. Kubo, H. Yamato, M. Kajiura and R. Michida: Optimization of Domestic Long Distance
Ferryboats and RoRo Ships based on Logistics, ClassNK Technical Bulletin, (2004), p. 1–14.
[13] E.K. Boulougouris and A. Papanikolaou: Modeling & Simulation of the evacuation process of passenger ships, IMAM 2002, Crete, Greece (2002).
[14] SDL-NTUA: SAFER EURORO Database, (2004).
[15] D.G.M. Watson and A.W. Gilfillan: Some Ship Design Methods, Transactions RINA, Vol. 119, (1977).
[16] J. Holtrop and G.G.J. Mennen: An Approximate Power Prediction Method, International Shipbuilding Progress, Vol. 29, (1982).
[17] J. Holtrop: A Statistical Reanalysis of Resistance and Propulsion Data, International Shipbuilding Progress, Vol. 31, (1984).
[18] E.STE.CO (2003), modeFRONTIER software v.2.5.x, in: http://www.esteco.it/
[19] EC: Networks for Peace and Development-Extension of the major trans-European transport axes to the
neighbouring countries and regions, November (2005).
[20] HB-Verkehrsconsult GmbH and VTT Technical Research Centre of Finland: Pan-European Transport Corridors
and Areas Status Report (PAN-EUROSTAR)-Final Report- Forecast until 2010, EU Research Project No
![Figure 1. Motorways of the Sea [8]](https://thumb-us.123doks.com/thumbv2/123dok_us/1718315.125222/2.595.163.433.523.733/figure-motorways-of-the-sea.webp)
![Figure 2. Door-to-Door multimodal transportation network [5]](https://thumb-us.123doks.com/thumbv2/123dok_us/1718315.125222/3.595.61.535.251.332/figure-door-to-door-multimodal-transportation-network.webp)
![Figure 7. Adriatic-Ionian Transport Area [20]](https://thumb-us.123doks.com/thumbv2/123dok_us/1718315.125222/8.595.180.416.101.341/figure-adriatic-ionian-transport-area.webp)
![Figure 8. Cargo Demand for Greek Island of Crete [source: NSSG]](https://thumb-us.123doks.com/thumbv2/123dok_us/1718315.125222/9.595.140.441.339.541/figure-cargo-demand-greek-island-crete-source-nssg.webp)