Int. J. Electrochem. Sci., 12 (2017) 6245 – 6254, doi: 10.20964/2017.07.69
International Journal of
ELECTROCHEMICAL
SCIENCE
www.electrochemsci.org
Electrochemical Behaviors of Ferrocene Dicarboxylate and its
Application for Heme Detection
Guo-Cheng Han1, Jiating Hou1, Zong-Li Huang1, Xiao-Zhen Feng1,2,*, Zhencheng Chen1,*, Wenxiang Xiao1and Shuang Li1
1
School of Life and Environmental Sciences, Guilin University of Electronic Technology, Guilin 541004, P. R. China
2
School of Chemistry and Pharmacy, Guangxi Normal University, Guilin 541004, P. R. China
E-mail: [email protected], [email protected]
Received: 1 April 2017 / Accepted: 15 May 2017 / Published: 12 June 2017
Heme is an active center of hemoglobin which is a porphyrin compound containing two free carboxyl groups that may exert intermolecular interaction with ferrocene dicarboxylate which can be studied by electrochemical methods. The CV experimental results from this current study showed that ferrocene dicarboxylate had a good pair of redox peaks in NaOH aqueous solution and organic solvents in a quasi-reversible electrode process. There was linear relationship between current and square root of the scan rate, belonging to diffusion-controlled redox processes. The signals from the potential and current had obvious shift after the reaction with heme, especially when the redox peaks disappeared from the organic solvents. Fc(COOH)2 was activated to give compound Fc(OBt)2 with saturated structure that did not show better redox peaks due to its worse solubility, hence it didn’t form hydrogen bonds with heme. DPV was used for heme assay, where the current was proportional to heme concentration in the range of 1.0-5.0 μM, with 0.7 nM detection limits.
Keywords: Electrochemical behaviors; heme; detection; hydrogen bond
1. INTRODUCTION
molecule makes the electrical activity center[3]. Hemoglobin can be reversibly combined with some gas molecules (O2 or CO) when it is in reduced (ferrous) state, having an important role in all life activities[4]. He Hemoglobin, as a natural horseradish peroxidase (HRP) substitution, can be successfully used for HRP enzyme catalytic reaction, where it shows a higher catalytic activity [5-7]. Determination of hemoglobin content is important in clinical practice. When the hemoglobin content is reduced, then there may be anemia which may be caused by various reasons. The hemoglobin content may relatively be increased due to increased white blood cells, therefore the accurate determination of hemoglobin and glycosylated hemoglobin content has a very practical significance [8].
At present, there are many methods for detecting glycosylated hemoglobin in clinical trials. According to the reaction principle which can be divided into two categories, the first category is based on charge difference between GHb and non GHb, such as ion exchange chromatography [9]and electrophoresis [10, 11]. The second category is based on the structural characteristics of GHb, such as affinity chromatography [12] [2], immunoassay [13] and enzyme method [14].
In recent years, electrochemical methods for the detection of hemoglobin and glycosylated hemoglobin have gradually been developed. Direct electrochemical studies of electron transfer between proteins and electrodes have been more and more valuable. The electrochemical properties of hemoglobin with various dyes as media for modified electrode have been studied [15]. These dyes mainly play the role of electron transfer between the electrode and hemoglobin with redox activity.
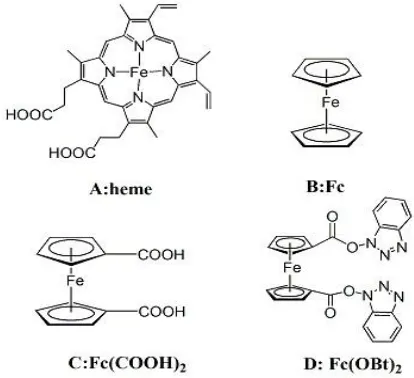
Figure 1. Structure diagram of heme, ferrocene and its derivatives
[image:2.596.194.401.390.579.2]
bind sugar-based n-terminal and detected glycosylated hemoglobin when dimethyl dioctadecylammonium bromide(DDAB) was used as a promoter, showing reversible redox peaks at 0.299V. Tanaka[22]and coworkers took ferrocene formate to modify antibody of hemoglobin and detect hemoglobin through electrochemical method, where the reversible redox peak appeared at 0.35 V. Our groups’ previous work studied the interaction of ferrocene derivatives and heme using UV-vis spectroscopy which paved the way for studying their interaction by electrochemical method [23].
Herein, we took advantage of ferrocene derivatives as electrochemical probe and heme as the active center of hemoglobin, as they all have some functional groups. The electrochemical method can be used for studying the interaction between ferrocene derivatives and heme, and also for the heme detection, providing a new way to explore the quantitative detection of hemoglobin based on the reaction of ferrocene derivatives and heme.
2. EXPERIMENTS
2.1. Reagents and instruments
All reagents used in the experiment were of analytical standard. Heme was obtained from Aladdin. Tetrabutylammonium perchlorate was purchased from Shanghai Huacheng Industry Development Co., Ltd., Fc(COOH)2 and Fc(OBt)2 were self-synthesized according to the reference procedure [24]. All aqueous solutions were prepared with Milli-Q water.
An electrochemical workstation (CHI660D, Shanghai Chenhua Instrument Co., Ltd.) was used to carry out all electrochemical tests.
2.2. Preparation of solutions and electrochemical test
1.0 mmol·L-1 stock solution of Fc(COOH)2 was prepared by dissolving Fc(COOH)2 in NaOH solution (pH=9) and different organic solvents. 1.0 mmol·L-1 stock solution of Fc(OBt)2 was prepared by dissolving Fc(OBt)2 in different organic solvents. 1.0 mmol·L-1 stock solution of heme was prepared by dissolving heme in Milli-Q water. All stock solutions were diluted to desired concentration of solutions when executing the test.
Three-electrode system was used to measure the cyclic voltammetry (CV) and differential pulse voltammetry (DPV) signal from all solutions, and the Au electrode was used as the working electrode. The platinum electrode was used as auxiliary electrode and the AgCl electrode was used as the reference electrode.
3. RESULTS AND DISCUSSION
3.1. Electrochemical Behavior of Fc(COOH)2
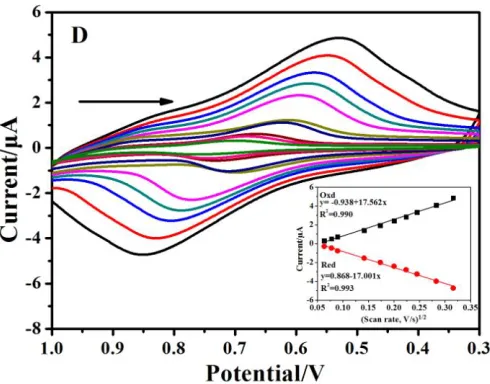
Figure 2. CV graph of Fc(COOH)2 solution with different scanning rates. Insert: Square root of relationship between current and scanning rate (A: NaOH; B: acetonitrile; C: ethanol; D: dichloromethane).
The effect of scanning rate was thus carried out. Fig. 2 shows the CV graph of 0.5 mmol·L-1 Fc(COOH)2 solution with different scanning rates in NaOH aqueous solution and different solutions, and the inserts are the square root of the relationship between current and scanning rate, the arrow is the scan direction.
As shown in Fig. 2 A, Fc(COOH)2 had a good pair of redox peaks at scan rate of 0.05 V/s, where Epa=0.438 V, Epc=0.351 V, ∆Ep=87 mV, ipa/ipc=1.30, so the electrode process was
quasi-reversible process. When the scanning rate was increased, the peak-type was constantly expanding outward and the current signal intensity of the redox peak of the Fc(COOH)2 solution was also enhanced, showing a linear relationship between the square root of scanning rate and current. The electrochemical behavior therefore belonged to diffusion-controlled redox processes [16, 26]. According to the CV results, the electrochemical behavior for the Fc(COOH)2 in organic solvents, acetonitrile, ethanol and dichloromethane belonged to diffusion-controlled behavior as shown in Fig.2 B, C and D, respectively.
3.2. CV and DPV signal of Fc(COOH)2, Fc(OBt)2 and heme
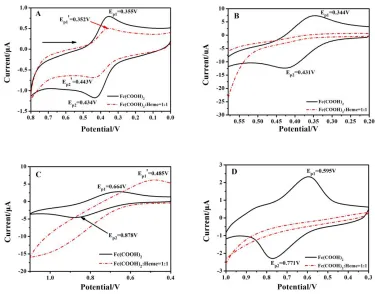
The next study used Fc(COOH)2 and Fc(OBt)2 as a probe to react with the heme in aqueous solution and organic solvents. The CV signal of 0.5mmol·L-1 Fc(COOH)2 and 0.5mmol·L-1 heme solution were determined by CV method at scan rate of 0.05 V/s. Fig. 3 shows the CV graph for Fc(COOH)2 before and after their reactions with heme were measured in aqueous solution and organic solvents, acetonitrile, ethanol and dichloromethane. The scanning ranged from 0 to 0.8V, 0.2 to 0.6V, 0.4 to 1.2V, and 0.3 to 1.0V, respectively.
[image:5.596.147.392.90.282.2]
in aqueous solution. It could be seen that there wereobvious redox peaks before the reaction, and the redox peaks were obviously weakened after the reaction, or even disappeared in organic solvents, acetonitrile, ethanol and dichloromethane as shown in Fig.3 B, C and D, because the structure of Fc(COOH)2 and heme contained relatively free carboxyl groups that could form hydrogen bonds between the two compounds through intermolecular hydrogen bonding interactions with each other, making growth of heme molecular chain. The electron transfer was obviously blocked, transmission speed slowed and current reduced [27, 28].
Figure 3. CV graphs for Fc(COOH)2 before and after reactions with heme in various solvents. (A: NaOH; B: acetonitrile; C: ethanol; D: dichloromethane)
The CV signal of 0.5 mmol·L-1 Fc(OBt)2 and 0.5 mmol·L-1 heme solution were determined by CV method at scan rate of 0.05 V/s. Fig. 4 shows the CV graphs for Fc(OBt)2 before and after the reactions with heme, measured in organic solvents, DMF, ethanol and dichloromethane, with scanning ranges from 0.3 to 1.0V, 0.4 to 1.2V, and 0.4 to 1.3V, respectively.
[image:6.596.108.483.216.510.2][image:7.596.71.528.149.271.2]
intermolecular interaction between Fc(OBt)2 and heme in three solvents, as it couldn’t form hydrogen bond with heme [29]. The change of electrochemical signal can be contributed by its insolubility after mixing with heme in organic solvents.
Figure 4.CV graphs for Fc(OBt)2 before and after the reactions with heme solution in various organic solvents. (A: DMF; B:ethanol; C: dichloromethane)
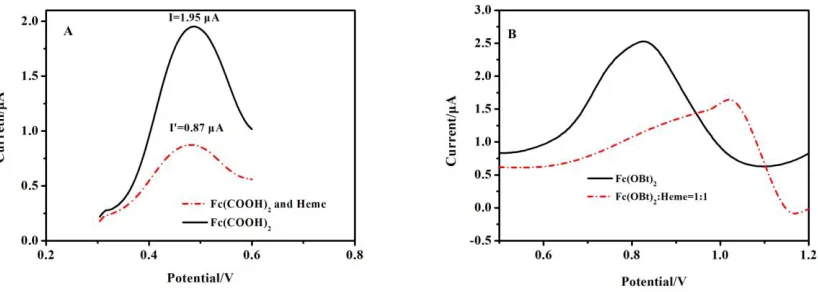
Moreover, Fc(COOH)2 and Fc(OBt)2 reacted with heme in solvents and the electrochemical signal was detected by DPV. Fig. 5 shows the DPV graphs for Fc(COOH)2 andFc(OBt)2 before and after the reactions with heme in solvents.
Figure 5. DPV graphs for Fc(COOH)2 (A) and Fc(OBt)2 (B)before and after their reactions with heme. (A: NaOH; B: dichloromethane)
[image:7.596.89.498.414.560.2]
heme in dichloromethane, so the Fc(OBt)2 solution may have been precipitated by the adsorption of heme, resulting in decreased Fc(OBt)2 concentration.
3.3. Detection of heme by DPV
Figure 6. A Current responses of electrode with various concentrations of heme. Insert: Dependence of ΔI on the heme concentration. B Selectivity of Fc(COOH)2 to heme. The concentration of analyte was 5.0 μM.
Finally, the DPV method was used to investigate heme detection based on above analytical performances[30]. Fig. 6A shows the amperometric responses of electrodes in solution with various contents of heme. The currents decreased with increasing concentrations of heme (Fig.6A). The linear regression equation was expressed as ΔI=0.58162+0.10261c (μM) (R=0.99738) in the concentration range of 1.0 ~ 5.0 μM and the detection limit for the method was 0.7 nM.
Table 1. Comparison of the present method with other previously reported methods for detection of heme
Analytical technique Linear ranges (μg·L-1) Detection limits (μg·L-1) Ref.
HPLC/DAD —— 15.97 [31]
TLC —— 12.0 [32]
FAAS 20.0–800.0 8.0 [33]
UV-vis 749.7–5997.8 46.9 [34]
FAAS 4.8–730.0 3.0 [35]
DPV 652.0-3260.0 0.46 (0.7 nM) This work
HPLC/DAD: High Performance Liquid Chromatography with Diode Array Detection; TLC: Thin Layer Chromatography; FAAS:Flame atomic absorbtion spectroscopy
[image:8.596.83.500.170.315.2] [image:8.596.48.562.545.649.2]
process is much faster than the previously reported methods, thus, the sample throughput is higher which can effectively reduce the operation cost.
Table 2. Analytical results of system accuracy test
Sample Spiked(μM) Found(μM) Average(μM) Recovery(%) RSD(%)
I 1.0 1.08 1.13 0.98 0.96 1.05 0.99 1.032 103.20 6.41
II 2.5 2.48 2.52 2.65 2.61 2.53 2.46 2.542 101.68 2.92
III 5.0 4.93 5.02 4.98 4.86 5.01 4.95 4.958 99.16 1.19
To demonstrate the selectivity of this electrochemical method to heme, three interfering compounds (bilirubin, Cys and glucose) were tested. As shown in Fig. 6B, compared to the control group, the three interferences showed no apparent change in the current, indicating that the presented electrochemical method showed extraordinary selectivity towards heme. Thisresult is acceptable since the Fc(COOH)2 substrate is specific to heme. To demonstrate the application of this assay, detections of heme in three samples were carried out. As shown in Table 2 the found contents of heme were close to the spiked values, and the spiked recoveries varied from 99.16 to 103.2 % with the relative standard deviation (RSD) below 6.41 %.
4. CONCLUSION
The electrochemical methods CV and DPV were used to study electrochemical behaviors of Fc(COOH)2 in different solutions and showed diffusion-controlled redox processes. After reaction with heme, the signal potential and current had obvious shift for Fc(COOH)2, especially the disappearing redox peaks in organic solvents. These results demonstrated that there was a molecular interaction between hydrogen bonds formed between Fc(COOH)2 and heme. Fc(OBt)2 didn’t show better redox peaks due to its poor solubility, as it cannot form hydrogen bond with heme. Furthermore, ferrocene dicarboxylate, as an electrochemical probe, can be used for heme detection with very low detection limits, as confirmed by differential pulse voltammetry.
ACKNOWLEDGEMENTS
We acknowledge the financial supports from the National Natural Science Foundation of China (No.61661014, 61301038, 61271119), the National Major Scientific Research Instruments Development Program (61627807), the Natural Science Foundation of Guangxi Province (2015GXNSFBA139041, 2013GXNSFAA019224), and National Undergraduate Training Programs for Innovation and Entrepreneurship (201510595044, 201510595207).
References
1. S. Maity, S. Chakraborty and A. Chakraborti, J. Mol. Struct., 1129 (2017) 256.
3. Y. Wang, Z. Zhu, H. Zhang, J. Chen, B. Tang and J. Cao, Mater. Chem. Phys., 182 (2016) 272. 4. G. Postnikova and E. Shekhovtsova, Biochemistry-Moscow+., 81 (2016) 1735.
5. D. Minai-Tehrani, S. Toofani, F. Yazdi, A. Minai-Tehrani, H. Mollasalehi and K. Ziabari, Int. J. Biol. Macromol., 94 (2017) 788.
6. M. Kvist, E. Ryabova, E. Nordlander and L. Bulow, J. Biol. Inorg. Chem., 12 (2007) 324. 7. M. Rahman, M. Won and Y. Shim, Biosens. Bioelectron., 21 (2005) 257.
8. K. Zhang, R. Cai, D. Chen and L. Mao, Anal. Chim. Acta., 413 (2000) 109.
9. J. Guo, S. Uppal, L. Easthon, T. Mueser and W. Griffith, Int. J. Mass Spectrom., 312 (2012) 70. 10. Q. Liu, J. Wu, J. Tian, C. Zhang, J. Gao, N. Latep, Y. Ge and W. Qin, Talanta., 97 (2012) 193. 11. Q. Xue, C. Bian, J. Tong, J. Sun, H. Zhang and S. Xia, Microchim. Acta., 176 (2012) 65. 12. I. Barman, N. Dingari, J. Kang, G. Horowitz, R. Dasari and M. Feld, Anal. Chem., 84 (2012)
2474.
13. L. Slocombe and I. Colditz, Res. Vet. Sci., 93 (2012) 190.
14. H. Wang, Z. Peng, Y. Long, H. Chen, Y. Yang, N. Li and F. Liu, Talanta., 94 (2012) 216. 15. E. Kim, S. Song, B. Lee and H. Yoon, Biochip J., 4 (2010) 16.
16. S. Deepthi, R. Trivedi, L. Giribabu, B. Sridhar, P. Sujitha and C. Kumar, J. Organomet. Chem., 774 (2014) 26.
17. H. Albada, P. Prochnow, S. Bobersky, J. Bandow and N. Metzler-Nolte, Chem. Sci., 5 (2014) 4453.
18. Y. Long, C. Li, T. Sutherland, M. Chahma, J. Lee and H. Kraatz, J. Am. Chem. Soc., 125 (2003) 8724.
19. C. Xu, H. Cai, P. He and Y. Fang, Chem. J. Chinese U., 22 (2001) 1492.
20. E. Matysiak, M. Donten, A. Kowalczyk, M. Bystrzejewski, I. Grudzinski and A. Nowicka, Biosens. Bioelectron., 64 (2015) 554.
21. S. Liu, U. Wollenberger, M. Katterle and F. Scheller, Sensor. Actuat B-Chem., 113 (2006) 623. 22. T. Tanaka, K. Izawa, M. Okochi, T. Lim, S. Watanabe, M. Harada and T. Matsunaga, Anal.
Chim. Acta., 638 (2009) 186.
23. G. Han, X. Feng, J. Liang, W. Xiao and Z. Chen, Spectrosc. Spect. Anal., 36 (2016) 1585. 24. G. Han, A. Ferranco, X. Feng, Z. Chen and H. Kraatz, Eur. J. Inorg. Chem., 31(2014) 5337. 25. H.Zhao, X. Zhu, Y. Shang, S. Chen, B. Li and Z. Bian, Rsc. Adv., 6 (2016) 34476.
26. A. Corry, A. Goel and P. Kenny, Inorg. Chim. Acta., 384 (2012) 293.
27. S. Djakovic, I. Kodrin, V. Smrecki, P. Novak, Z. Mihalic, D. Ziher, J. Lapic and V. Rapic, Tetrahedron., 70 (2014) 2330.
28. Z. Sun, Z. Li, Y. He, R. Shen, L. Deng, M. Yang, Y. Liang and Y. Zhang, J. Am. Chem. Soc., 135 (2013) 13379.
29. Y. Xu, P. Saweczko and H. Kraatz, J. Organomet. Chem., 637 (2001) 335. 30. L. Lu, Y. Dong, J. Wang, Q. Li and X. Wu, Anal. Methods-Uk., 7 (2015) 6686.
31. H. De Maere, E. De Mey, M. Baca, M. Sajewicz, H. Paelinck, I. Fraeye and T. Kowalska, Acta Chim. Slov., 61 (2014) 771.
32. H. De Maere, M. Jaros, M. Dziewiecka, E. De Mey, I. Fraeye, M. Sajewicz, H. Paelinck and T. Kowalska, J. Liq. Chromatogr. R T., 37 (2014) 2971.
33. S. Sedaghat, T. Shamspur, M. Mohamadi and A. Mostafavi, J. Sep. Sci., 38 (2015) 4286. 34. M. Lombardo, L. Araujo, A. Ciccarelli and A. Batlle, Anal. Biochem., 341 (2005) 199. 35. L. Farzin, M. Shamsipur and S. Sheibani, Microchim. Acta., 183 (2016) 2623.