I
I
Submitted for the Degree of
MASTERS OF APPLIED EPIDEMIOLOGY
NATIONAL CENTRE FOR EPIDEMIOLOGY AND POPULATION HEALTH AUSTRALIAN NATIONAL UNIVERSITY
CANBERRA By
David Francis Cheah
Ii
Acknowledgments
I would like to acknowledge the following people for contributing to my education in epidemiology :
Dr J Michael Lane Dr Robert Hall Dr Aileen Plant
Dr Mathew Gaughwin Prof. R Douglas
WHO Consultant, NCEPH.
Director, Communicable Diseases Section, Commonwealth Department of Health, Housing and Community Services.
NCEPH.
I I I '1 '1 : ,, I CONTENTS Introduction
Section 1 FIELD INVESTIGATIONS
Section 2 REPORTS PUBLISHED IN THE Communicable Diseases Intelligence Attachments :
*
*
* * * **
Tuberculosis Briefs 1 - Notification Rates
Tuberculosis Briefs 2 - An Analysis by Country of Birth
Staphylococcus Gastroenteritis Outbreak in Canberra following a church lunch.
Measles Outbreak in Canberra, Oct to Dec 1991.
TB Notification Rates in Australia : Final Data, 1986 - 1990.
An estimate of Measles Vaccine Efficacy in a Canberra Primary School.
Tuberculosis Notification Rates , Australia, 1991.
Section 3 PAPERS PRESENTED IN SCIENTIFIC MEETINGS Attachments :
*
*
*
Australian Tuberculosis Reporting System : Cases recorded in the Reference Laboratories , 1989 - 1991.
Measles Vaccination Efficacy in a Canberra High School : A study conducted following a measles outbreak.
Tuberculosis in Australia, 1986 - 1991 : An Analysis of Notification Data.
Section 4 SCIENTIFIC PAPERS SUBMITTED FOR PUBLICATION Attachments :
* *
*
Measles Vaccine Efficacy Study in a Canberra High School : A study following a measles outbreak.
The Effectiveness of Rubella Vaccine.
II
(I
I
I I
' I ,I I
l
I
I
II ~
I
II ,
Section 5 REVIEW OF A COMMUNICABLE DISEASE SURVEILLANCE SYSTEM Attachments :
*
* *
Mycobacterial Disease Database, Version 2, May 1991. ACT Notifiable Diseases Database.
The Australian Tuberculosis Reporting System.
Section 6 SUMMARY OF PRACTICAL EPIDEMIOLOGICAL EXPERIENCE GAINED
Section 7 ONGOING AND CURRENT PROJECTS Attachments :
*
*
*
Evaluation of outcomes of screening and management of M Tb for foreign born Australians.
Culture positive tuberculosis in Australia, 1989 - 1991. A Survey of M Bevis in Australia, 1982 - 1991 .
Section 8 MISCELLANEOUS ACTIVITIES/REPORTS Attachments : ,
* * *
*
*
Controlling Tuberculosis in Australia. A report by the TB Panel , NHMRC .
WHO, Tuberculosis Control Programme . NTCP Database. Proforma for Mutual Assistance Programme : Australia. Questionnaire on Anti Tuberculosis Drug Supply.
I)
I
I
I
,
1.1
R
Ill
INTRODUCTION
I spent my placement for the Masters of Applied Epidemiology at the Communicable Diseases Section, within the Commonwealth Department of Health, l I Housing and Community Services, located in Woden, ACT. The functions of the '
ii
' Ii
I
1,
I
ll:
II
II
I~
I
II
1,
I
I
1
SECTION 1 FIELD INVESTIGATIONS
During the course of the MAE programme, I was involved in several field investigations, including the following :
1
2
Measles Outbreak in Canberra, October to December 1991
In late September, 1991, an increase in measles notification to the ACT Board of Health, led us to suspect that a measles outbreak was apparent in the ACT. Based on the source of these notifications, I began to investigate this outbreak. This investigation subsequently led to an article in COi, and a further investigations into the vaccine effectiveness of measles in a high school (see Section 2).
Gastroenteritis outbreak in Canberra, January 1992
On the evening of 18th January, 1992, I was informed that four guests who had attended a wedding party that afternoon, visited the Calvary Hospital, suffering from gastroenteritis. I suspected an outbreak and began an investigation which later resulted in a report to the COi (see Section 2).
3 Measles vaccine efficacy study in Orana Primary School, Canberra,
March to April 1992
i
i
I I
I
,l
,i
I
Ii,
I
Ii
1,
2
proportion of the children here are not immunised because of personal beliefs of the parents. Since the outbreak was over at the time of the reports, an opportunity existed for a vaccine effectiveness study. This study targeted the effectiveness of measles vaccine in the 10 - 14 year age group. This study was conducted with certain restrictions placed on the study design. A report was subsequently published in the COi (see Section 2).
4 Measles vaccine efficacy study in Lyneham High School, Canberra,
February to June 1992
A cohort study was performed in Lyneham High School, Canberra, in the first semester of 1992, to study the effectiveness of measles vaccine. This study targeted the 15 - 19 agegroup in relation to measles vaccine effectiveness. This school had the highest attack rate for measles during the 1991 outbreak. A paper describing our findings was subsequently sent to the
Journal of Paediatrics and Child Health for consideration for publishing (see
Section 4).
5 Rubella Outbreak in Canberra, September 1992
LI
I
I
,'
J
I
l
I
I~
I. i
I
II,
I
r
i
Ill
I
..
i ·
I 1,
I I
I
I
I
l't I I
I
I
Ii
II I
I
I
I
6
3
of a larger outbreak of rubella in the ACT.
Rubella vaccine efficacy in Lake Ginninderra College, Canberra,
November to December 1992
"
I
,,
:j
I
I: I
1,
!
I '
I
II! I
ii
: I
h
SECTION 2
1
l
'
,l
I
I
I I
1,
I
II
.
'I
la
I
~
la
I
"
•
I
11
II
'
SECTION 2 REPORTS PUBLISHED IN THE Communicable Diseases Intelligence Bulletin
The various field investigations that I performed resulted in several reports to the
Communicable Diseases Intelligence Bulletin. Other reports came from analyses of
previously available Tuberculosis Statistics, new data from the States and
Territories Health Departments, and data derived from the new system of TB
surveillance (see Section 5). The articles published in CD/, and the dates of
publication are detailed below and are attached to this Section.
1 Tuberculosis Briefs 1 - Notification rates. Published on 21st September
1991.
2 Tuberculosis Briefs 2 - An Analysis by Country of Birth. Published on 2nd
December 1991.
3 Staphylococcus Gastroenteritis Outbreak in Canberra following a church
lunch. Published on 24th February 1992.
4 Measles Outbreak in Canberra, Oct to Dec 1991. Published on 23rd March
1992.
5
6
TB Notification Rates in Australia : Final Data, 1986 - 1990. Published on 1st
June 1992.
An estimate of Measles Vaccine Efficacy in a Canberra Primary School.
Published on 13th July 1992.
7 Tuberculosis Notification Rates, Australia, 1991. Published on 21st
I I
I
I~
I
' I I
!
I
'I
I
I
I
I.
/ , I
I
I
lo I
Ii
11
1
TUBERCULOSIS BRIEFS 1 - NOTIFICATION RATES
(Dr David Cheah, NCEPH Epidemiology Registrar, Communicable Diseases Section, Department of Health, Housing and Community Services, Canberra, ACT )
This is the first of a series of reports on tuberculosis (TB) in Australia, based on data collected recently from all States and Territories.
Introduction
Data on the epidemiological aspects of tuberculosis have not been published by the Commonwealth Department of Health, Housing and Community Services since 1985. Medical authorities involved with the treatment and supervision of tuberculosis patients at the state level have requested the analysis and publication of such data. Attempts in the recent past to analyse available data had limited success because of problems with the reliability of the data, and the inconsistent nature of the reporting.
I
l'
1 ,j I I~ I, I I I I I I I I I C :1 ,. ' I. II,,
1, ! 111 I I I· I !I I! 2 imperative if the impact of HIV/AIDS on the tuberculosis rates is to be estimated. This report on the notification rates, post 1985, differentiates between the different categories of notifiable cases.We used a series of forms modified from the previously used TB reporting forms to elicit information from the States and Territories, to obtain data consistent with the new Surveillance system currently used in every State and Territory.
Definitions used.
In this analysis, the case definitions used are : 1 New Cases (Tuberculosis)
2
(a) A case of tuberculosis which has been confirmed by the identification of Mvcobacterium tuberculosis by culture or by microscopy. Infectious agents are usually Mvcobacterium tuberculosis and M. africanum primarily from humans and M. bovis (not including BCG - bovis) primarily form cattle.
(b) A case of Tb which has been diagnosed by a clinician to be active clinically and which has been accepted, as such, by the State or Territory Director of TB.
Relapses (Reactivation)
liri
I
'
'
[
i
I
'
I
I
I
,'
I
I
3
3
Atypical Mycobacterial Infection
An active case is one where one or more of the following features are present :
- there are clinical features consistent with one or more of the syndromes associated with atypical mycobacteria.
- there is a compatible disease process which is clinically, radiologically, and/or pathologically not due to other causes.
- there is consistent repeated recovery of the same organism from the same site in moderate to abundant amounts.
- there is recovery of atypical mycobacterium from sites which are normally sterile.
4 Population
The number of persons living in an area at mid year (supplied by the Australian Bureau of Statistics).
5 Tuberculosis Deaths
Deaths from tuberculosis (all forms ie including atypical and relapses) reported by a clinician during the year, including deaths due to, and incidental to, the disease.
Results
I
I
I
I
I
'
1
I•
t
'
!
I
I
jl '
I
I
4
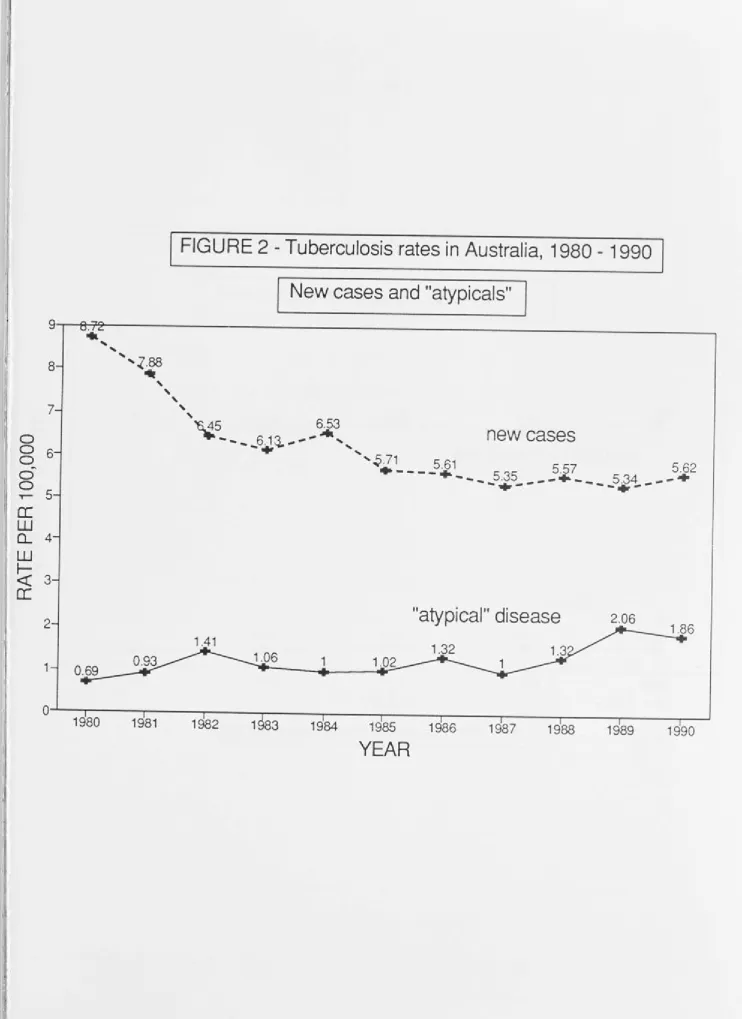
(Figure 1 ). Since 1987 there has been a slight upward trend from 6.3 to 7.5 per 100,000. For 1989 and 1990 NSW data are unavailable and denominators have been adjusted accordingly. The rate of notified new cases of TB has been fairly constant at between 5. 71 and 5.34 per 100,000 over the last five years but there Ii has been an upward trend in "atypical" disease over the same period (Figure 2).
The infected population (comprising new cases and relapses) has remained fairly constant between 5.59 and 5.89 per 100,000 since 1986, and the crude death rate has increased from 0.32 to 0.53 per 100,000 over the same period (Figure 3). Numbers of new cases, "atypical" cases, new and relapsing cases and deaths since 1986 are shown in the Table.
New cases, atypicals, new cases+relapses and deaths, 1986 - 1990.
New cases "Atypicals
New+Relapses Deaths
1986 1987 1988 1989 1990
899 870 922 591 633 21 2 1 63 21 8 228 209 944 909 951 626 663
51 68 60 35 35
I
Cl
,,
I
I
11 I I
I
I
I 'I
I 1
I
I,
I
5
Discussion
The incidence of new tuberculosis cases in Australia has not increased in recent years. This is in contrast with the United States, which has an increasing rate since 1986, attributed to HIV disease (1 ). In Australia, closer analysis of the data may be necessary to detect any relationship between the HIV epidemic and TB notifications. The rate of reported atypical disease has increased significantly since 1985. Future reports on tuberculosis from the COi will include analysis of atypical disease, patterns of disease, age groups, and country of birth of reported cases.
References
1 Barnes PF, Bloch AB, Davidson PT, Snider DE. Tuberculosis in patients with Human lmmunodefiency Virus Infection. The New England Journal of Medicine. 1991 ;324:1644-1650.
2 Commonwealth Department of Health. Tuberculosis Statistics, 1980-1985.
I
I 1
0 0 0
"'
0 0
.,....
a:
w
Q_
w
r-<t:
[image:17.793.30.744.56.1079.2]a:
FIGURE 1 - Tuberculosis rates in Australia, 1948 - 90.
Notification for all forms*
*
includes "atypicals" but excludes relapses
4.93 1 .7
11 .~1.411 .910 10.7
.5g.9 10 8 g g 1 10 9.3
---..---....;::,;,:·:...::.;;,,· 8.4 7.5 7.8
I
I
I
[image:18.793.19.762.49.1069.2]I
FIGURE 2 - Tuberculosis rates in Australia, 1980 - 1990
New cases and "atypicals"
9 - - ~ 9 - - - .
..
8 7 0
8
6-0
I ~ 5
a:
w
' 0... 4
, W
I-<( 3
a:
2
1
'
'
',z.88
._
'
' '
'
''6..45 6.53 -...__
--.-....
6.1~ - - - • ,',
1
new cases
'~.71 5.61 5 57 5 62
·----+
... 535 .--·--
. 534 .__
...
+
-... --
--+-"atypical" disease
2.060 - ' - - - - , - - - , - - - , - - - ~ - - - - . - - ~ - - - - . - - - - ~ - - - . . - - - , . - - - - 1
1980 1981 1982 1 83 1984 1985 1986 1987 1988 1989 1990
I J. I 1 I, ,1
~.
I I Il
'; I I I I I, 11 I a : I•I\ I
i I
I
I
I
..
I I
11 ,.i I I 8
7-0 6-0 0
"'
0 5-0
-r-a:
4-w
0..
w
3-
r-<(
a:
2-
[image:19.793.21.755.64.1051.2]1-0
FIGURE 3 - Tuberculosis rates in Australia, 1986 - 90.
New cases
&
relapses, and deaths
5~9 5.75 5.89
5J6
5.59 a
•
•
new cases
+ relapses
deaths
0.54 0.53
0.32 0.42 0.49
+
+
+
+
•
I I
I I
I
1986 1987 1988 1989
1990
YEARS
,, ·: :I j, II I I 'Ill I/ '·1 I I I , I I f '
.
' I' I I, ! a, I• 'r,, :
.. I
I
1
TUBERCULOSIS BRIEFS 2 - AN ANALYSIS BY COUNTRY OF BIRTH
Introduction
Since 1985, the rate of notification of new cases of tuberculosis (TB) in Australia has been almost static, ranging between 5.34 and 5.71 per 100,000 population per year. The notification rates are not, however, equal in all parts of the community, as the disease is more significant in some groups than in others. The ageing of the Australian population, its changing pattern of ethnicity and the emergence of the problems of acquired immunodeficiency syndrome are some reasons why TB will remain an important disease for years to come. This article analyses the country of birth of reported cases from 1986 to 1990 for new cases of tuberculosis.
Method
The method of obtaining data was described in the first article in this series (1 ). Countries of birth chosen for analysis were those which, in 1985, had high rates in the migrant populations and those from which Australia had accepted refugees or immigrants. Notification rates were calculated for nineteen migrant groups from Asia and Europe. Denominator population by country of birth were obtained from the Australian Bureau of Statistics.
Results
A comparison of the rate of notification of tuberculosis in Australia between 1986 and 1990 by birthplace ("Australian" born or "Foreign" born) shows that the rate in Australian born persons declined from 2.82 to 2.15 per 100,000 per year between
l
i
I
I
I
~.,
1, i I, i I I ' II Ill ' ,, lo Ii I ~ 11 I I I 11 .I 2 1986 and 1990 (Figure 1 ). The rate for foreign born cases was much higher andfluctuated between 15.69 (1987) and 17.99 (1990) per 100,000. For Australia as a
whole, the proportion of cases in Australian born persons declined, from 39.4o/o in
1986 to 34.5°/o in 1990. The proportion in foreign born persons increased from
60.3°/o in 1986 to 70.4°/o in 1990 (Table).
Table - Place of birth for cases of tuberculosis in Australia, 1986 - 1990.
Year 1986 1987 1988 1989 1990
Australian born
Cases 356 350 329 312 284 0
/o Total
39.4
38.8
34.9
34.4
28.8
Foreign born
Cases 545 547 613 591 693 0
/o Total
60.3 60.6 65.1 65.1 70.4 Unknown Cases 3 5 0 5 8 0
/o Total
0.3
0.6
0
0.5
0.8
In NSW, Victoria, South Australia and Western Australia, the majority of cases has
been in foreign born persons during this period and the tendency was towards
increased numbers of reports in foreign born persons (Figure 2). In the Northern
Territory, the percentage of Australian born cases increased from 61.5°/o in 1986 to
83.3°/o in 1990. This can be attributed to the increased in new cases in Aboriginal
Australians during those years (unpublished data, NT Department of Health and
Community Services). In the ACT, in 1986 1 OOo/o of cases were foreign born, declining
'
I
: :1l
II I ' I1 I
I I ' I .,1 11 I : I I II Ii .1 I
.
, , I
I
3 to 50°/o in 1990. In Queensland, there was a trend toward increased notifications amongst foreign born persons. The small number of cases in Tasmania and the incompleteness of their place of birth data prevents detailed analysis for that State. The 1986 - 88 average rates of notifications determined for population groups according to country of birth showed that the rate in Australian born persons was lower than the rates for all of the other groups, except those born in Lebanon (Figure 3). The highest rates were in persons born in Vietnam, Philippines, Cambodia, China and Laos.
Discussion
Caution should be exercised in the interpretation of these data. First, although the rates of notification from some migrant groups are large, the total populations of these groups are often small. Second, the high rates in some migrant groups do not seem to have posed an increased risk for the general community, as the rate for Australian born cases declined over the five year period. This suggests that infection of Australian born persons by overseas born cases does not occur to a significant extent.
Unfortunately, the data available for analysis in this report do not include the time elapsed between arrival in Australia and the notification of the disease. However, in NSW, in 1986, only 11 °/o of reported cases of tuberculosis in persons born overseas had been resident in Australia for less than one year (2). In the Northern Territory in 1990, the mean length of time for notification of new cases for persons born overseas was 7.5 years (unpublished data, NT Department of Health and Community Services). The national TB surveillance system has recently been enhanced to enable analysis of time elapsed from arrival to notification in future years .
!
I
I j
I
I
I
'
1
I
~
.
I
:
I! I
'
I:
I
I
I .
I
I
I
I
I
,,
'
I
I
I
I
I
I
I
4
References
1 Tuberculosis Briefs 1 - Notification Rates. Comm Dis lnte/11991 ;15267-269.
2
3
Plant AJ, Rushworth RL, Wang Q, Thomas M. Tuberculosis in NSW. Med J Aust
1991 ;154:86-89.
Orr PH, Manfreda J, Hersfield ES. Tuberculosis surveillance in immigrants to
l
I
I
:l I
,I
Ka '
;, I 11 I I I I ' I I I I
Rgure 1 - Tuberculosis rates
in Australia, 1986-1990
:1It
"Australian born" and "Foreign born"
,I· 25 I I I; I
20-I
FOREIGN BORN
I
I
0
i
0
-0
I
I
~
-0 15-I 0
~ I
a:
J
w
I' 0....
w
I
t-<J::
a:
5-
I
AUSTRALIAN BORN
I
1!
0
,,, I
I I
I I
1986 1987
1988 1989 1990
ir
YEAR
1j ii I
(
,1, I I I I 'I: t 1'I
I
l':
!\ !
I
I
'
' I I
(/)
z
0
-
r-<r=
0
-LL
-
r-0
z
.
0
z
350
300
250
200
150
100
50
0-+---NSW
I
TUBERCULOSIS NOTIFICATION,
19861
VIC
By
State/Territory and place of birth
-
UNKNOWNE:~;:::::iiJ
AUST. EORN 111111
FOREIGN BORN
OLD SA WA TAS NT ACT
I
I
'
'
Cf)
z
0
-
f-<l::
(.)-LL
-
f-0
z
.
0
z
350
300
250
200
150
100
50
o
-NSW
I
TUBERCULOSIS NOTIFICATION,
19871
By
State/Territory and place of birth
VIC OLD SA WA TAS
ST ATE/TERRITORY
-
UNKNOWNE:=:::;:::J
AUST. BORN
11111
FOREIGN BORN
(f)
z
0
-
r-<{
()
-u.
-
r-0
z
.
0
z
I 1
350
300
250
200
150
100
50
0-+----NSW
I
TUBERCULOSIS NOTIFICATION,
19881
VIC
By State/f erritory and place of birth
-
UNKNOWN[EJ
AUST. BORN 1111
FOREIGN BORN
OLD SA WA TAS NT ACT
350
Cf) 300
z
0
250
-
I-<!:
()
LL 200
-
I-0
z
.
1500
z
100
50
0-+----NSW
I
TUBERCULOSIS NOTIFICATION,
19891
By
Staterrerritory and place of birth
VIC OLD SA WA TAS
ST ATE!rERRITORY
-
UNKNOWNm
AUST. OORN
1111
FOREIGN BORN
350
(j) 300
z
0
250
~
()
-LJ.. 200
-
r-0
z
150.
0
z
100
50
0 +
-NSW
I
TUBERCULOSIS NOTIFICATION, 1990
I
VI C
By
State/Territory and place of birth
-
UNKNOWNE===========J
AUST. BORN
11111
FOREIGN BORN
.•.• .. •, .. • .... ,•.•:•,•:•.•,,•
OLD SA WA TAS NT ACT
,·
Figure 3 - Rate of tuberculosis in Australia by country of birth, 1986-88 avarage
YUGOSLAVIA UK/IRELAND POLAND ITALY GREECE GERMANY VIETNAM
>-
TURKEYa:
SRI LANKAr-'
z
PHILIPPINES:::>
MALAYSIA
0
0 LEBANON
LAOS CAMBODIA INDONESIA INDIA HONGKONG AUSTRALIA
- r - - - . - - - ~ - - - . - - - . - ---....,...---r----...---~
0 20 40 60 80 100 120 140 160
I~
I
i
1
Ii ,
STAPHYLOCOCCUS GASTROENTERITIS OUTBREAK IN CANBERRA
FOLLOWING A CHURCH LUNCH.
fa,
11
I
I
I,
I
I'
I
I
11 I
'
( David Cheah, Epidemiology Registrar, Communicable Diseases Section, Commonwealth Department of Health, Housing and Community Services, Peter Kong and Simon Ng, Environmental Health Officers, Public and Environmental Health Service, ACT Board of Health.)
INTRODUCTION
An outbreak of gastroenteritis occurred in Canberra over the weekend of 18th and 19th, January 1992, following a church lunch for a Chinese wedding. Four guests of the wedding who attended the casualty of a local hospital alerted authorities to the outbreak. The investigation commenced on the night of the suspected outbreak. Public health action taken on the evening of the 18th included contacting
1 the wedding organisers to obtain a list of guests for subsequent follow up, warning
guests with leftover foods to avoid eating them, and identifying food samples for analysis.
METHODS
I
I
I
It
l:
II
ii
2 RESULTS
All of the 52 guests who attended the wedding were contacted, with 50 being
contacted within forty eight hours following the outbreak. Investigations
commenced within six hours of the wedding dinner. Predominant symptoms in the
16 guests who developed gastroenteritis were diarrhoea (87.5 o/o), vomiting
(87.5%), abdominal cramps (43.8°/o) and nausea (18. 7°/o). There were no
secondary cases.
Time
i\ Figure 1 presents the outbreak curve. The mean incubation period was 3.4 hours
;
l
I
I
,,
I i
''
following the consumption of food provided at the party. The mean duration of
symptoms was 14.9 hours. Most of the cases were well by the next day. All the
cases returned to normal activities by Monday 20/01 /92. We excluded three guests
from analysis. One girl had gastroenteritis concurrently , one was taking
Erythromycin for tonsillitis, and one was a vegetarian who did not eat food at the
function.
Place
The wedding reception took place in a church in the northern suburbs of Canberra.
Volunteers from members of the church cooked various dishes in their home
kitchens. At least two cooks were involved in the food preparation. Food items
presented for consumption included spring rolls, curry pastries, gelatinous nee,
noodles, sweets, drumsticks, sushi, ham and cheese sandwiches, and egg
\
j
'
'
'
lo '
'
I
I,
ll
I
:ri
l
I I
~f
I'.
.,
1,
3 were cooked on the morning of the party. They were left in the open overnight as there was insufficient room in the refrigerator for storage. The egg sandwiches were prepared on the morning of the party. Both noodles and egg sandwiches were carried to the church in cars, unrefrigerated, and allowed to stand at room temperature for several hours in the church before consumption.
Person
16 guests (32.7o/o) were affected with symptoms of gastroenteritis within a few hours of the party. Both males and females were affected equally ( M:F ratio
=
1 :1 ). The guests were mainly members of the Chinese community of middle to upper class background.50°/o
of those who were affected needed medical attention, either in the casualty of the local hospital or by general practitioner attendance.Analysis of the food histories
1
'I
.
I , II
' i
,I
I'
I·
I
~·
j: II'.
lr
I:
'11 I ' 1f.,
1L
1,
I'
I' '
IJ
4
Table 1 - Food Specific Attack Rates among 49 guests at a Wedding Party, Canberra, 1992.
Food Items No. who ate No. ill Attack Rate
Spring roll
40
10
25°/oCurry pastries
43
13
30.2 o/oGelatinous rice
36
12
33.3 °/oNoodles
42
16
38.1
%Sweets
32
10
31.2 °/oDrumstick
37
12
32 .4 °/oSushi
37
15
40 .5 °/oHam/Cheese
Sandwich
14
4
26.6°/oEgg sandwich
17
7
41.2 °/oTotal
49
16
32.7 °/o [image:34.809.18.746.81.779.2]I
I!
•j
.,
I IJ
i
' I
'
l
I
'
I·
.
I 1,
5 Microbiological results
The ACT Government Analytical Laboratory isolated Staphylococcus aureus from the noodle in significant amounts
(4 x 10⁷ ), and Bacillus cereus in smaller amounts (3.2 x 10³ ). The significance of
the B Cereus is not certain; the amount may be insufficient to cause an outbreak. A swab from the nostril of the cook who prepared the noodle dish, taken three days after the outbreak, grew Staphylococcus aureus. Phage typing of the organism is currently under way from both these isolates. Swabs taken from the two students who made the egg sandwiches did not yield Staphylococcus aureus or enteric pathogens. Stool samples collected from 8 cases nearly 72 hours following the outbreak were negative for Staphylococcus aureus or Bacillus cereus. No organisms were isolated from these samples.
Food Handling
The kitchen of the cook who prepared the noodle dish and the egg sandwiches was visited by Environmental Health Officers from the Public Health Branch of the ACT Board of Health on 21 /1 /92 and 30/1 /92. The kitchens were physically clean but the method of food handling, storage and transportation to the church on the day of the outbreak were questionable. The practice of handling boiled noodles with bare fingers and leaving them unrefrigerated overnight was thought to be the factor contributing to the contamination and colonisation of Staphylococcus aureus . This was further compounded by carrying the cooked noodles in a car to the
,i church and allowing it to stand at room temperature in the hall for several hours
jl
,, before consumption. Similar practices were noted for the egg sandwiches. The
l
!l
.r..
'
II.
I,
1·:
l
I
.
I
I
j:
I ,
a.
ij
:
I
i
6
ambient temperature on the day of the outbreak was 26 degree Celsius which is an ideal temperature for bacterial growth. Examination of the food handlers did not reveal any infected lesions on their hands.
DISCUSSION
I
'I
I
l
l
J
I
Ii
'
I,
I
f
7
Acknowledgments:
The following persons and organisations are acknowledged for their help in the investigation:
Dr Robert Scott, Chief Health Officer, ACT Board of Health.
Mr Alec Percival, Director, Public and Environmental Health Service, Public Health Branch, ACT Board of Health.
Ms Gay Priest, Barry Morans Pathology, Canberra
8
REFERENCES
1 Anon. Suspected Bacillus Cereus food poisoning outbreak. Communicable
Diseases Intelligence. 1990 9 :4-5
2 Mandell G L, Douglas R D, Bennett J E. (Ed) Principles and Practice of
Infectious Diseases. 3rd Ed. Churchill Livingstone. New York.1990.
3 Levine W C, Smart J F, Archer D L, Bean N H, Tauxe R V. Foodborne disease outbreaks in Nursing Homes, 1975 through 1987. 1991.
Journal of the American Medical Association. 15;2105-2109.
(.f)
w
(.f)
<(
0
LL
0
a:
w en 2 ::)
z
s ~ - - - .
Figure 1 - Time of Onset in 16 patients who developed
gastroenteritis following a wedding party, Canberra, 1992
4
2
1
0.5 1 1.5 2 2.5 3 3.5 4 4.5 5 5.5 6
[image:39.809.27.791.67.1044.2]I
I
I
1
I
II
•
I
I
I':
1
MEASLES OUTBREAK IN CANBERRA - OCT TO DEC 1991
(Dr David Cheah, Epidemiology Registrar, Communicable Diseases Section, Commonwealth Department of Health, Housing and Community Services, Dr R Scott, Chief Health Officer, ACT Board of Health and Ms Irene Passaris, Communicable and Environmental Disease Control Section, ACT Board of Health)
Introduction
An outbreak of 82 cases of measles occurred in Canberra from late October 1991 to January 1992. An increase in the average of reported cases by medical practitioners, led to a field investigation. In November, 11 cases were reported whilst in December, 14 cases were reported, although measles is not a notifiable disease in the ACT. On 24 November, once the outbreak was confirmed, a media release was issued by the Chief Health Officer, asking parents to check the immunisation status of their children, and to have them vaccinated if necessary. Principals of all the affected schools received a fact sheet when more schools were affected. A recent outbreak of rubella had occurred in Canberra schools, so case definitions for this outbreak were meticulously used to exclude possible cases of rubella.
Methods
I~
I '
I .
1,
I
I
! '
I
l
I.
r
I:
I
~I
I
!
~f '
2 derived from the Canadian Communicable Disease Surveillance System (1) :
- a "confirmed" case was one with detection of measles specific antibody in the serum.
- all "clinical" cases had to have : fever greater than 38.3 degrees Celsius, cough, coryza or conjunctivitis, followed by a generalised maculopapular rash for at least three days.
- "confirmed" cases must be linked to other cases in cluster outbreaks.
We sought to identify all the cases in the outbreak by active case finding. We identified contacts of reported cases, contacted general practitioners in suburbs where cases occurred, interviewed principals of primary and secondary schools of cases, interviewed cases or their families who reported. The media release of November 24th advised new cases to contact the Communicable and Environmental Disease Control Section of the ACT Board of Health. We questioned students and their parents about their immunisation history. We accepted their history without further documentation through medical records. Considerably publicity about school immunisation records made us feel that most families knew their immunisation status.
Results
•
1,
I
l
I i
ll
I
1,
I
3 five cases had blood taken for analysis, but the sera were lost or found to be inadequate. The male to female ratio was 1.28 : 1.
The outbreak curve is presented in Figure 1. The outbreak occurred over October to the end of December 1991, when case ascertainment ceased. Eight cases occurred in October, fifty in November, and twenty four in December. Approximately four generations of transmission of the disease seem apparent in the outbreak curve. The number of cases peaked over late November and early December, and declined over December. The school holidays provided a natural break to the transmission of the disease. Sporadic cases continued to occur over the school holidays, with seven cases reported in January 1992.
111 JOI !I Ii I
•
1111 ' :j!
! ·., u. 4Table 1- Measles Attack rates by Grade in one Canberra High School,
Oct-Dec, 1991
Grade
Grade 7 Grade 8 Grade 9 Grade 10
Total
No cases (0
/o)
3 (13)
8 (34.8)
9 (39.1) 3 (13)
23 (100)
Population Attack Rate/1000
194 15
207
208
209
818 3943
28
28
We could not identify a definite index case. The first few cases occurred in a primary school, two weeks after a school camp. The missing index case probably infected the initial cases in this school. The first few secondary school cases occurred in three schools within three days of each other, in early November . Secondary spread from primary to secondary schools, and to other schools presumably occurred through family clusters with children in multiple schools.
Thirty nine cases (47°/o) belonged to fifteen family clusters. Four families had virologically confirmed cases within the family. Each family had the clinical diagnosis made by their family physicians in at least one member of their family. Three suburbs in Canberra, where the high schools were located, accounted for
43°/o
of cases.'
II
1·
5 predominate in the fifteen to nineteen age group (80°/o). Overall, males (56°/o) accounted for more cases than females (44°/o). In the under ten age group, male and female cases were roughly equal.
Symptoms derived from the case definition are listed in Table 2. The disease was diagnosed mainly by general practitioners on clinical grounds alone (65°/o), and in six cases by the parents of the affected children {7°/o). Four of these children belong to one family cluster; the other two were contacts of cases in a high school (LH). 39o/o of all cases gave a history of previous vaccination as compared with 55°/o of all confirmed cases (see Table 3). Three cases were hospitalised due to complication of the disease, one with pneumonia, one with asthma and one with dehydration. A further three cases were referred to a hospital for treatment but were not hospitalised. In those cases who had the disease before the onset of !, school holidays, an average of seven days was lost from school attendance.
47.6°/o of the cases were given antibiotics by their general practitioners.
I
h
1:
I
II
r
IIf!;.
i:
Table 2 - Symptoms of the 82 affected children in the measles outbreak,
Canberra, Oct-Dec 1991.
Symptoms Number of cases Percent
Fever 80 97.6
Cough 79 96.3
Runny nose 57 69.5
Conjunctivitis 54 65.9
,, I I! Ii II 1, 11 '
•
1, Ill i i I,I I
I·
'
6
Table 3 - Vaccination status of the 82 affected children in the measles
outbreak, by sex, Canberra, Oct-Dec 1991. (percentage in brackets)
Sex
Males Females
Total
Discussion
Vaccination Status Vaccinated Not vaccinated
17 (37) 15 (42)
32 (39)
29 (63) 18 (50)
47 (57)
Unknown
0 3 (8)
3 (4)
Total
46
36
82
'. '
I
Ill
I
,,
11
I
I~
I~
_l
1
7 prompt investigation of outbreaks and control activities. This should not be delayed whilst awaiting for serological confirmation.
2 revaccination program for susceptible, those without documentation, and for those who are uncertain of their vaccination status.
3 persons who have been exempted from measles vaccination for medical, religious or other reasons are to be excluded from the outbreak area until at least two weeks after the onset of rash in the last case of measles.
4 consideration for a revaccination program in unaffected schools that may be at risk of measles transmission.
5 for those with contraindications to the measles vaccine, consideration should be given for passive immunisation with immunoglobulin, at 0.25ml/kg body weight.
In Australia, as in the United States , a resurgence of measles is taking place. Outbreaks of measles should be meticulously investigated so as to provide data for making immunisation policy. In this outbreak, as in the United States, almost half of all the cases occurred in unvaccinated children. This probably indicates that there is high vaccine coverage in those school population (9). Measles, a vaccine preventable disease , still causes significant morbidity among affluent groups in Australia. A two dose vaccination program is currently being considered by the National Health and Medical Research Council.
8 Acknowledgments:
The authors of this article would like to acknowledge the help provided by the following people and organisations :
The ACT Education Department, ACT.
The Mr Ray Gunn, Principal, Lyneham High School. General Practitioners of the ACT.
J
If
'
I
I
I
'
1,
11
:,
11
I
i
;:
:, '
II!;
.· .
I
9 References
1
2
Canadian Communicable Disease Surveillance System. Disease Specific Case Definitions and Surveillance Methods. Vol 1753. 1991.
Scott R J, Passaris
I.
Measles notifications received in the ACT - January to October 1990. Communicable Diseases Intelligence. 1990 25;8-9.3 Taylor L Catching a measles outbreak. NSW Public Health Bulletin. 1991 7;65-69
4
5
Weinstein P, Carrangis J. Measles resurgence in South Australia. Communicable Diseases Intelligence. 1991 15;312-313.
Gill J, Marshall L. Measles outbreak in Collie, Western Australia. Communicable Diseases Intelligence. 1991. 15;150-151.
6 The National Vaccine Advisory Committee. The Measles Epidemic. Journal of the American Medical Association. 1991. 266;1547-1552.
1
Ii
II
II
'
1
1,
I [
I!
I
m
'
,I
I
IC
I
II
10 8 Centers for Disease Control. Update on Adult Immunisation
recommendations of the Immunisation Practices Advisory Committee (ACIP) MMWR 1991 ;40(no. RR-12)
Figure 1 - Measles Outbreak, Canberra, October - December, 1991
82 Cases by Date of Onset of Symptoms
? ' - . - - - ,
(f)
Q) ~ 4 0
-
0
"'-Q)
.0
E
:::>
z
oc , 1992
Figure
2 -
Measles Outbreak, Canberra, October - December, 1991
82
cases by Age and Sex
5
46 4
4
3
Cf)
3
Q.)
Cf)
cu 25
u
2.
0 2
z
1
1
5 0
0-4 5-9 10 - 14 15 - 19 TOTAL
Age
l
I
111
I!
I
i
I
I
I
I
,r,
i.1
!
lo
I
I
,1
'
·'
I,
Ii
I
1
TB NOTIFICATION RATES IN AUSTRALIA: FINAL DATA, 1986 - 1990
(Dr David Cheah, Epidemiology Registrar, Communicable Diseases Section, Commonwealth Department of Health, Housing and Community Services, Woden, ACT.)
INTRODUCTION
In August 1991, the Communicable Diseases Intelligence reported the rates of notification of Tuberculosis (Tb) in Australia between 1986 and 1990. That report excluded data from NSW as these were not available at the time of analysis. This article describes the true rates of notification for those years following the availability of data from NSW.
METHODS
I Ii ' . I
r
I 1.1 " II 11I
"
I
'I
L
I
IJ
2 RESULTS
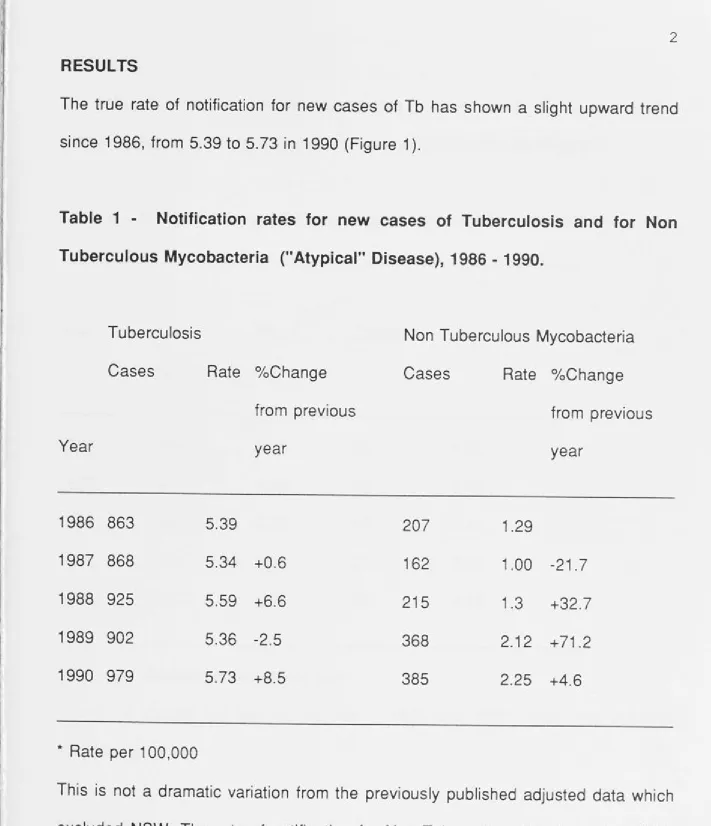
The true rate of notification for new cases of Tb has shown a _ slight upward trend since 1986, from 5.39 to 5. 73 in 1990 (Figure 1 ).
Table 1 - Notification rates for new cases of Tuberculosis and for Non Tuberculous Mycobacteria ("Atypical" Disease), 1986 - 1990.
Year 1986 1987 1988 1989 1990 Tuberculosis Cases 863 868 925 902 979
* Rate per 100,000
Rate 0
/oChange from previous year
5.39
5.34 +0.6 5.59 +6.6 5.36 -2.5 5.73 +8.5
Non Tuberculous Mycobacteria Cases 207 162 215 368 385
Rate 0
/oChange from previous year
1.29
1.00 -21.7 1.3 +32.7 2.12 +71.2 2.25 +4.6
[image:53.809.25.736.60.886.2]I
3 disease.
The rate of notification of new cases plus relapse cases of Tb and deaths remained largely unchanged from the previously published data (Figure 2).
Table 2 - Notification rates for new cases plus relapses and deaths
Year
1986 1987 1988 1989 1990
No Cases
906 907 954 952 1016
Rate*
5.65 5.58 5.77 5.66 5.95
* Rate per 100,000 population per year
Deaths
52 68 60 52* 56*
Rate*
0.32 0.42 0.49 0.42 0.45
* Data on deaths not kept in Vic, Act in 1989 and 1990, death rate adjusted accordingly.
DISCUSSION
4
following collection. For example, there is no consistent case definition for non tuberculous mycobacteria, hence the reported data may not represent the true rates for the spectrum of disease. Data on infections due to Mycobacterium Bovis-BCG are not routinely collected in some States. However, these problems of under representation are encountered in other national data collection systems too and are not unique to Tuberculosis.
The percentage change of cases, when compared with the previous year, needs to be interpreted with caution. This is a sensitive indicator. In Australia, with the relatively small numbers reported, small changes in reported numbers result in large percentage changes. In the United States, where there are large numbers reported, a small percentage change would indicate a large number of cases.
The rate of notified new cases of Tb has been fairly constant at between 5. 73 and 5.34 per 100,000 over the last five years , despite yearly fluctuations, when compared with the United States. There a steadily increasing trend since 1985 is noted (2). Prior to 1985, the United States has shown a 5°/o decrease of reported cases annually.
ACKNOWLEDGMENTS
Dr Anil Patel, Patrick Derhy, Queensland Department of Health, Dr Jonathan Streeton, Melbourne, Prue Morris, Health Department Victoria, Dr Jag Gill ,
WA
'
IE
Ir
1,,
I
I
,,
"
C Ii
I
,'
It
1,
5
REFERENCES
1 Tuberculosis in Australia - Notification Rates. COi 1991; 15:267-269
0 0 0 .... 0 0
~
~
µ.J
~
µ.J
~
j
I·
Figure 1 - Tuberculosis rate in Australia, 1986 - 1990
7
new cases
6
5.73 5.59
5 ~
5.39 5.34
•
•
II5
4
3
2.12 2.25
2
IN™I
1.291
o_..___--~---.---.---.---'
1986 1987 1988
YEAR
Figure 2 - Tuberculosis rates in Australia, 1986 - 1990
7 - - - .
6
5.65
5
1
0.32
+
0
1986
5.58
•
0.42
•
1987
new cases plus relapses
5.77
•
0.49
•
1988
YEAR
5.66
I
deaths
I
0.42
•
1989
5.95
•
0.45
•
1
AN ESTIMATE OF MEASLES VACCINE EFFICACY IN A CANBERRA PRIMARY SCHOOL
Introduction
An outbreak of measles occurred in a south side primary school in Canberra between January and March 1992. Concerned individuals within the community
!1 alerted health authorities to the outbreak, even though no cases were notified
through the communicable diseases surveillance system. Increased public awareness of measles following an outbreak in high schools during the fall of 1991, and the fact that measles is not a notifiable disease in the ACT, made community interest more important than physician notifications in this outbreak (1 ). Only three cases attended a medical practitioner for advice or treatment. There were no known concurrent outbreaks of other childhood disease which may mimic measles. The primary school involved was an independent alternative school, not subject to the normal regulations of the ACT Department of Education. It is the accepted belief within this school that immunisation is a personal choice. Immunisation records of the students were not kept within this school.
Methods
2 There were 151 children in seven grades, with an average of 21 children in each grade. The Kindergarten grade also had children who came to the school from time to time for occasional sessions. The questionnaire documented age, sex, diseases status, methods of vaccination and vaccination status. We accepted as a case of measles any child considered to have measles by doctors, parents or teachers. Serological confirmation was not possible under the constraints of the survey. We accepted a history of vaccination without viewing records; many of the children came from outside of the ACT.
Results
Cases occurred in this outbreak between 16 February and 11 April 1992 (Figure 1 ).
We received 103 full responses (68.2°/o), one incomplete response and two refusals (total
=
108). We were surprised by the response rate and the quality of data from those who did responded. However, despite our reassurances, we were able to ascertain a degree of apprehension about the survey in the school.I:
3 diagnosed not to be measles by their medical practitioner.
Table 1 - Characteristics of a measles outbreak in a primary school,
Canberra, 1992.
Class/ Grade
Kindy Gr. 1 Gr. 2 Gr. 3 Gr. 4 Gr. 5 Gr. 6
Total No. cases 8 7 6 7 2 4 4 38 AR* per100 38.1 50 37.5 50 22.2 28.6 28.6 37.2
* AR
=
Attack Rate in respondents.O/o AR*/100
Immunised Unimmunised
42.9 66.7
35.7 77.8
43.7 66.7
28.6 70
44.4 40
50 57.1
42.9 50
41.2 53.3
We analysed vaccine efficacy rates, mindful of the potential for biases which are inherent in the sampling framework. Vaccine efficacy (VE) was calculated with the following formula (2,3):
4
where ARu is the attack rate in the unvaccinated and ARv is the attack rate in the vaccinated.
Table 2 presents the attack rates and vaccine efficacy for five year age groups.
Table 2 - Vaccine Efficacy for Measles in a Primary School, Canberra,
1992.
Age group
0 - 4 5-9 10 - 14
Total
No. cases Males Females
2 12 7
21
0 16 1
17
* AR
=
Attack Rate in respondents*VE
=
Vaccine Efficacy in respondentsDiscussion:
AR*/100
50 40.6 27.6
37.2
VE*
100 100 100
100
5
l
, validate vaccination status through viewing the records. Secondly, serological confirmation was not possible, due to the constraints of the study. Many cases of measles may have been misdiagnosed by non medically qualified people. It is likely that the number of cases is exaggerated which may lead to increased attack rates. Ideally a case of measles should fulfil a case definition for measles. However, measles can be assumed as there were no other outbreaks of childhood diseases 11 which may mimic measles.
I
"
This study demonstrates the value of immunisation and shows that the protection of children from the disease can only be achieved by a high vaccine coverage rate. A figure of at least 90°/o is required to provide herd immunity against measles (4). Here, a significant proportion of children remain unprotected against measles because of religious or philosophical beliefs of their parents. In the United Kingdom, vaccine coverage for measles is showing an increasing trend, with a prediction that
in 1995, 97°/o of the children will be immunised against measles (4). In Australia,
these data are difficult to obtain. A national vaccination strategy should address this small but significant group of children in our community.
Acknowledgment:
II, I ' ' I, I I I I I I ,I I I I!
I I
I I IE I,
~/
J ' 11i I
j II
'
., Ii :,,Ii .
.
6 References: 1 2 3 4 5D Cheah, I Passaris, R Scott. Measles outbreak in Canberra. Communicable Diseases Intelligence. Vol 16;6:114-117.
Measles outbreak in Kampala. Weekly Epidemiological Record. 49:364-367.
SE Robertson, LE Markowitz, DA Berry, EF Dini, WA Orenstein. A Million Dollar Measles Outbreak : Epidemiology, Risk Factors, and a Selective Revaccination Strategy. Public Health Reports. Vol 107;1 :24-31.
JM White, SJ Gillam, NT Begg, CP Farrington. Vaccine coverage:recent trends and future prospect. British Medical Journal. Vol 304;682-4.
J
~I
• I
i.
1,
I
•
• I
•
I
,Ii
I•
:I I
,1 :
I
'
I
,,
!
Figure 1 - Measles Cases by date of onset of symptoms
5 - r - - - ,
-
4
-lfJ Q.) lfJ
ro
3-u
~
0
-~
Q.)
..0
s
2-;j
z
-
1
-Q-r---F-e-ib-i~6--.-
1~1 ~ , ... , ... , "'T'"1 "'T'"1 "T"'1 "T"'M~'.a.,_~,..., 11,...,
,,...,,,,...,,,-,....,,-..., ...
1 ... 1 ... 1 ....-....1 .,..., ..._, ... , .,....,...,,,...,,.-.,,...,,,-.-., ... ,-..., ...A
...
1p-.-
1 r....,,.i ... , ...i ... ,
"T"'• ... , ... , ... , ... , ... ,...,,,...,,.----~I,
I
TUBERCULOSIS NOTIFICATION RATES, AUSTRALIA ,1991.
David Cheah for the Communicable Disease Network (Australia)
Introduction
1
In 1991, the surveillance system for tuberculosis (Tb) was revised under the
auspices of the Communicable Disease Network (Australia). All States and
J1 Territory Health Departments agreed to supply data on all cases of notified Tb in
: an standardised format based on a program in Epi Info (1 ). These records were
I
I:
I
I,
I
'
Im
I
11
I'
11 I II
I
I
/
I
I "
I I
sent to the Communicable Diseases Section at Canberra on a periodic basis. The
data were checked for duplication before analysis.
Methods
The database sought the following details on each new case of notified Tb :
(a) A core dataset which consisted of unique identifier coded for the case,
disease code for the notification, postcode of residence, sex, date of birth,
Aboriginality, date of onset of the disease, date of report of disease and
confirmation by laboratory.
(b) A supplementary dataset which consisted of ethnicity, country of birth,
length of Australian residence, pathogen, sites of disease, diagnostic
method, medications at the time of notification, BCG vaccination status, HIV
status and whether the case was a relapsed case.
The case definition for the different categories of tuberculosis remain unchanged
I I .I I~, ' I L ' I I
I I
I' ' m I I • f 11 I i
I,
' !I ~ i I I 2with the final case number not finalised until June 1992 to ensure complete accounting of cases by the State and Territory Health Departments.
Results
Analysis was not performed on medications at time of notification, BCG status and HIV status because of incomplete data.
There were 903 new cases of M Tb notified in Australia, a decrease of 7.8°/o from the 1990 figure of 979 cases. This gives a rate of 5.21 per 100,000 for the year, compared with 5.73 per 100,000 in 1990 (Table 1 ). The rate for new cases of M Tb has remained fairly constant during the last five years, in Australia (3).
Table 1 - Notification rates for new cases of Tb*, in Australia, 1986 to 1991, by year
Year Cases
1986 863
1987 868
1988 925
1989 902
1990 979
1991 903
* Rate per 100,000
Rate 5.39 5.34 5.59 5.36 5.73 5.21 0
/o Change in Rate from previous year
-0.9 +4.7 -4.1
+6.9 -9.1