BASED ON CROWN CHARACTERS
by
J.N. COSCO
March, 1970
Thesis submitted for the degree of Master of Science at the
The progeny trial information used in this thesis was nade available to me by the Forest Research Institute, Canberra. The analysis, interpretation and presentation cf the data are my own original work.
I am indebted to the Forest Research Institute,
Canberra, who gave permission to use their measurements of a progeny trial. I would particularly like to thank
Mt A.G. Brown, F.R.I., who made this information available, and who offered advice on analysis.
I wish to thank Professor J.D. Ovington for making the facilities of the Department of Forestry available to me, aid I acknowledge with gratitude the financial assistance given me by the National Research Council of Canada during my one-year tenure at the Australian National University.
I am grateful to my supervisor, Dr K.R. Shepherd, for his guidance and constructive criticism throughout the research and preparation of this thesis.
I wish to acknowledge the statistical advice given me by Miss M.M. Ward, CSIRO.
SUMMARY
The potentials of crown variables for increasing productivity are investigated for Pinus radiat a . Genetic data are based on a twe lve-year-old progeny trial
containing twelve contro11ed-crossed families. Sampling is restricted to the dominant and codominant crown classes to minimize competitional effects. Heritability estimates and genotypic and phenotypic correlations are derived for
eleven crown characteristics and four productivity variables. The crown traits are branch diameter, branch length, branch angle, number of branches per foot, number of branches per whorl, number of whorls per foot, crown length, crown
radius, crown 1 ength-1o-width ratio, crown surface area, and crown volume. The productivity variables are diameter at breast height, total volume, basal area increment, and volume per a c r e .
Selection indices for productivity per acre are constructed from these data. One series of indices are based on genetic information alone, and another series
include 'reasonable' estimates of economic values for crown traits. The efficiency of the selection indices is
for productivity alone. The indices are tested on the family means to detect which type of tree the indices f a/our .
Narrow sense heritability estimates indicate branch ani whorl frequency variables have high breeding values, unit branch characters are moderately genetically
controlled, and crown dimension traits have low
heritabilities. Productivity variables have the lowest breeding values.
Genotypic and phenotypic correlations derived from components of variance and covariance show that most crown traits are strongly related to productivity per acre.
Improving productivity through correlated response to selection for crown traits is genetically feasible.
Selection indices based on volume per acre and crown traits such as number of whorls per foot, number of branches per whorl, crown length-to-width ratio, and crown radius estimate a three- to four-fold improvement in productivity per acre can be achieved in comparison with selection for volume per acre alone. Incorporating economic values in the index does not greatly alter the relative index weights or expected advance.
crcwns with a good length-to-width ratio combined with a moderate stem volume.
Crown traits are shown to play a significant role in the whole tree concept. Breeding programmes must place more emphasis on evaluation of crown attributes to achieve
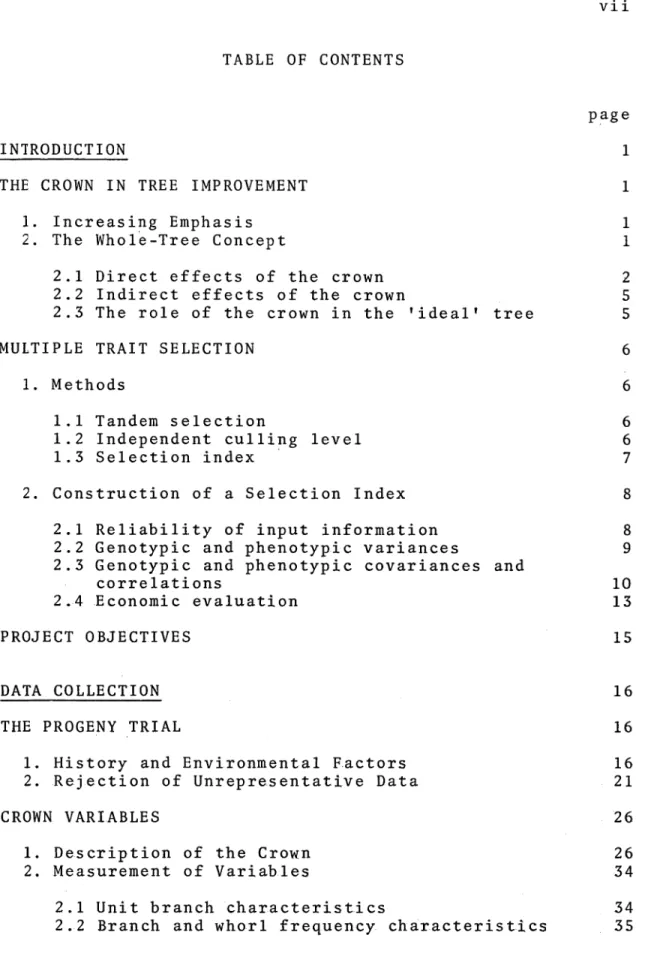
TABLE OF CONTENTS
page
INTRODUCTION 1
THE CROWN IN TREE IMPROVEMENT 1
1. Increasing Emphasis 1
2. The Whole-Tree Concept 1
2.1 Direct effects of the crown 2 2.2 Indirect effects of the crown 5 2.3 The role of the crown in the ’ideal* tree 5
MULTIPLE TRAIT SELECTION 6
1. Methods 6
1.1 Tandem selection 6
1.2 Independent culling level 6
1.3 Selection index 7
2. Construction of a Selection Index 8 2.1 Reliability of input information 8 2.2 Genotypic and phenotypic variances 9 2.3 Genotypic and phenotypic covariances and
correlations 10
2.4 Economic evaluation 13
PROJECT OBJECTIVES 15
DATA COLLECTION 16
THE PROGENY TRIAL 16
1. History and Environmental Factors 16 2. Rejection of Unrepresentative Data 21
CROWN VARIABLES 26
1. Description of the Crown 26
2. Measurement of Variables 34
2.1 Unit branch characteristics 34
page
2.3 Crown dimension characteristics
36
2.4 Productivity characteristics
37
ECONOMIC DATA
39
1. Basis of Evaluation
39
1.1 Maximizing volume per acre
41
1.2 Maximizing economically useable wood
per acre
41
STATISTICAL PROCEDURES
46
ANALYSIS OF VARIANCE AND COVARIANCE
46
1. Model of Variation
46
2. Estimation of Components
47
2.1 Assumptions concerning the experimental
design
48
2.2 Assumptions concerning the mating design
49
2.3 Statistics related to variance
estimates
50
3. Estimation of Heritability
50
4. Correlations Based on Components
of Variance
51
4.1 Testing the significance of correlations
52
4.2 Genotypic correlations
53
4.3 Phenotypic correlations
54
THE SELECTION INDEX
54
1. Construction of the Index
55
2. Estimation of Genetic Advance
57
RESULTS AND DISCUSSION
58
TOTAL VARIATION WITHIN THE TRIAL
58
ANALYSIS OF VARIANCE AND COVARIANCE
59
1. Analysis of Variance for each Trait
59
1.1 Productivity variables
62
page
1.3 Branch and whorl frequency
characteristics
69
1.4 Crown dimension variables
71
1.5 General comments on variation in traits
74
2. Observational Correlations
75
2.1 Sample correlation coefficients
77
2.2 Partial correlation coefficients
removing effect of tree size
79
3. Genotypic and Phenotypic Correlations
84
3.1 Significant genotypic and phenotypic
correlations
86
3.2 Implications of genotypic correlations
88
4. Assessment of the Variables for Selection
Criteria
92
THE SELECTION INDICES
96
1. Sing 1e-Variab 1e Indices
96
2. Two-Variable Indices
100
3. Three-Variable Indices
104
4. Applying the Indices
107
CONCLUSIONS
115
LIST OF TABLES
page
I.
Parentage and Code of Twelve Full-Sib
Families Analyzed in Progeny Trial
17
II.
Characteristics of Parent Trees as Recorded
at Time of Selection
18
III. Sampling Distribution of Progeny
Trial
21
IV. Statistical Summary of Variables
38
V.
Relative Economic Values for Traits in
Pulpwood and Sawlog Regimes
45
VI. Forms of Analysis of Variance
47
VII. Mean Squares and Mean Products Derived from
Individual-Tree Model
60
VIII.
Mean Squares and Mean Products Derived from
Plot-Mean Model
61
IX.
Statistical Analysis of Productivity
Variables
63
X.
Statistical Analysis of Unit Branch
Variables
66
XI.
Statistical Analysis of Branch and Whorl
Frequency Variables
70
XII.
Statistical Analysis of Crown Dimension
Variables
72
XIII.
Observational Correlations Based on
Individual-Tree Data
76
XIV.
Partial Correlations Removing Effect of
Tree Size
81
XV.
Genotypic and Phenotypic Correlations
Derived from Components of Variance and
page XVI . Selection
Variables
Indices Based on Sing le
97 XVI I . Selection Indices Based on Two Variables 101 X V I I I . Selection Indices Based on Three Variables 105
XIX. Order of Indices
Ranking of Families by Selection
LIST OF FIGURES
page
1. Diameter Distribution of Trial Before and After Removing Suppressed, Intermediate, and
Forked Trees 24
2. Percentage of Trial Contributing Total Basal
Area and Basal Area Increment 25
3. Royalty Rates for Mill and Peeling Log Timber and Pulpwood for Mount Gambier Area, S.A.
LIST OF PLATES
page
1. View of Trial at Age Fifteen 20
2. Typical Suppressed Tree Removed from Analysis 27
3. Variation in Crown Cover 30
4. Variation in Branch Size 31
5. Variation in Number of Whorls per Foot 32
6. Variation in Branch Angle 33
THE CROWN IN TREE IMPROVEMENT RESEARCH
1. Increasing Emphasis
The tree crown is receiving increasing attention by tree improvement workers in their search for indicators of genetic capacity. The Second World Consultation on Forest Tree Breeding (1969) recommended that crown traits "which influence many economic and technical aspects of timber use, and which have been shown to be heritable should receive greater attention than in the past". Faulkner
(1969) presented a paper to this meeting reviewing
published research on the genetic variability of branch and crown characters, most of which has been carried out during the last decade. It is notable that in Hattemer's (1963) summary of published heritability estimates presented to the First World Consultation no values for crown traits were given. Crown traits are now being assessed in most selection programmes and progeny trials, where once these parameters were considered unimportant and too expensive to mea su re .
2. The Whole-Tree Concept
The goal of breeding only for increased growth rate is
being superseded by the whole-tree concept which is defined
by Stonecypher (1969) as "the goal of the tree breeder to
produce a maximum of economically useable wood per tree and
per acre".
The term 'economically useable wood' implies
not only volume must be considered, but also the manner in
which this volume is produced.
The crown exerts a sizeable
influence on economically useable wood both directly and
indirectly, and has become a recognized factor in the whole
tree concept.
2.1 Direct effects of the crown
Unlike the agriculturalist who has the advantage of
small plant size, tree improvers cannot hope to measure
photosynthesis directly under forest conditions.
Indeed,
the non-destructive collection of leaf area or leaf weight
data so as not to affect the value of a candidate plus tree
or long-established progeny trial is a formidable problem
in itself.
Consequently, the improvement worker must
relate crown attributes to wood increment in order to
assess the photosynthetic process.
However, a simple relationship between crown and stem
is improbable because of the inherent complexity of the
photosynthetic process and the multitude of factors which
affect it.
For example, the amount of bole wood produced
the photosynthetic tissue, the total photosynthetic area
contributing to the production of carbohydrates, the
duration of photosynthetic activity both daily and annually,
and the propensity of the tree to store its photosynthetic
product in the bole in preference to branches, roots, or
more leaf tissue (Kramer and Kozlowski, 1960).
Measurements of the crown largely reflect the size of
the photosynthetic system.
Stiell (1962) assessed crown
structure of Pinus densif1 ora and found an excellent
correlation between foliage weight and crown volume.
Crown
surface area was also found to be highly correlated with
needle weight.
Loomis e_t al_. (1966) found highly
significant correlations between foliage weight and branch
diameter for shortleaf pine.
Attiwill (1962) detected
similar association for Eucalyptus ob 1 iqua.
Senda e_t al .
(1952) and Senda and Satoo (1956) studied density effects
on crown and stem parameters for Pinus densiflora and Pinus
strobus respectively.
Both studies found a decrease in
crown size and live crown ratio are associated with a
decrease in the amount of needles per tree when stand
density increases.
Through their relationship to size of the photo
synthetic system, crown traits have been shown to be
related to productivity (Wareing, 1964).
Total and
significantly correlated with the absolute size of the
crown, as assessed by such variables as crown volume, crown
surface area, and crown projection area. Brown and Goddard
(1961) demonstrated that crown surface area, volume, radius,
and projection area are significantly related to ten-year
basal area increment for Pinus taeda. Berlyn (1962) found
that stem volume of Populus de 11oides was highly related to
the surface and volume of the tree crown. He postulated
that crown volume and surface area are reflections of both
stem volume and basal area increment. Hamilton (1969)
detected highly significant correlations between the crown
parameters of volume, surface area, projection area, and
length, and the productivity variables stem volume, girth,
and height. His study material was a twenty-three year old
Picea sitchensis stand.
Crown traits independent of the absolute size of the
crown have also been related to productivity. Wedel et_ a 1 .
(1967) found number of branches per whorl to be highly
correlated with stem diameter for Pinus taeda. Branch size
and length were likewise associated with bole volume.
Number of whorls per tree is shown to be related to stem
diameter (Fielding, 1960), and to tree height (Bannister,
1962; Fielding, 1967). Grano (1957) shows that Pinus taeda
seed-trees visually classed as having dense crowns grew
All crown variables that estimate the amount of photo synthetic tissue present on a tree will be associated with productivity. They will thus have a direct bearing on the optimization of useable wood per tree and per acre.
2.2 Indirect effects of the crown
The effect of crown traits on wood quality are well- known. Branch size and frequency, number of whorls, and branch angle are all associated with percentage of knotwood. The strength properties of saw timber are affected by knots,
as are the peeling properties and appearance of veneer (Faulkner, 1969). Knotwood affects pulping costs, and the associated reaction wood changes the quality of the pulp
(Nicholls, 1967; Wedel £t_ al_. , 1967). These branch and whorl characteristics are also related to pruning costs
(Jacobs, 1938), limbing expenses, and mechanical debarking costs. Self-pruning ability influences the quantity of sound wood and the products that can be derived from it
(Fenton, 1967) .
2.3 The role of the crown in the 'ideal' tree
What emerges is a picture of the 'ideal' tree towards which breeding must progress to maximize useable wood.
will produce the greatest quantity of useable wood for the
space it occupies (Matthews, 1963).
The relative
importance of the crown is seen to be great.
It must be
manipulated in order to control tree growth and quality for
maximum economic yield (Smith and Ker, 1960; Smith, 1963).
MULTIPLE-TRAIT SELECTION
1 .
Methods
The fact that crown traits as well as productivity
variables must be considered together implies
multiple-trait selection.
There are three basic methods available
for applying multiple-trait selection.
These are tandem,
independent culling level, and selection index (Hazel and
Lush, 1942).
1.1 Tandem selection
Tandem selection involves the improvement for one trait
at a time over successive breeding generations.
Because of
the long generation interval of most tree species, this
method is of limited use to forest tree breeders.
1.2 Independent culling level
Independent culling level is based on the establishment
of a level of merit for each trait below which a candidate
is rejected regardless of its acceptability for all other
high the selection differential becomes increasingly
difficult to achieve as the number of tree characters under
consideration rises (Pederick, 1967).
For example, if the
standard of selection is the best one per cent of the
population for each of three traits, the chance of
obtaining an individual up to standard with respect to all
three characters is one in one million trees.
This system
is obviously of limited use.
1.3 Selection index
The selection index is the most efficient in terms of
providing an objective method whereby the characters are
weighed in a systematic manner.
It takes into account the
relative economic value of each trait, the genotypic and
phenotypic variances of these traits, and the genotypic and
phenotypic covariances (or correlations) between each pair
of characters.
With the proper information an index can be
constructed which has no peer for assigning weights (Brim
et al., 1959).
The widely used point-score system of selection is an
attempt by breeders to construct an index with inadequate
information.
It assigns values to each trait based on an
arbitrarily chosen scale.
This scale is determined by the
relative economic importance of each trait, but it has no
genetic basis.
Woessner (1965) points out many grading
heritabi1ities or genetic correlations between the
characters for which the trees are being selected".
The
point-score system has proved adequate for selection during
the period of tree improvement when genetic information on
most species has been limited.
However, with the
increasing maturity of many progeny trials the data
required to construct proper selection indices are becoming
available and should be so used.
2. Construction of a Selection Index
The data required to construct a selection index are:
genotypic and phenotypic variances of each trait, genotypic
and phenotypic covariances between each pair of traits, and
the relative economic values of each trait.
2.1 Reliability of input information
Emphasis must be placed on the reliability of genetic
information used to construct an index.
Ehrenberg (1969)
points out "when genetic variances are being estimated,
many assumptions have to be made which are never fully
realized in the material investigated.
This fact lends a
varying degree of unreliability to the calculated values".
Williams (1962) cautions that an index derived from poorly
estimated parameters is likely to be poor, "and may even
have an expected negative correlation with the optimum
the error of estimate for the genetic parameters is usually
high because sampling of the population is restricted to
small numbers of relatives and very few environments.
The
usual material from which we derive our parameters is a
progeny trial not specifically designed for the purpose of
estimating genetic variances (Stonecypher, 1966).
In
general, progeny trials are representative of a small
sample of the population biased through initial selection,
and are restricted to a single environment.
The
experimental designs in which they are laid out were
developed to test differences between means rather than
variances (Stonecypher, 1966).
These factors present a
formidable deterrent to the construction of an accurate
index, but as long as it is derived from the best available
data it can be expected to be better than no index at all.
2.2 Genotypic and phenotypic variances
There is an ever-increasing store of knowledge about
the genetic and phenotypic variation of most economically
important traits.
This information is usually presented in
the form of heritability estimates.
Essentially,
heritability expresses the degree of correspondence between
the phenotypic value and breeding value of a character.
It
quantifies the concept of whether progress from selection
for a character is relatively easy or difficult to make in
misuse of the term has vitiated the usefulness of a large
number of the published values.
The FA0/IUFR0 Meeting on
Forest Genetics (1964) recommended "the genetic structure
of populations should be investigated as thoroughly and
defined as precisely as possible to permit realistic
estimates of genetic parameters...used in developing
breeding programmes".
Too often the estimate has not been
qualified with the nature of the genetic variability, the
experimental units, or the inference population, and
therefore its implications cannot be interpreted by
geneticists (Hanson, 1963).
Many researchers consider
publication of the variances conjointly with the
heritabi1ities would prevent much confusion.
However, the
relative amounts of variation in a trait attributable to
genetic and phenotypic sources can usually be inferred from
heritability estimates.
2.3 Genotypic and phenotypic covariances and
correlations
Genetic and phenotypic covariances and correlations are
derived in conjunction with variances.
Although there is a
fair knowledge of the phenotypic relationships between
variables for many species, little is known about the
genetic correlations.
Many researchers have assessed two
or more traits in a progeny trial, but have failed to
Consultation on Forest Tree Breeding has recommended that
genotypic covariance should be included in reports.
A genetic correlation coefficient measures the degree
of association between the genetic variances of two
quantitative characters in a given population (Reeve,
1955).
Its meaning can best be understood from its
relation to phenotypic correlation.
The association
between two characters which can be observed directly is
the correlation of phenotypic values (Falconer, 1964).
This observational correlation results from two main
causes; genetic and environmental.
It is assumed these
causes are uncorrelated.
The genetic component is chiefly
determined by pleiotropy which is the property of a gene to
affect more than one character.
If the gene is segregating
it causes simultaneous variation in all characters it
affects.
Environmental correlation results from the effect
the same environment has on several characters; it also
includes all non-additive genetic components.
Hence, the
genetic and environmental correlations correspond to the
partitioning of the phenotypic covariance into the additive
genetic component versus all remaining components.
The degree of heritability, or breeding value, of the
correlated traits play an important part in establishing
o b s e r v a t i o n a l c o r r e l a t i o n . F a l c o n e r ( 1 9 6 4 ) p o i n t s o u t t h a t
t h e p h e n o t y p i c c o r r e l a t i o n i s e q u i v a l e n t t o
r = P
covA+cov£
h Xh Yr A+ e Xe Yr E ’ ( 1 )
j
(v a r a x+v a r e x h v a r a y+v a re y )w h e r e P , A, a n d E d e n o t e p h e n o t y p i c , a d d i t i v e g e n e t i c , a n d
e n v i r o n m e n t a l p a r a m e t e r s r e s p e c t i v e l y ; X a n d Y s y m b o l i z e
t h e t wo t r a i t s ; h t h e s q u a r e r o o t o f h e r i t a b i 1 i t y , a n d e
i t s c o m p l e m e n t ; r i s t h e c o r r e l a t i o n c o e f f i c i e n t . I f t h e
c h a r a c t e r s h a v e l o w h e r i t a b i l i t y v a l u e s , t h e e n v i r o n m e n t a l
r a t h e r t h a n t h e g e n e t i c c o r r e l a t i o n w i l l d e t e r m i n e t h e
o b s e r v a t i o n a l c o r r e l a t i o n . T h e d u a l n a t u r e o f t h e
p h e n o t y p i c r e l a t i o n s h i p m a k e s i t c l e a r t h a t t h e m a g n i t u d e
a n d e v e n t h e s i g n o f t h e g e n e t i c c o r r e l a t i o n c a n n o t b e
d e r i v e d f r o m t h e p h e n o t y p i c c o r r e l a t i o n a l o n e .
Th e s e l e c t i o n i n d e x u s e s t h e i n f o r m a t i o n c o n t a i n e d i n
t h e v a r i a n c e s a n d c o v a r i a n c e s t o s h o w t h e e x p e c t e d g e n e t i c
r e s p o n s e i n a c h a r a c t e r t h r o u g h s e l e c t i o n f o r c o r r e l a t e d
t r a i t s . G e n e t i c g a i n i n o n e p a r t i c u l a r c h a r a c t e r t h a t c a n
b e a c h i e v e d t h r o u g h m u l t i p 1 e - t r a i t s e l e c t i o n w i l l d e p e n d on
b o t h t h e h e r i t a b i l i t y o f t h e c h a r a c t e r b e i n g c o n s i d e r e d a n d
t h o s e o f c o r r e l a t e d c h a r a c t e r s . I f t h e h e r i t a b i 1 i t i e s o f
t h e s e c o r r e l a t e d c h a r a c t e r s a r e h i g h i n r e l a t i o n t o t h a t o f
t h e d e s i r e d t r a i t , c o r r e l a t e d r e s p o n s e t o s e l e c t i o n f o r t h e
h i g h l y b r e e d a b l e a t t r i b u t e s w i l l i n c r e a s e t h e p o s s i b i l i t y o f
genetically correlated will have little effect on the progress of the trait in question.
2.4 Economic evaluation
Economic evaluation of the traits is the final
information required to construct a selection index. This presents a special difficulty to the tree breeder.
However, the problem of economic evaluation is by no means limited to selection index technique alone; any method of m ul tip 1e -1rait selection, and particularly the point-score system, requires identical subjective valuation of the relative importance of each trait.
The breeder is not in a particularly favourable position to collect data from which he can assess the importance of traits. Silviculturists, procurers,
The importance of a trait is not likely to remain
static over time.
Technical improvements tend to change
the significance of a trait.
Changing product markets
similarly influence the economic importance of wood
characteristics, and since breeding takes many years to
yield results, the tree improver must compromise in
predicting the future importance of tree characters.
Namkoong (1969) points out one other difficulty in
evaluating traits.
Because of differing product potential
and the common practice of grading and marketing by classes,
a character’s value function is generally discontinuous
rather than linear over the size range.
Selection indices
require linear functions since they show the relative
improvement in the unit of selection which is caused by a
change of one unit of the correlated character.
However,
this problem may be over-emphasized since linearity can
generally be assumed over the size range being considered
for the traits.
The problem of collecting reliable information does
not preclude the exploitation of the selection index as a
method of multiple trait selection.
Like any other facet
of genetic research, there is a lack of 'suitable'
material, but use must be made of existing data.
Efforts
better selection criteria than are currently used in most
improvement programmes.
PROJECT OBJECTIVES
The goal of this thesis is to study the genetic
variability of several crown traits, and to assess their
implications for the production of economically useable
wood per tree and per acre.
Each trait will be viewed in
relation to its genetic and economic impact on productivity.
Selection indices will be constructed using those variables
which maximize economically useable wood.
The efficiency
of these indices will be compared with selection for
productivity alone.
Genetic data will be provided by a
DATA COLLECTION
THE PROGENY TRIAL
The genetical data used in this study were obtained
from a controlled pollinated progeny trial located in
Uriarra Forest, A.C.T.
It was established by the Forest
Research Institute in 1953 to test the superiority of
progeny derived from controlled pollination of trees
selected from surrounding plantations.
Its designation,
Progeny Test No. 3, indicates that it is one of the oldest
trials in the area.
Permission was obtained to use the
Institute's 1966 measurements of the trial, and, combined
with additional measurements carried out by the author in
1969, these constitute the data used for analysis.
1. History and Environmental Factors
The trial was originally established with twenty
different full-sib families.
However, not all families
were fully replicated in the experimental design, and in
order to simplify computation and interpretation only the
twelve fully replicated families were used in the analyses.
The parentage and number code for these families are shown
in Tab 1e I .
In all, fourteen parent trees were used in
Table I
Parentage and Code of Twelve Full-Sib Families Analyzed in Progeny Trial
Code Number
Parents Ferna1e Male
Code Number
Parents Female Male
1 443 X 942 7 985 X 994
2 440 X 944 8 991 X 935
3 941 X 942 9 982 X 990
4 937 X 991 10 937 X 935
5 443 X 994 11 984 X 991
6 855 X 985 12 482 X 991
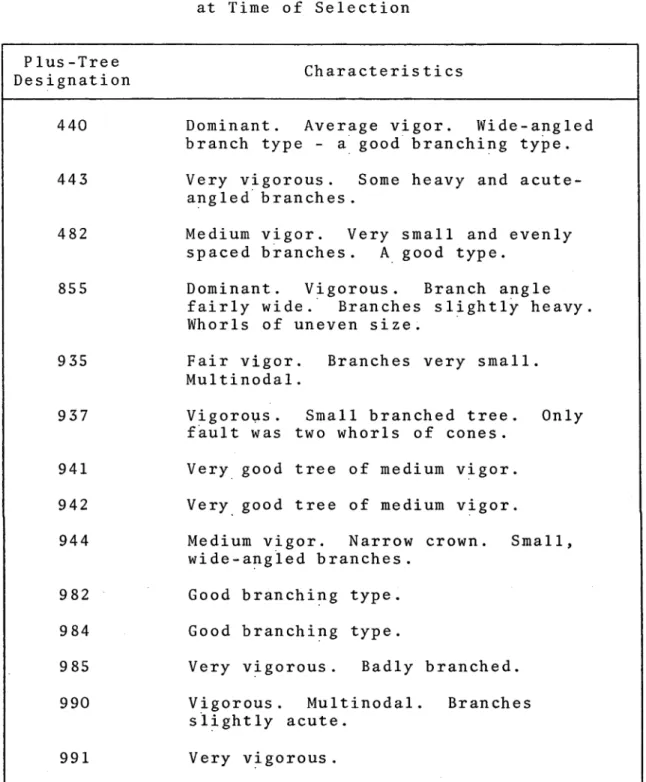
progeny groups. These parents were selected primarily for their vigor and branching habits. Table II gives the
original notes recorded for these trees. The age at time of selection is not given, but most parents would have been between fifteen and eighteen years old considering the
average age of A.C.T. plantations at that time. The lack of quantitative data on parent-tree characteristics
prevents any statistical analysis of parent-offspring relationships or genetic advance.
The trial is planted at eight-foot square spacing, and occupies an area of 1.2 acres situated on a we 11 - drained, gentle slope having a south-west aspect. The area receives about thirty-five inches of rain a year, and the soil is porous sandy-loam. The previous forest type was dry
Table II
Characteristics of Parent Trees as Recorded at Time of Selection
Plus-Tree
D e s ignation Characteristics
440 Dominant. Average vigor. Wide-angled branch type - a good branching type. 443 Very v i g o r o u s . Some heavy and
acute-angled branches.
482 Medium vigor. Very small and evenly spaced branches. A good type.
855 Dominant. Vigorous. Branch angle fairly wide. Branches slightly heavy. Whorls of uneven size.
935 Fair vigor. Branches very small. M u l t i n o d a l .
937 Vigorous. Small branched tree. Only fault was two whorls of cones.
941 Very good tree of medium vigor. 942 Very good tree of medium vigor.
944 Medium vigor. Narrow crown. Small, wide-angled branches.
982 Good branching type.
984 Good branching type.
985 Very vigorous. Badly branched.
990 Vigorous. Multinodal. Branches
planting. There are still partially burnt logs remaining in the area, but these did not greatly disturb the
regularity of spacing. The trial was pruned to six feet at ten years, but no other silvicultural treatment has been applied to the area. The site class for pine is seventy feet at age twenty which is good quality for this area. There are no obvious diseases or problems in the trial or surrounding stand, and growth can be said to be progressing normally for this environment. Plate 1 shows a view
looking downslope through the trial.
View of Trial at Age Fifteen
Table III
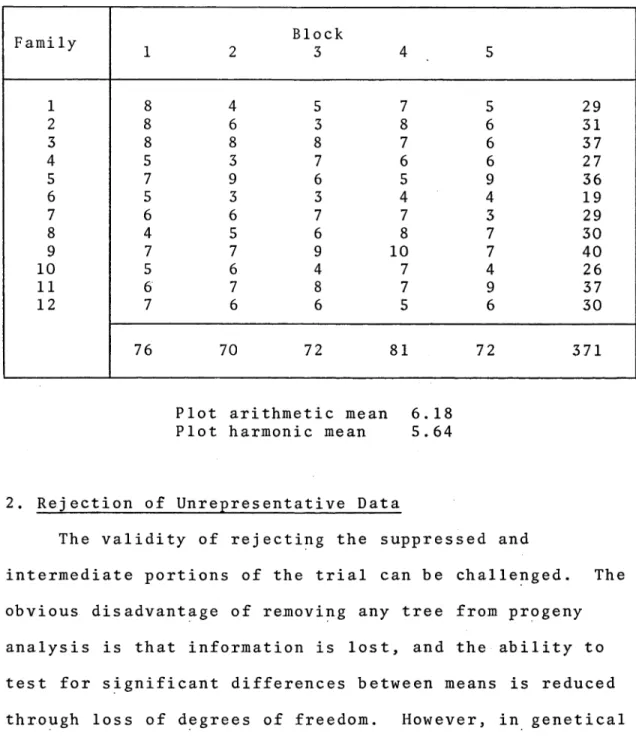
Sampling Distribution of Progeny Trial
F amily
1 2
Block
3 4 5
1 8 4 5 7 5 29
2 8 6 3 8 6 31
3 8 8 8 7 6 37
4 5 3 7 6 6 27
5 7 9 6 5 9 36
6 5 3 3 4 4 19
7 6 6 7 7 3 29
8 4 5 6 8 7 30
9 7 7 9 10 7 40
10 5 6 4 7 4 26
11 6 7 8 7 9 37
12 7 6 6 5 6 30
76 70 72 81 72 371
Plot arithmetic mean 6.18
Plot harmonic mean 5.64
2. Rejection of Unrepresentative Data
The validity of rejecting the suppressed and
intermediate portions of the trial can be challenged. The
obvious disadvantage of removing any tree from progeny
analysis is that information is lost, and the ability to
test for significant differences between means is reduced
through loss of degrees of freedom. However, in genetical
research the emphasis is on the relationship of genotypic
(1966) points out that practically all experimental
designs, especially those used in progeny tests, were
developed for precise comparison of means and not for
estimating variances and their components. Wright and
Freeland (1960) and Wright (1963) claim that statistical
efficiency is at a maximum when environmental differences
among plots belonging to the same replicate are small.
This leads to the suggestion that removal of individuals
from a plot that are largely the product of environmental
and competitional stresses would improve the efficiency of
the trial.
The removal of suppressed trees is a crude way of
accounting for competitional effects. With special
experimental designs variances resulting from competition
between different genotypes can be explained (Stern, 1965;
Sakai, 1961). However, the design used for this trial and,
indeed, most progeny designs do not permit interpretation
of competitive effects. If competition is not accounted
for in some way, the within- and between-plot variances
will be increased (Singh, 1967) resulting in
unrealistically low heritability estimates. The
effectiveness of removing competitional influences in this
manner remains to be seen.
Curtin (1968) gives strong support for removing the
distribution in Eucalyptus ob 1iqua stands corresponding to the suppressed and codominant classes. Over fifty per cent of the stand did not play a significant role in stand
growth, and contributed only twenty per cent of the total basal area. He found that suppressed individuals may greatly change the mean of a population yet contribute little of growth. Curtin emphasizes that the two sub populations behave in different ways, and should be
considered separately in growth analysis.
Figures 1 and 2 show that the Pinus radiata stand conforms with C u rtin’s results. Although the young age of the stand prevents a clear distinction between the two sub populations, Figure 1 indicates the distribution of
diameters is decidedly skewed to the left by the suppressed stems. This portion of the stand remains alive, although no significant increment occurs. This may be due to
exchange of assimilates through root grafts which keeps this portion of the stand alive (Will, 1966; Wood, 1969). The suppressed trees remain relatively static in size, whereas the dominant trees continue to grow causing the means of the two sub-populations to draw apart.
CO CO
V33V 1VSV9 QNV IN3W33DNI V33V 3VSV9 XN3D333
increment and 31.7 per cent of total basal area. Ten per
cent of the stand produced no increment at all. The
portion of the stand that was actually rejected from
analysis amounted to thirty-five per cent, and produced
16.4 per cent of the increment and 23.4 per cent of basal
area. This is a higher proportion than the graph indicates
because fifteen per cent of the rejected individuals were
from the dominant and codominant classes. These were
considered unrepresentative because of forks or broken
tops. Plate 2 depicts an example of a suppressed tree that
was not included in analysis.
CROWN VARIABLES
The crown can be quantified in various ways. Van
Slyke (1964) and Marden and Conover (1959) give excellent
descriptions of crown measurements. But rather than test
all possible variables that can be assessed on a crown we
can select those which are most applicable to the
experimental material - immature Pinus radiat a grown in
plantation conditions.
1 . Description of the Crown
The crown of immature Pinus radiat a grown in
plantations has certain characteristics. Its shape can be
Typical Suppressed Tree Removed from Analysis
This tree has added no increment in three years, yet the
space available to the individual (Brown and Hall, 1968). The lowermost branches curve upwards, but once crown
closure has occurred newly produced branches fail to curve as much and are shorter than the initial laterals. Two theories attempt to explain this: Rawlings (1961) has
suggested that the beating of branch primordia by adjacent crowns limits branch elongation, and Fielding (1960)
contends that apical dominance increases with physiological age. He offers as evidence the fact that clones exhibit greater apical dominance than seedlings.
Needle persistence is closely related to light
intensity. Needles live for two to three years on both the main stem and laterals. They die from the branch base
upwards as new growth added each year reduces the amount of light reaching the older needles. The photosynthetically effective crown thus forms as a sheath which moves upwards with age as light is excluded from the lower portion by
competing trees. The rate of ascent of the green crown and the age at which it initially moves has been shown to be linearly related to spacing (Beekhuis, 1965).
P . radiat a is multinodal; in any given year zero to five or more whorls of branches may be produced (Bannister,
c o n t r o l . T h e i n t e r n o d a l l e n g t h v a r i e s b o t h w i t h i n a y e a r
a n d f r o m y e a r t o y e a r . T h e v a r i a t i o n b e t w e e n y e a r s c a n b e
a c c o u n t e d f o r b y a n n u a l s h o o t e l o n g a t i o n ; a s a t r e e a g e s
h e i g h t i n c r e m e n t d e c l i n e s , a n d s o i n t e r n o d a l l e n g t h i s
r e d u c e d .
S i z e o f b r a n c h e s on a g i v e n w h o r l v a r i e s f r o m s m a l l
e p i c o r m s t o l a r g e , a c u t e - a n g l e d r a m i c o r m s t h a t h a v e a t o n e
t i m e c o m p e t e d w i t h t h e m a i n s h o o t . T h e r e i s a l s o l a r g e
v a r i a t i o n i n a v e r a g e b r a n c h s i z e f r o m w h o r l t o w h o r l . Some
w h o r l s h a v e m a i n l y s m a l l b r a n c h e s , a n d o t h e r s c a r r y c h i e f l y
l a r g e o n e s . T h e n u m b e r o f b r a n c h e s o n a w h o r l i s a l s o
h i g h l y v a r i a b l e r a n g i n g f r o m o n e t o t e n o r m o r e .
B r a n c h a n g l e v a r i e s f r o m a c u t e t o h o r i z o n t a l b o t h
w i t h i n a w h o r l a n d b e t w e e n w h o r l s . A n g l e g e n e r a l l y w i d e n s
w i t h a g e d u e t o t h e i n c r e a s e d w e i g h t o f t h e b r a n c h
( F i e l d i n g , 1 9 6 0 ) .
F i e l d i n g ( 1 9 6 0 , 1 9 6 7 ) h a s d e t e c t e d s e v e r a l p h e n o t y p i c
r e l a t i o n s h i p s b e t w e e n c r o w n t r a i t s i n P . r a d i a t a . B r a n c h
d i a m e t e r i s p o s i t i v e l y c o r r e l a t e d w i t h b r a n c h l e n g t h a n d
n e g a t i v e l y a s s o c i a t e d w i t h b r a n c h a n g l e , n u m b e r o f w h o r l s
p e r f o o t , a n d n u m b e r o f w h o r l s p e r t r e e . N u m b e r o f w h o r l s
i s p o s i t i v e l y r e l a t e d t o b r a n c h a n g l e , d b h , t r e e h e i g h t ,
a n d n u m b e r o f b r a n c h e s p e r f o o t .
P l a t e s 3 t o 6 i l l u s t r a t e t h e v a r i a t i o n f o u n d i n
Variation in Crown Cover
Three different families have heavy, intermediate, and
light crowns.
The heavier crowns are associated with fewer
Variation in Branch Size
Three different families point out the relationship of
branch size and whorl frequency.
The 1 arge-branched crowns
Variation in Number of Whorls per Foot
Variation in Branch Angle
2. Measurement of Variables
Variables which best describe the immature Pinus radiat a crown are unit branch characteristics, branch and whorl frequency traits, and crown dimensions.
2.1 Unit branch characteristics
Unit branch characteristics represent an average of the three largest diameter branches found in the two-foot section above the pruned stem. The average sampling
position was thus six to eight feet above ground. Branch characteristics therefore approximate the mean maximum values for the tree. The following measurements were tak en :
Branch diameter (BD) - measured to the nearest tenth of an inch two inches from junction with bole,
Branch length (BL) - measured to nearest tenth of a foot from tip to butt in a straight line, and
Branch angle (ANG) - measured to nearest degree with a special protractor developed by the Forest Research
Institute (Brown, 1967). The protractor measures the angle between branch and stem at
2.2 Branch and whorl frequency characteristics Branch and whorl frequency characteristics were measured on the ten-foot stem section above the pruned base. To be counted a branch had to be more than one-half
inch in diameter two inches from the base. A whorl had to consist of two or more branches of one-fifth inch or larger to be included in the count. Estimates of branch size were made by eye from the ground.
These specifications were laid down to give some biological significance to the variables. The size
restriction for branches was arrived at after a preliminary analysis showed the variation was almost wholly random and uncorrelated to productivity if all branches greater than one-fifth inch were included in the count. It was felt that unless a branch contributed to growth for a
significant portion of the life of the sample portion of the crown the branch should not be included in the count. The size restriction of one-half inch was derived from the distribution of mean maximum branch diameters for the
stand.
Whorls, on the other hand, could contribute to
o n e - f i f t h i n c h f o r b r a n c h s i z e wa s e s t a b l i s h e d o n l y t o
e x c l u d e e p i c o r m i c b r a n c h e s f r o m t h e c o u n t .
T h e f o l l o w i n g c o u n t s w e r e t a k e n :
N u m b e r o f w h o r l s p e r f o o t (NOW) a v e r a g e f o r t h e t e n
-f o o t s e c t i o n ,
N u m b e r o f b r a n c h e s p e r f o o t
(NOB) - a v e r a g e f o r t h e t e n -
f o o t s e c t i o n , a n d
N u m b e r o f b r a n c h e s p e r w h o r l
( B/ W) - r a t i o .
2 . 3 C r o w n d i m e n s i o n c h a r a c t e r i s t i c s
C r o w n d i m e n s i o n v a r i a b l e s w e r e c o m p u t e d a s p r o d u c t s
a n d r a t i o s o f c r o w n r a d i u s a n d c r o w n l e n g t h w h i c h w e r e
t h e m s e l v e s d e r i v e d f r o m o t h e r m e a s u r e m e n t s . Cr o wn r a d i u s
wa s c a l c u l a t e d a s t h e h o r i z o n t a l p r o j e c t i o n o f b r a n c h
l e n g t h a t t h e m e a s u r e d a n g l e . I t i s e q u i v a l e n t t o t h e me a n
ma x i mu m r a d i u s f o r t h e c r o w n . Cr o wn l e n g t h wa s d e r i v e d a s
t h e d i f f e r e n c e b e t w e e n t o t a l t r e e h e i g h t a n d p r u n e d l e n g t h
w h i c h a v e r a g e d s i x f e e t . T h i s i s a n a l a g o u s w i t h
e s t a b l i s h i n g t h e l o w e r l i m i t o f g r e e n c r o w n a t t h e
l o w e r m o s t w h o r l w i t h o n e o r m o r e g r e e n b r a n c h e s . Th e c r o w n
d i m e n s i o n v a r i a b l e s w e r e d e r i v e d i n t h e f o l l o w i n g m a n n e r :
C r o w n r a d i u s (CR) - BL x s i n ( A N G ) ,
C r o w n l e n g t h ( CL) - T r e e h e i g h t l e s s s i x f e e t ,
/
9 2Crown volume (CV) Crown length-to-width
ratio (L/W) CL/CR.
2.4 Productivity characteristics
Productivity variables were derived from diameter and height measurements. Diameter at breast height over bark
(DBH) was recorded to the nearest tenth of an inch, and height (HT) was measured to the nearest foot with height sticks. Total volume per tree (VOL) was calculated over bark as one-third the volume of a cylinder of this diameter
and height. Volume per acre (V/A) was defined as the
summation of all trees of a given volume and crown radius that could be fitted on an acre. It is essentially a
measure of productivity per unit area of land, and the acre was chosen as the unit to facilitate computation of
economic values for the selection index. The variable was calculated in units of 100 cubic feet according to the formula 43560 x V O L / ( IOOttC R 2 ) .
DBH was remeasured in 1969, and the three-year basal area increment (BAI) was computed from the gain in diameter.
S
t
a
t
i
s
t
i
c
a
l
S
u
m
m
a
r
y
o
f
V
a
r
i
a
b
l
e
s
O
O O o o o o
00 I—I O CT> i—I 00
t o I—I O I—I o o
o 00 tO LO
o to i—(
00 CT> o o
to o
o r— I
o 00 o o
o o 00 o
O O
cr 3
O G
V) O
w o
ECONOMIC DATA
The effects of economic weights on selection indices are stressed rather than their accuracy. The values should be considered 'reasonable' rather than precise. The
influence that economic values have on the indices will be investigated so that the impact of economic evaluation on the construction of selection indices can be judged. Brim et al . (1959) found that for one population of soybean the economic weights could be varied within a wide range
without significantly altering the relative values of the index weights. The applicability of this conclusion will be tested for P . radiata by comparison of indices
constructed with and without economic values.
1 . Basis of Evaluation
No effort is made to assess the economic significance of a trait in terms of anything other than royalty. This absolves the problem of considering the implications of a trait in different sectors of the wood industry.
Prediction of future values is not attempted. The economic evaluation of the variables is restricted to trait ranges at a first thinning, and discontinuities or non-linear functions are therefore somewhat modified. With the
MILL A ND PE ELING L O G TIMBER 00 5 T f Q O O 3:
Pl,
hJ a PL, o -o o •n CN o
9
CN oin oo oin
(SHVT10G) 1333 J9dns 001 333 S3IV3 ÄL3VA03
stumpage value of P . radiat a for the Mount Gambier area, South Australia. It is based on diameter classes which imply discontinuities, but the fit of points to a linear regression is excellent.
The major discordancy in the economic data is caused by pulpwood values which are constant over the diameter ranges. No premium is paid for a larger-sized pulpwood log as for mill and peeling logs. Rather than ignore this
problem a separate index will be constructed for pulpwood and sawlog regimes.
1.1 Maximizing volume per acre
The objective of pulpwood regimes is to maximize voltme production per acre. The size of the individual
tree is immaterial provided it is above a minimum diameter, and the quality of the stems is also unimportant within brocd limits. Wood characteristics are economically
relevant, but consideration of such variables is beyond the scoje of the thesis. Hence, of all the crown and stem
traits considered none has an economic value for pulpwood, and each trait will receive an economic weight of zero. Vo lime per acre will have a weight of one.
1.2 Maximizing economically useable wood per acre The objective of a sawlog regime is to maximize
and decrease with defects in log quality such as excessive
sweep, knot size, and branch frequency.
Although the trend
is linear for log size (Figure 3), there are marked
discontinuities in the royalty scales for defects.
In
fact, most Pinus radiata log royalty rates do not have
grade limits, but concessions are given for certain classes
of logs and in certain circumstances (Conservator of
Forests, South Australia, personal communication).
These
discontinuities result from the dependence of the
seriousness of the defect on log size; a larger log will
sustain a more serious defect before it is degraded.
However, the range of log sizes and quality traits is
limited for the age of the stand under consideration, and
the problem can be simplified by estimating the seriousness
of defects on a log of average dimensions.
We can assume
that at a certain limit a defect will reduce the value of
the average log to that of pulp quality, and that the value
function for each variable is independent and linear over
this limited range.
We can then estimate the economic
weight of a character under these restrictions.
Given that these assumptions are valid for the limited
conditions of a first thinning, we can establish the limits
at which a quality trait is likely to reduce the value of
branch diameter is increased to one and one-half inches,
number of branches per foot to three, number of whorls per
foot to one, and number of branches per whorl to seven,
reduction in value per one hundred cubic feet of volume for
the average-sized log will be from $0.90 to $0.58 (Figure
3) or thirty-five per cent.
The economic weight attached
to each variable relative to the selection unit for volume
per acre will be; branch diameter -0.45, number of branches
per foot -0.23, number of whorls per foot -0.70, and number
of branches per whorl -0.35.
These values are derived from
the relationship between the increase in units of the
variable from the mean to the established limit and the
relative decrease in value for the unit of selection.
For
example, branch diameter increased 0.77 inches (units) from
the mean value, 0.73 inches (Table IV), to the
predetermined limit, 1.50 inches.
This is related to a
relative decrease in value of the selection unit of -0.35;
thus, an increase in branch diameter of 1.0 unit will
result in a decrease in value of -0.45 relative to the unit
of selection which is one hundred cubic feet of volume.
A
weight for branch angle can likewise be derived if we set
the limit at which the average log is degraded at 50
degrees.
The weight will be positive because the direction
of increase is favorable to wood quality.
It is calculated
Increasing diameter of the average log by one inch
adds a value of $1.50 to the selection unit (Figure 3).
For the average tree this would indicate an economic value
of 0.17 for diameter measured in one-inch units.
Varying the area occupied by the crown will also
influence volume per acre.
Cromer and Pawsey (1957) show
that total volume per acre is inversely related to spacing
for immature Pinus radiat a .
Their values at age ten over a
range of spacing from six to eleven feet indicate a
reduction in volume per acre of 140 cubic feet for an
increase in spacing of one foot.
Average crown radius is
consequently increased by one-half a foot.
Hence, a one-
foot increase in crown radius equivalent to a two-foot
increase in spacing results in a reduction in volume of 280
cubic feet per acre.
The appropriate economic weight for
crown radius and its component branch length will be -2.8
relative to the selection unit of 100 cubic feet.
An economic value of zero is given all other traits
that have no direct influence on the value of wood
produced.
They will be incorporated into the index,
nevertheless, because their genetic and phenotypic
relationships to other variables, and particularly to
volume per acre, will be of value for correlated response
and increase in genetic gains.
Table V summarizes the
Table V
Relative Economic Values for Traits in Pulpwood and Sawlog Regimes
Variable
Relative Economic Value
Pulpwood Sawlog
V/A 1.0 1.00
DBH 0 0.17
BAI 0 0
VOL 0 0
BD 0 -0.45
BL 0 -2.80
ANG 0 0.03
NOB 0 -0.23
B/W 0 -0.35
NOW 0 -0.70
CL 0 0
CR 0 1 CM 00 o
L/W 0 0
CS A 0 0
CV 0 0
Although the economic weights have been derived in an extremely crude manner and can be challenged on several counts, they will serve to illustrate the effects of economic data on a selection index. Arbitrarily chosen values could just as easily serve this purpose, but the use of ’realistic* figures will make interpretation more
STATISTICAL PROCEDURES
ANALYSIS OF VARIANCE AND COVARIANCE
1 . Model of Variation
Analyses of variance were performed on each of the traits assessed. The experimental design allowed analysis to be carried out on both an individual-tree and plot-mean basis. The models on which analyses were based are:
Y .
.. =u
+B .
+ F .
+W .
.
+E .
.. ,13k 1 3 13 13k
where
Y.
is the measured value of an individual tree, 13ku
is the population mean,B.
is the effect of the i*"**1 block, 1F.
is the genotypic effect of the j ^ family,t h
W . .
is the interaction effect of the j family in 1 3■f" V»
the i block, and
E.
is the residual error effect. 13kY .
.
=u
+B .
+ F
.+ E .
.
,1 3 1 3 13
where
Y. .
is the mean value of a plot, 1 3u, B .
, andF-
are the same as above, and1 3