Davide Castellani and Andreas Koch
Europe needs improved competitiveness to escape the current economic malaise, so it might seem surprising that there is no common European defini-tion of competitiveness, and no consensus on how to consistently measure it. There is no single and/or harmonised dataset allowing the different facets of competitiveness to be captured in an internationally comparative perspective.
In particular, there is a lack of clarity about competitiveness at the firm level. The international operations of firms are not adequately represented by standard trade statistics, even though a thorough understanding of firm-level competi-tiveness should be a central component of Europe's response to economic difficulties. To help address this situation, this Blueprint provides an inventory and an assessment of the data related to the measurement of competitiveness in Europe. It is intended as a handbook for researchers interested in measuring competiveness, and for policymakers interested in new and better measures of competitiveness. Policymakers have an important role to play to improve data accessibility for the economic analysis of competitiveness in Europe.
Bruegelis a European think tank devoted to international economics. It is supported by European governments and international corporations. Bruegel’s aim is to contribute to the quality of economic policymaking in Europe through open, fact-based and policy-relevant research, analysis and discussion.
MAPCOMPETEis a project, supported by the European Union, to provide an assessment of data opportunities and requirements for the comparative analy-sis of competitiveness in European countries. Further information is available at www.mapcompete.eu.
Mapping
competitiveness
with European data
DAVIDE CASTELLANI AND ANDREAS KOCH
9 789078 910367
ISBN 978-90-78910-36-7
33, rue de la Charité, Box 4, 1210 Brussels, Belgium
www.bruegel.org €15
Mapping
competitiveness
with European data
DAVIDE CASTELLANI AND ANDREAS KOCH
BRUEGEL BLUEPRINT SERIES Volume XXIII
Mapping competitiveness with European data
Davide Castellani and Andreas Koch
© Bruegel 2015. All rights reserved. Short sections of text, not to exceed two paragraphs, may be quoted in the original language without explicit permission provided the source is acknowledged. Opinions expressed in this publication are those of the author(s) alone.
Editorial coordinator: Stephen Gardner Production: Michael T. Harrington Cover: Bruegel/Michel Krmek
BRUEGEL
33, rue de la Charité 1210 Brussels, Belgium www.bruegel.org
MAPCOMPETE is a project designed to provide an assessment of data opportunities and requirements for the comparative analysis of competitiveness in European
countries.
This project is funded by the European Union.
LEGAL NOTICE: This project has received funding from the European Union’s Seventh Framework Programme for research, technological development and demonstration
under grant agreement no 320197. The views expressed in this publication are the authors’ alone, and do not necessarily reflect the views
The project leader is László Halpern for CERS-HAS. The leaders of the six teams are: Carlo Altomonte (Bocconi University) for Bruegel; Giorgio Barba Navaretti (University
of Milan) for Ld’A; Gábor Békés for CERS-HAS; Andreas Koch for IAW; Lionel Fontagné for Paris School of Economics and Philippe Martin for Science Po.
Supporting institutions are the National Bank of Belgium, Banque de France, Banco de España, Deutsche Bundesbank, Banca d’Italia, Magyar Nemzeti Bank and the
Contents
Acknowledgements . . . .vii
About the authors . . . .ix
Foreword . . . .x
Executive summary . . . .1
1 Introduction . . . .7
2 Mapping competitiveness indicators in the EU countries . . . .10
2.1 Indicators of competitiveness . . . .10
2.1.1 Methodology . . . .10
2.1.2 Classification logic and selection of indicators . . . .12
2.2 Mapping the macro-level indicators . . . .13
2.3 Mapping the bottom-up indicators . . . .16
2.3.1 Methodological issues . . . .16
2.3.2 Availability and accessibility of micro-data in EU countries . . . .23
2.3.3 Concluding remarks . . . .59
3 Bottom-up competitiveness indicators comparable across EU countries: challenges and responses . . . .63
3.1 Data matching: background, terminology and challenges . . . .63
3.1.1 What is data matching? . . . .64
3.1.2 Data quality as the basic precondition for data matching . . . .65
3.1.3 Harmonisation of data . . . .68
3.1.4 Privacy and non-disclosure . . . .70
3.1.5 Potential solutions and workarounds for data and matching restrictions . . . .71
3.1.6 The distributed micro-data approach . . . .75
3.2 The European Statistical System (ESS) and the challenging demand for micro-data . . . .77
3.2.2 The current modernisation of European business and trade
statistics . . . .82
3.3 Cross-country and matched datasets in Europe – overview and examples . . . .85
3.3.1 Overview . . . .85
3.3.2 Examples of cross-country (and) matched datasets in Europe 86 3.3.2.1 EFIGE . . . .86
3.3.2.2 The Competitiveness Research Network (CompNet) .97 3.3.2.3 Combined Firm Data in Germany (KombiFiD) . . . .99
3.3.2.4 Data without Boundaries . . . .101
3.3.2.5 The Global Value Chain project and the Eurostat International Sourcing Survey . . . .102
4 Barriers to data access and matching in Europe: concluding remarks . . . .104
4.1 Issues regarding the availability of data at country level . . . .104
4.1.1 Availability of data for statistical/research purposes . . . .105
4.1.2 Legal and administrative constraints of access to micro-level data . . . .107
4.1.3 Non-legal barriers . . . .109
4.2 Accessibility and matching of data from different countries . . . .115
5 Policy recommendations: towards better access, computability and matchability of micro-level data . . . .118
6 Annex . . . .122
6.1 Assessment of the indicators of competiveness . . . .122
6.1.1 Productivity . . . .122
6.1.2 Trade competitiveness . . . .126
6.1.3 Price and Cost Competitiveness . . . .129
6.1.4 Innovation & Technology . . . .131
6.1.5 Firm Dynamics . . . .137
6.1.6 Global Value Chains (GVCs) . . . .139
6.2 List of Sources for macro indicators . . . .145
6.3 The MAPCOMPETE meta-database . . . .147
6.4 Detailed tables and comments for Chapter 2.2 . . . .150
6.5 Detailed tables for Chapter 2.3 . . . .162
6.6 Synthesis of accessibility conditions for micro-data in EU . . . .167
Acknowledgements
This report is truly the result of a collective effort by many senior and junior researchers at the six institutions that are part of the MAPCOMPETE project (Bruegel, Centro Studi Luca d’Agliano, CERS-HAS, IAW, Paris School of Economics and Sciences Po). The authors would like to acknowledge that parts of this report were initially drafted by other researchers. In particular:
• Section 2.1 builds on the ‘Competitiveness Indicators Report’ (deliverable 3.1 of the MAPCOMPETE Project) by Carlo Altomonte, Marco Antonielli, Michael Blanga-Gubbay and Silvia Carrieri (Bruegel);
• Sections 2.2 and 2.3 build on two technical reports describing the state of the art at the sectoral, regional and aggregate level and at the microeconomic level (deliverables 2.1 and 2.2 of the MAPCOMPETE project) by Davide Castellani, Silvia Cerisola, Giulia Felice, Emanuele Forlani and Veronica Lupi (LdA). The collection of information on availability and computability of indicators used in these sections also benefited from the contribution of Chiara Angeloni (LdA), Marco Antonielli (Bruegel), Zsuzsa Holler (CERS-HAS) and Gianluca Santoni (PSE). Many officials and researchers within national statistical institutes, national central banks and other institutions were also a key part of this task. A specific acknowledgement of these contributions is provided in Box 2.3;
• Chapter 3 is largely based on a report on the ‘General considerations of the matchability of datasets within and across countries and regions’ (deliverable 4.2 of the MAPCOMPETE project) by Andreas Koch and Katja Neugebauer (London School of Economics, formerly IAW). Carlo Altomonte and Elena Zaurino (Bruegel) contributed to chapter 3.3;
• Chapter 4 was written by Gábor Békés with Zsuzsa Holler (CERS-HAS);
Finally, the authors would like to thank Lauro Panella (European Commission) and Jan Hagemeier (Central Bank of Poland) for acting as discussants on a previous version of this report and for providing very fruitful insights.
Davide Castellani and Andreas Koch
About the authors
Davide Castellaniis professor of applied economics at the University of Perugia and a research fellow at CIRCLE (Sweden) and LdA (Italy). His research focuses on the determinants of the firms’ internationalisation choices and their impact on international technology transfer and economic performance. His work has been published in international journals including theJournal of Economic Behaviour and Organisation, Journal of International Business Studies,Journal of International Economics,Oxford Economic Papers,Research Policy,The Review of World Economics andThe World Economy. He has been involved in a number of research projects funded by the European Commission under various EU Framework Programmes.
Foreword
Reality for policymakers, and the decisions they make, are to a great extent products of the statistics available to them. It is not just the coverage and harmonisation of data that are important. It is also the type of data that matters. As Europe attempts to put itself back on the path to growth, the need for clear data on competitiveness, for an accurate statistical underpinning beyond some broad macroeconomic broad indicators and for new insights from new ways of looking at economic data has arguably never been greater.
This volume – a product of the MAPCOMPETE EU-funded project, in which Bruegel participates – provides an important service for researchers and policymakers by examining the availability and usefulness in Europe of indicators of competitiveness. At the country, sector and regional levels, the authors find that Europe is served rather well. In addition, micro-data, which could be used to tell us about competitiveness at the firm level, is generated by EU member states. A previous project initiated by Bruegel, EFIGE, examined the characteristics of firms that succeed globally and showed why firm-level information is needed (www.efige.org/). But it can be hard in practice for researchers to access the micro-data and to use it to create bottom-up indicators of competitiveness.
This is an area in which policymakers should intervene. The matchability and accessibility of data should be improved. The authors of this Blueprint set out a number of practical ways in which this can be done to some extent in the short term, but a longer-term approach is also required to build an effective European statistics framework that will support broad growth and competitiveness objectives. This volume shows how it can be done.
Guntram B. Wolff, Director of Bruegel
Executive summary
There is widespread agreement that improving competitiveness throughout Europe is at the heart of the structural resolution of past and future crises. However, agreement is likely to stop there. Although many studies and reports from different international and national institutions measure the competitiveness of firms, regions or nations, there is no common single definition of competitiveness, and no consensus on how to properly and consistently measure competitiveness across countries and/or over time. Moreover, even though a number of aggregate indicators (eg real effective exchange rate, unit labour costs, export share and prices) are available and broadly used, many suffer from measurement errors, not necessarily delivering the same ranking across countries or across time. Finally, there is no single and/or harmonised dataset allowing the different facets of competitiveness to be captured in an internationally comparative perspective.
This is the case for existing indicators of competitiveness, prevalently defined at the macro (national or industry) level. However, most of the current policy debate about competitiveness also neglects a large body of economic literature suggesting that the performance of countries is greatly affected by the performance of firms. Research has increasingly shown that the statistics typically used for policy design are frequently insufficient and misleading. In particular, standard statistics, essentially based on average figures, are unable to represent adequately the ability of a country or a sector to compete in the global market. Also, it has been shown that international operations of firms are not adequately represented by standard trade statistics because international investment and the fragmentation of production are increasingly important features underlying competitiveness1.
Understanding firms’ competitiveness is thus central to the policy discussion: the relevance of firms’ heterogeneity in terms of their size, productivity, innovation
activities and internationalisation strategies means that policy needs to be designed around diverse firm characteristics and strategic responses rather than around an invariantrepresentative firm. To this end, the usual measures of competitiveness based on aggregate data need to be harmonised and made comparable for different countries and years, and also to be complemented with additional indicators built-up from data (which we label as ‘bottom-up’ indicators). This need for more micro-based indicators of competitiveness is however frustrated by the lack of clarity on what could be the best sources of information and on the access conditions. Although the universe of existing data from the different official and non-official data providers is very rich, and technical progress has extended significantly the potential uses of this data, there are still major restrictions in terms of the extent to which a researcher is actually able to access the data and to compute the indicators of competitiveness he/she needs.
MAPCOMPETE, a support action for the European Commission carried out by a consortium of European research institutes (seewww.mapcompete.eu), has been designed to address the challenges discussed above, with special reference to providing an assessment of data opportunities and requirements for the comparative analysis of competitiveness in European countries at the macro and the micro level. This report picks up some of the main issues of the MAPCOMPETE project and provides an inventory and an assessment of the data related to the measurement of competitiveness in Europe. By doing so, this Report, and the associated meta-database available atwww.mapcompete.eu– which provides detailed information on data accessibility and computability of more than 150 indicators – can be a key handbook for a researcher interested in measuring competiveness, or for policymakers interested in the feasibility and in the quality of alternative competitiveness measures. This Report also identifies the opportunities emerging from recent progress made in scientific research and facilitated by different data providers who increasingly make their data available to research. Finally, this inventory allows us to identify the main issues that need to be addressed by policymakers in order to improve data accessibility for the economic analysis of competitiveness in Europe.
State of affairs
appraisal is carried out of the extent to which data for different countries can be matched and/or ‘bottom-up’ indicators of competitiveness can be compared for different countries.
Our overall conclusions are:
1. Competitiveness indicators are available at the country, sector and regional level (eg unit labour costs, price indices, REER, trade balance data, aggregate productivity) and are generally computable for relatively long time series in most EU28 countries. These macro indicators are also generally easily accessible via Eurostat, national statistical institutes, national central banks or other data providers, and can usually be compared across EU countries.
2. Availability of micro-data, and thereforecomputability of bottom-up indicators, is also rather good for many countries. This implies that, within countries, it is possible, in principle, to match different databases.
3. There is, however,a major problem in accessing both specific databases and even more matched data in many EU countries. The report highlights many legal, non-legal (such as unclear procedures, restrictions on the nationality of data users) and technical barriers severely limiting the access to data and consequently the ability of researchers to construct bottom-up indicators that are not generally constructed by statistical agencies.
4. Furthermore, if we consider building up cross-country statistics from micro-level data, which should be the final aim of any meaningful assessment of European competitiveness, the quality of European statistics is at the moment rather poor, due to limited harmonisation, matchability and accessibility of data. The possibility to build pan-European micro-level databases to assess the state and the dynamics of competitiveness in the whole region is limited, notwithstanding the considerable efforts of the European Statistical System (ESS) to coordinate national statistical institutes (NSI) to harmonise the methodology, the scope and the legal framework for data collection and processing.
Policy: what should be done?
need. Micro-data for individual countries is mostly inaccessible to external researchers, and the situation is even worse when one tries to compare figures based on micro-data which is comparable across countries: only a few cross-country harmonised firm-level surveys are available, mostly for only one or a few years. There are almost no examples of matched data across countries, and internationally comparable figures can be gathered only from a few micro-distributed data exercises. This is very different from, for example, the United States, where micro-level data that is matchable and comparable for different states has existed since at least the mid-2000s. This implies that we lack the proper information to assess the status of competitiveness at the European level, compared to the situation in the United States.
The first-best solution to overcome these bottlenecks would be to change the national and EU-level rules of data content, availability, matching and access. Some important steps have been (or are in the process of being) taken in this direction: the efforts undertaken by the ESS towards greater harmonisation of data and the construction of pan-European datasets; the reduction of the burden on enterprises in collecting and providing internal data; the provision of a common ESS infrastructure framework for the production and compilation of business statistics with an appropriate legal background and new administrative mechanisms allowing for the sharing of information, services and costs among ESS partners; the definition of consistent data requirements and of a common data quality framework, which will enable the linking and matching of statistics obtained through the regular collection of global business statistics. However, the timeline for completing all these measures is far too long. Therefore, such long-term actions aiming at changing regulations need to be complemented by more short-term measures. As these are viable, but still only second-best solutions, we will call them ‘workarounds’.
The second workaround can be to improve techniques of matching and accessing micro-level data, either by improving architectures for matching data (eg by involving ‘matching institutions’, among which a natural candidate could be a Directorate General of the European Commission) or for data access by researchers (eg by improving techniques of data anonymisation). In most countries, access to micro-data would be practically and legally feasible for external researchers, but it is easier for the data providers to restrict access. We claim that restricting access is cost- and responsibility-efficient for the data providers, but very inresponsibility-efficient for researchers and policymakers in general. But if these are the real issues behind the restrictions to data access, there are available solutions. Data access does not need to be free for all researchers. Researchers can contribute from their research funds to cover the cost of setting-up the infrastructure for data access and anonymisation. Nevertheless, EU support could play a crucial role, especially for smaller member states, which might not be able to afford to bear the fixed costs of setting up new infrastructures and developing the necessary capabilities, such as language skills and economics knowledge, which are crucial in order to foster cooperation and build a truly European infrastructure for accessing micro-level data.
The third workaround is to support multi-scope cross-country surveys, which allow researchers to gather information on a wide range of firms’ activities and performance indicators, in order to enable them to assess their contribution to overall com-petitiveness. The Community Innovation Surveys and the International Sourcing Surveys, coordinated by Eurostat, are interesting examples in this direction, although they both focus on specific aspects of competitiveness. The EFIGE survey, administered by a consortium of research institutions and supported by the EU FP7 programme, is another case in point, which instead takes into consideration a greater number of aspects of competitiveness. However, to make this solution effective, there is a need for greater harmonisation and coordination, in order to concentrate resources on fewer surveys. These should cover many aspects of competitiveness and they should be based on a greater number of firms followed constantly over time, so that the dynamics of firm competitiveness can also be accurately assessed.
1 Introduction
There is widespread agreement that improving competitiveness throughout Europe is at the heart of the structural resolution of past and future crises. Firms increasingly base their choices on parameters related to competitiveness, and the European Commission continuously monitors external imbalances using quantitative measures of aggregate competitiveness. For these reasons, a number of international institu-tions, such as the European Commission, the European Central Bank, the World Bank and the World Economic Forum, are committed to producing regular comparative reports on competitiveness at the national level (see European Central Bank, 2012; European Commission, 2013; World Bank, 2013; World Economic Forum, 2013), at the regional level (see Annoni and Dijkstra, 2013) or based on aggregated firm-level data (see CompNet Task Force, 2014).
Despite the availability of numerous publications and reports on the issue, there are some serious challenges in terms of the conceptualisation and measurement of competitiveness. First, although many studies and reports measure the competitive-ness of firms, regions, or nations, there is no commonly shared single definition of competitiveness. Second, there is no consensus on how to properly and consistently measure competitiveness for different countries and/or over time. Even though a number of aggregate indicators (eg real effective exchange rates, unit labour costs, export share and prices) are available and broadly used, they can suffer from measurement errors, and do not necessarily deliver the same ranking for different countries or across time. Third, there is no single and/or harmonised dataset that enables the different facets of competitiveness to be captured in an internationally comparative perspective.
performance of countries is greatly affected by the performance of their firms.
Second, research has increasingly shown that the statistics commonly used for policy design are frequently insufficient and misleading. A proper assessment of the statistics in use often requires the construction of alternative indicators. This is particularly relevant for competitiveness indicators. In particular, standard statistics, essentially based on averages, are unable to adequately represent the ability of a country or of a sector to compete in the global market. Also, it has been shown that the international operations of firms are not appropriately represented by standard trade statistics because international investment and fragmentation of production are increasingly important features underlying competitiveness.
Understanding firms’ competitiveness is thus central to the policy discussion: the relevance of firms’ heterogeneity in terms of their size, productivity, innovation and internationalisation strategies means that policy needs to be designed around diverse characteristics and strategic responses, rather than an invariantrepresentative firm. Usual measures of competitiveness based on aggregate data need to be comple-mented with additional indicators built-up from micro-data (which we label as ‘bottom-up’ indicators). However, this need for more micro-based indicators of competitiveness is frustrated by the lack of clarity on the best sources of information. Although the universe of existing data from the different official and non-official data providers is very rich and technical progress has significantly extended the uses that can be made of this data, there are still major restrictions in terms of the extent to which a researcher is actually able to access the data and to compute the indicators of competitiveness he/she needs.
MAPCOMPETE, a support action for the European Commission performed by a consortium of European research institutes (seewww.mapcompete.eu), has been designed to address these challenges, with special reference to providing an assessment of data opportunities and requirements for the comparative analysis of competitiveness in European countries. Based on an inventory of the existence, availability and accessibility of data that measures the different dimensions and aspects of competitiveness, both at the macro and micro levels, the project also seeks to identify the main potentials and drawbacks of the current data landscape. It seeks to outline future options and pathways for generating and providing data on competitiveness.
competitiveness in Europe, mainly on the basis of micro-level data. By doing so, the Blueprint, and the associated meta-database2, which provides detailed information on data accessibility and computability for more than 150 indicators, can be a starting point for a researcher interested in measuring competiveness, or for policymakers interested in the feasibility and in the quality of alternative measures. It also aims to identify the opportunities emerging from recent progress made by scientific research and facilitated by different data providers who increasingly make their data available to research. Finally, this inventory allows us to identify the main issues that need to be addressed by policymakers in order to improve data accessibility for the economic analysis of competitiveness in Europe.
The report is organised as follows. We first introduce, in chapter 2 (section 2.1), some general considerations on the measurement of competitiveness by developing and presenting a system of indicators organising the field into different areas. Chapter 2 also contains an extensive inventory of the available data both at the macro level (2.2) and at the micro level (2.3) mainly produced by public data providers, such as EU national statistical institutes and national central banks. This inventory highlights whether information on competitiveness is available in EU countries, whether, especially for micro-level data, it can be combined to compute the relevant indicators of competitiveness and to what extent an external researcher (ie not affiliated with the data provider) can access the data. Chapter 3, then focuses on the availability of micro-data comparable across countries. It briefly reviews issues related to the matching of micro-level data within and between countries, illustrates the Eurostat experience in facing an increasing demand for micro-data comparable across countries (3.2), and contains both an inventory and some illustrative examples of datasets that contain information on previously unconnected areas or that gather information from different countries (section 3.3). Chapter 4 presents some final considerations on how to improve access to micro-data related to the measurement of competitiveness in the future. Chapter 5 offers some policy recommendations3
.
2. The MAPCOMPETE meta-database, which allows searching for meta information on availability and accessibility of data needed to build indicators of competitiveness for the 28 EU countries, is available at http://www.mapcompete.eu/.
2 Mapping competitiveness
indicators in the EU countries
2.1 Indicators of competitiveness
With the purpose of improving the toolbox of competitiveness indicators, theMapping European Competitiveness(MAPCOMPETE) project provides an assessment of data opportunities and requirements for the comparative analysis of competitiveness in European countries. Existing competitiveness indicators have been surveyed in order to provide a critical assessment and a selection of indicators to be used in the data-mapping exercise. This section introduces the methodology, the assessment and the results of this survey and serves as a manual to interpret the findings of sections 2.2 and 2.3.
2.1.1 Methodology
Competitiveness indicators cover almost all aspects of market performance. Price and quality, the ability to innovate, the structure of the labour market, the level of international integration of markets, and qualitative conditions of countries’ business environments are frequently evoked in discussions of competitiveness. In fact, there is no shared definition of competitiveness or consensus on how to measure it. We decided, in line with Altomonteet al(2011), to consider competitiveness as related to the ability of firms in a given country – not the country itself – to mobilise and efficiently employ (also outside the country’s borders) the productive resources required to offer those goods and services for which other goods and services can be obtained (domestically or internationally) at favourable rates of substitution (or terms of trade).
In light of the definition, we conducted a systematic investigation of existing com-petitiveness indicators in the economic literature, policy papers and other sources. Focusing on the performance of firms affected the search in two ways.
First, we focused in particular on indicators that aggregate information from firm-level
data, which we label as bottom-up indicators. These indicators can be useful
complements to the macro-indicators, constructed with aggregated data. Indeed, one of the major contributions of MAPCOMPETE is to highlight where the existing ‘standard’ competitiveness indicator toolbox can be enriched with harmonised and comple-mentary bottom-up indicators.
Second, recognising that firms compete not only on price, we gave special attention to non-price competitiveness indicators. This induced a view of competitiveness that has sustainable growthas the underlying concept.
Despite taking this direction, the lack of a common understanding of competitiveness in the policy debate motivated us to further specify our analysis. In our con-ceptualisation, indicators of competitiveness are distinguished from drivers of competitiveness. In theory, the difference is striking: indicators tell us if firms, countries, sectors or regions perform well compared to each other; drivers tell us what determines this performance. However, in practice this difference is less obvious: indicators and drivers are sometimes used in the same context to denote different aspects of competitiveness; in other cases, indicators are not used as outcomes but rather as determinants.
In this chapter, we deal primarily with indicators rather than with drivers of competitiveness. In a commentary published in theFinancial Times4
, Risto Penttila, chief executive of the Finnish Chamber of Commerce, made a very compelling argument, which supports our choice:
“Either the World Economic Forum is wrong or Europe is in deep trouble. The latest competitiveness rankings from the Swiss think-tank list Finland as the most competitive country in the EU. At first, the country’s business leaders thought someone was pulling their leg. But the news was real. If Finland is the best the EU can offer, we should all be very concerned. (...) The report’s authors define competitiveness as ‘the set of institutions, policies, and factors that determine the level of productivity of a country’. But Finland’s experience shows that having
functioning institutions is not a cure-all. The country ticks all the boxes: well-protected property rights, good schools, reliable infrastructure, predictable macroeconomic policies. It is one of the biggest spenders on research and development in the world. Yet the productivity of Finnish industries has plummeted since 2009.”
2.1.2 Classification logic and selection of indicators
Organising competitiveness indicators around severalconceptshelped us to assess them against their primary objective, comparing similar indicators, and finding complementarities. We use the following six concepts:
1. Productivity 2. Market share 3. Prices and costs
4. Innovation and technology 5. Firm dynamics
6. Global value chains
These six concepts describe complementary aspects of competitiveness. We do not aim to prioritise, but rather to organise them. In order to take into account the firm-level dimension for each concept, we introduce and report also indicators that can only be built up from firm-level or, more generally, micro-level data. For practical reasons, we label these indicators as bottom-up. All other indicators are based on aggregated data and can be defined at country, sector or regional level.
The indicators concepts were ultimately helpful for choosing a subset of the indicators that should be used in the subsequent part of the project, such as the data mapping, which will be illustrated in sections 2.2 and 2.3. Within each concept we propose a selection based on:
• Indicators’ adequacy for the competitiveness concept;
• Reliability and efficiency of the statistical techniques; and
• Complementarity of the indicators.
summarised by other indicators. Moreover, selecting the indicators also helped to highlight the areas in which available indicators still offer an unsatisfactory picture of the competitiveness concept.
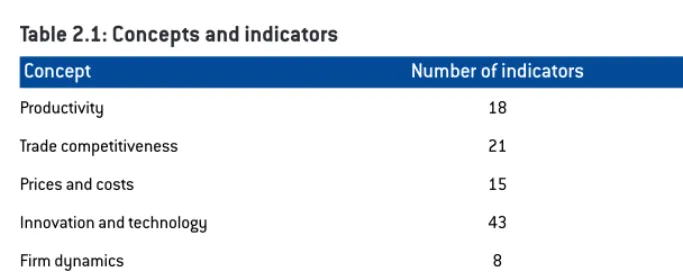
[image:24.542.70.412.218.354.2]More than 140 indicators were collected within our survey. The table below reports the number of surveyed indicators in each category.
Table 2.1: Concepts and indicators
Concept Number of indicators
Productivity 18
Trade competitiveness 21
Prices and costs 15
Innovation and technology 43
Firm dynamics 8
Global value chains 32
Others 7
More detailed information on the concepts and indicators of competitiveness, including a technical assessment of the different aspects highlighted in this chapter, such as adequacy, reliability of the statistical techniques, complementarity, macro vs. micro dimensions, within each category, is provided in section 6.1.
2.2 Mapping the macro-level indicators
For each indicator that was computable with aggregate data, we have identified the relevant level of disaggregation (national, sectoral and regional). Out of a total of 43 indicators, 41 can be computed at the national level, 32 at the sectoral level and 16 at the regional level. Therefore, we map data availability for 89 indicators. For expositional purposes, we arrange the 89 indicators into groups of relatively homogenous types of measures.
other words, one can highlight the availability of data for each indicator across countries, or of each country across all indicators. We believe the former is more informative for the aim of this report, which is to provide an overview of the availability of comparable competitiveness indicators in different countries.
It is worth mentioning that some indicators can be computed from more than one source and the different sources could imply different coverage in terms of countries, time spans and/or sectors and regions. The results presented in this chapter are based on the authors’a priorichoices of the most appropriate source for each indicator. In particular, we assigned a higher priority to data sources which were more exhaustive in terms of the information they provide about countries (ie we assigned cross-country comparability a higher priority). If two (or more) sources provide the same country coverage, we preferred the one with the longer time series.
Detailed tables and comments are provided in the Annex (Section 6.4). Here, we summarise the main conclusions from this task.
For the 89 indicators of competitiveness at country, sectoral and regional levels for the EU28 countries, our analysis shows that the degree of computability for the macro-indicators is quite good. However, there are some exceptions. It is possible to group the exceptions in three main categories: i) by country, ie, there are countries for which data availability is particularly scarce for the majority of indicators; ii) by indicator, ie there are indicators on which information is particularly scarce for the majority of countries and levels of aggregation; iii) by level, ie there are levels of aggregation on which information is particularly scarce for several indicators for the majority of countries.
In terms of exceptions by country, most EU28 countries show a good level of computability for a relevant number of indicators at different aggregation levels. Information is scarcer for Croatia and Greece than for other countries.
only 2004 (2006 for Spain and Greece) for the former, and since 2008 for the latter. The good availability of these innovation indicators can mostly be attributed to the data from the Community Innovation Survey (CIS), which is available for a longer time span in many European countries.
As for the third category of exceptions, by level of aggregation, it should be mentioned that in general information for the indicators at the sectoral and regional level is both
BOX 2.1: THE DEGREE OF COMPUTABILITY OF THE COMPETITIVENESS INDICATORS AT NATIONAL, SECTORAL AND REGIONAL LEVELS
The indicators of competitiveness at national, sectoral and regional levels are usually computed from easily accessible data. Therefore, the key dimension from which one can evaluate the extent to which an indicator can be computed (degree of com-putability) is the time span for which the indicator is available. We defined three levels of the degree of computability based on the length of the time series. In the general case, ie when data is available on an annual basis, we assign:
• The value 2 if data is available for a given country since 2000 (or earlier). • The value 1 if data is available only for a about a decade, but not for the more
recent years. We operationalise this threshold as between 2000 and 2008. • The value 0 if data is available only for a very limited time span (eg from 2008
onwards), or not available at all.
In some special cases, for instance when availability is subject to discontinuity over time, we assigned the degree of computability according to the following scale:
• The value 2 is assigned when the indicator X is available every two years, for a time span of at least 10 years.
• The value 1 is assigned when the indicator X is available every two years, but for a time span of less than 10 years.
• The value of zero is assigned when the indicator X is available for a time span of five years or less and not continuously.
In the case of Community Innovation Survey data (Indicators from I_027 to I_036):
• The value 2 is assigned when four waves are available. • The value 1 is assigned if three waves are available.
• The value 0 is assigned if fewer than three waves are available.
scarcer and less homogeneous than at the aggregate level across countries and indicators. In particular, the indicators’ computability is high at the aggregate level, but quite limited at both sectoral and regional levels for those indicators belonging to labour productivity and Total Factor Productivity, innovation activity, SMEs and R&D expenditure and output. The indicators’ computability is high at the aggregate level but quite limited at the sectoral level for those indicators belonging to trade competitiveness (Group 4), while the indicators’ computability is high at the aggregate level, but quite limited at the at the regional level for those indicators belonging to innovation activity, all firms (Group 8).
2.3 Mapping the bottom-up indicators
2.3.1 Methodological issues
As we have illustrated, indicators of competitiveness can be calculated at national, sectoral and regional level by aggregating firm-level data, ie. by applying abottom-up approach. Firm-level data allows researchers and policymakers to define a multitude of indicators that can be used to describe phenomena such as differences in regional productivity, the entry and exit rate in a specific market or international competitive-ness (eg the intensive and extensive margin of trade).
This section provides an overview of the availability and accessibility of data needed to compute a series ofbottom-upindicators of competitiveness for the EU28 countries.
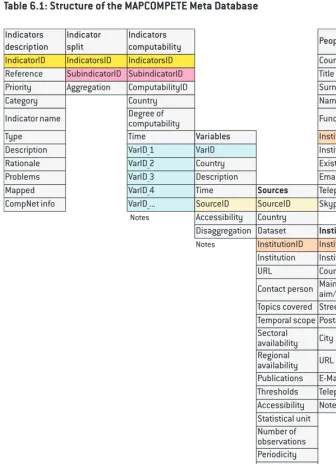
We discuss both the degree ofcomputabilityof different indices and the degree of accessibilityof firm-level data which is necessary to compute the related indicators. While the computability concerns the quality and time coverage of indicators, accessibility concerns limitations on access to firm-level data5. This information is extracted from the meta-DB (section 6.3) and will be fully searchable, jointly with the other meta-data, via a webtool at www.mapcompete.eu.
It is worth mentioning that this section focuses on indicators that are well-established in the literature on competitiveness, as reviewed in section 2.1, and that can be computed from micro-level databases collected mainly by national central banks (NCB) and national statistical institutes (NSI). Surveys, projects or commercial databases can also offer internationally comparable indicators/data on
ness. Some of these sources provide information on a variety of firm characteristics associated with competitiveness (eg World Bank’s BEEPS database or the EFIGE survey data), other focus on specific aspects such as internationalisation and productivity (CompNet), managerial practices (LSE), innovation and finance (FINNOV), economic and financial performance (Amadeus, CompNet, MicroDyn), firm and employment dynamics (MicroDyn and OECD DynEmp) corporate linkages (eWho Owns Whom), cross-border investment projects (FDI Markets). These sources will be discussed in chapter3.
Some of the bottom-up indicators are considered along several dimensions such as type of firm (all firms, exporter, importers, foreign-owned firms, domestic multi-nationals, etc), level at which data can be aggregated up (country, sector and region), and underlying distribution (average, median, variance, etc)6
. For each index, three levels of aggregation are considered: country, sector and region. The mapping of micro-level databases includes information on firms’ industrial sector (usually NACE Rev. 1.1 or Rev. 2) and geographical location (usually NUTS2 region). The mapping allows users to know if a given competitiveness index is computable by aggregating up data at sector, and/or regional level for each country. Moreover, the bottom-up approach allows scholars to determine competitiveness measures which are not confined to averages. The existence of databases with population (or surveys) of firms makes it possible to define additional moments of the competitiveness’ indices. In this perspective, when mapping micro-level databases, we make sure that the median, standard deviation and various percentiles of the distribution can also be computed.
The bottom-up competitiveness indicators that we have considered can be grouped in the following conceptual areas:
• Productivity, which for expositional purposes is presented in two distinct sets of tables: Labour productivity (including Unit Labour Cost) and Total Factor Productivity (TFP);
• Firm dynamics; • International activities; • R&D and other activities.
Labour productivity
This area includes information which is used to calculate the labour productivity index as value added per worker. The index is defined for different type of firms such as domestic firms, exporters, importers, multinationals, affiliates of foreign multinational firms, foreign and domestic-owned exporters. Moreover, in this category we also consider the firms’ unit labour cost. Regional and sectoral dimensions are taken into account, as well as the possibility to define different points of index distribution. Summary results are reported in Table 6.14.
Total Factor Productivity (TFP)
Similarly to labour productivity, for each country, we collected information on the availability of the data that is necessary to calculate firm-level TFP. In addition, the decomposition of TFP proposed by Olley and Pakes (1996) and the decomposition of TFP growth proposed by Fosteret al(2001) are also considered. Regional and sectoral dimensions are included, as well as the possibility to define different statistical moments of index distribution. A full list of indices can be found in the annex. Summary results are reported in Table 6.15.
Firm dynamics
Another source of competitiveness is the rate of turnover of firms (ie the entry and exit rate), and the average growth rate of firms. Therefore, the data mapping includes information on firms entering and exiting the market, survival rates after different time periods, average firm size (relative to age), dispersion of firms by size and growth rate. Summary results are reported in Table 6.16.
International activities
R&D and other activities
[image:30.542.72.412.242.383.2]This area includes some additional information on firm-level competitiveness, such as firm-level expenditure of R&D and the level of tangible assets. Summary results are reported in Table 6.18. For expositional purposes, we group R&D and tangible assets with some of the indicators of international activities (firm-level estimates of quality, share of foreign owned firms to total firms, share of domestic multinational firms) into a category that we label ‘R&D and other activities’.
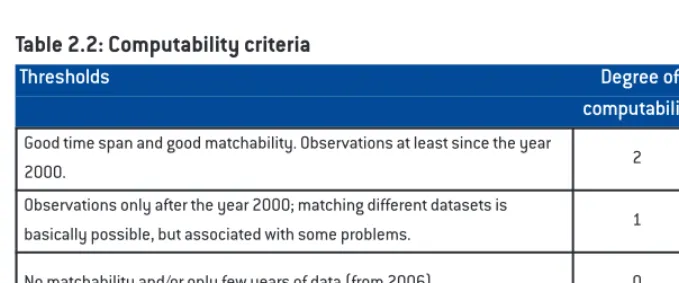
Table 2.2: Computability criteria
Thresholds Degree of Colour
computability code
Table 2.3: Accessibility criteria
Thresholds Accessibility Colour
code code
Good time span and good matchability. Observations at least since the year
2000. 2 Green
Observations only after the year 2000; matching different datasets is
basically possible, but associated with some problems. 1 Yellow
No matchability and/or only few years of data (from 2006). 0 Red
With the available information it is not possible to assess the time span and/or
the matchability. 9 Grey
Public or available on site. 2 Green
With restriction, but possible under certain conditions. 1 Yellow
No way (eg ‘Confidential’ or dependent on nationality status). 0 Red
[image:30.542.76.407.417.562.2]BOX 2.2: CRITERIA FOR COMPUTABILITY AND ACCESSIBILITY OF INDICATORS
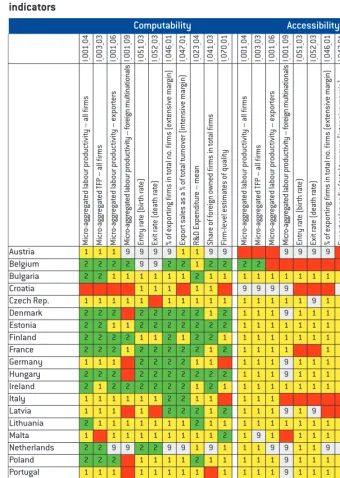
Computability: The degree of computability of an indicator depends on the span of time coverage and the quality of data. In particular, we consider whether the different sources of firm-level data necessary to calculate the related indicator can actually be matched. For example, data can be easily matched if firms have a unique identifier in different databases. As reported in Table 2.2, we define four levels of computability, and for each level we assign a numerical and a colour code.
Green indicates the highest degree of computability for an indicator, yellow suggests medium level of computability, and red low (or no) computability. Grey is used for an indicator for which it is not possible to assign a degree of computability because of the lack of information.
Accessibility: The degree of accessibility of an indicator is defined by the conditions that regulate the access to firm-level data. Similarly to computability, we report four levels of accessibility, and for each level it is assigned a numerical code and a colour. It is important to underline that the degree of accessibility describes the restriction in the access to firm-level data, which are necessary to calculate a given indicator. For example, in the case of labour productivity index, the degree of accessibility indicates the conditions of access to firm-level data on employment and value added.
Green indicates the highest degree of accessibility for an indicator, yellow suggests limited accessibility, and red restricted accessibility. Grey is used for an indicator for which it is not possible to assign a degree of accessibility because of the lack of information.
BOX 2.3: THE INFORMATION GATHERING PROCESS
(http://www.ecb.europa.eu/home/html/researcher_compnet.en.html). CompNet is a project to build bottom-up indicators exploiting data accessible by national banks. As a matter of fact, some of the indicators that MAPCOMPETE considers relevant bottom-up indicators have been actually computed within CompNet.
With the help of Filippo di Mauro and Paloma Lopez-Garcia at the ECB we were able to find contact persons in each of the 28 EU member states. In some cases, those contact persons were able to help us fill the MAPCOMPETE MetaDB and in other cases they referred us to people within the NSI. In cases in which we could not find a personal contact, we compiled the information based on publicly available information. After a first round of data collection, we drafted a first version of this report and sent it to contact persons within NSIs and NCBs for validation. In cases in which we had no direct contact, we sent the draft to a generic contact email within the NSI. This prompted replies from NSIs and NCBs, which allowed us to further integrate the information collected. At the end of this process, we were able to report on 25 out of the 28 EU countries: Austria, Belgium, Bulgaria, Croatia, Czech Republic, Denmark, Estonia, Finland, France, Germany, Hungary, Ireland, Italy, Latvia, Lithuania, Malta, Netherlands, Poland, Portugal, Romania, Slovakia, Slovenia, Spain, Sweden and the United Kingdom.
In Austria, Denmark and Spain the information could not be verified by the NSI.
From Cyprus, Greece and Luxembourg we were not able to gather enough information from publicly available sources and the contact persons that we had identified were not able to help us, so these countries are not included.
We would like to thank all the people that, within each country, helped us gather the information needed to compile the MAPCOMPETE MetaDB.
Country Contact persons Institution
Belgium Catherine Fuss National Central Bank
Bulgaria Svetoslava Filipovich National Statistical Institute
Croatia Blaženka Vukeli National Statistical Institute
Kamil Galuscak National Central Bank
Czech Republic Pavel Hájek National Statistical Institute
Estonia Aavo Heinlo National Statistical Institute
Jaanika Merikyll National Central Bank
Finland Satu Nurmi National Statistical Institute
France Philippe Brion National Statistical Institute
Germany Sven Blank National Central Bank
Hungary Peter Harasztosi National Central Bank
Ireland Keith McSweeney National Statistical Institute
Iulia Siedschlag ESRI
Italy Stefania Rossetti National Statistical Institute
Latvia Lilita Laganovska National Statistical Institute
Latvia Inga Malasenko National Statistical Institute
Sandra Vitola National Statistical Institute
Lithuania Vera Bezviuk National Statistical Institute
Malta Anne Maria Caruana National Statistical Institute
Netherlands Harry Goossens National Statistical Institute
Poland Jan Hagemejer National Central Bank
Karolina Szlesinger National Statistical Institute
Portugal Maria Conceição Veiga National Statistical Institute
Ana Cristina Soares National Central Bank
Romania Virginia Balea National Statistical Institute
Slovakia Tibor Lalinsky National Central Bank
Slovenia Urška Cede National Central Bank
Barbara Dremelj Ribi National Statistical Institute
Spain Juan Carlos Farinas Universidad Complutense Madrid
Sweden Eva Hagsten National Statistical Institute
2.3.2 Availability and accessibility of micro-data in EU countries
Austria7
The data needed to compute bottom-up indicators derives from two main data-sources. The first source is a firm sample with detailed balance sheet data collected by the statistics department of the Österreichische Nationalbank (OeNB). In recent years, the sample has been approximately 8,000 firms per year, representing 35 percent of total employment. The sample is clearly biased towards larger enterprises. The database starts in the early 2000s. The rather low number of firms is because only larger corporations have to publish their balance sheets. The OeNB collects additional balance sheet data from firms receiving larger loans from banks. This is the reason why the OeNB firm sample, small as it is, is larger than the one collected by Bureau Van Dijk which covers fewer than 3,000 firms per year for Austria (‘Sabina database’).
The second data source is OeNB-Statistics Austria micro-data on exports, imports and FDI.
Labour productivity – Labour productivity is computable only for the non-repre-sentative sample of firms for which balance Sheet data is available at OeNB and only from the early 2000s. Under these conditions, micro-aggregated labour productivity (average, median, other moments) is computable for all firms (I_001_04) and for exporters (exploiting the matching with OeNB-Statistics Austria micro-data on exports, imports and FDI). Micro-aggregated ULC (average, median, other moments) for all firms (I_013_02) is also computable under with the above-mentioned constraints. This information, however, is not accessible.
TFP– Under the conditions already explained for labour productivity, Micro-aggregated TFP (average, median, other moments) is computable for all firms (I_003_03) for exporters (I_003_05) and for importers (I_003_06). Olley and Pakes TFP decomposition (I_004_01) and Foster decomposition of TFP growth (I_005_01) are also computable. This information, however, is not accessible.
Firm dynamics– As far as we have been able to reconstruct, only dispersion by firms size (I_055_01) and share of fast-growing firms (which we refer to as gazelles8
)
7. Please note that the information provided was collected mostly from publicly available sources and has not been verified by the National Statistical Office.
(I_056_01) are computable (the conditions mentioned above still apply). This information, however, is not accessible.
Internationalisation– Through the OeNB-Statistics Austria micro-data on exports, imports and FDI, possibly matched with balance sheet data collected by the OeNB, the following indicators are computable: average, median and other moments of value of export per exporting firm (I_009_02), number of exporting firms (extensive margin) (I_048_01), average, median, other moments of export sales as a share of total turnover (intensive margin) (I_047_01), number of importing firms (extensive margin) (I_048_01) and average, median, other moments of imported intermediates as a share of total cost of materials (intensive margin) (I_050_01). This information, however, is not accessible.
R&D and other activities– Information on R&D expenditure is available in the balance sheet data collected by the OeNB. Thus, R&D expenditure – mean (I_023_04), R&D expenditure (% of turnover) – mean (I_023_05) and asset tangibility (I_059_03) are computable under the above-mentioned restrictions. This information, however, is not accessible.
Accessibility
The sources quoted above are not publicly available.
Belgium
The data needed to compute bottom-up indicators derive from two main sources. The first source is BelFirst database collected by Bureau Van Dijk. BelFirst is publicly available (conditional on a fee payment). It includes information on firms’ balance sheets. Sector classification is identified by a NACE code at 5-digit level. Most of the series of data start from 1995.
The second data source is the National Bank of Belgium (NBB). NBB collects data on both balance sheets, trade at firm-level (Transaction Trade dataset), and FDI (Survey on Foreign Direct Investments). Sector classification is identified by a NACE code at 4-digit level (both rev1.1 and rev.2). Production data are disaggregated at CN8 product level.
(I_001_06) and so on. Access to firm-level data is confidential. Only the labour productivity (I_001_04) and the unit labour cost (I_013_02) are fully accessible, because the necessary data is available in BelFirst. In the case of indicator by export status (eg, I_001_06), or ownership (eg, I_001_09), the indices are computable but not accessible.
TFP– Similar to labour productivity, TFP can be easily calculated for a long time span. Existing data allows the calculation of micro-aggregated TFP (average, median, other moments) for all firms (I_003_03), domestic firms (I_003_04), exporters (I_003_05), and so on. Again, access to firm-level data at NBB is confidential. The TFP indices are all computable but only the indices for all firms (I_003_03) and the TFP decomposition index (I_004_01, and I_005_01) are accessible, because the necessary data are available in BelFirst.
Firm dynamics– The entry rate is poorly computable (I_051_03) because of the lack of entry and exit information both in BelFirst and the NBB database: if a firm enters these databases, it does not necessarily mean that the firm is a brand new one (the same for exit). The only reliable source is CompNet database, where this indicator is already computed. Similarly, the exit rate (I_052_03), and the survival rate (I_053_01) are not clearly computable. Instead, indicators on firms’ growth are easily computable. The dispersion of firms by size (I_055_01) is computable and accessible through BelFirst, while average firm size by age (I_054_01) and the share of gazelles (I_056_01) are computable but not accessible (entry and exit data are in the NBB database).
Internationalisation– NBB has a rich dataset that collects information on trade activity at firm-level. All the indices listed in Table 6.17 such as the average (median, variance, and other moments) of number of export destination per exporting firm (I_043_01) are computable. The intensive (eg, I_047_01) and extensive (eg, I_045_01) margin of trade are also computable. However, NBB data is confidential and the indices are not accessible.
R&D and other activities –R&D data is not available at NBB and in BelFirst. Moreover, the R&D expenditures are poorly reported in annual accounts, and only for the largest firms. However, R&D data is available from 1998 to 2011 at Belspo (Federal Public Planning Service Science Policy)9. Instead, it is possible to calculate (with NBB data) the share of foreign owned firms (I_041_03), and the share of domestic multinationals
(I_042_03). In addition, it is possible to calculate both the level of tangible assets (I_059_03) and the average level of unit values (I_62_01) for exported goods. However data is confidential with the exception of I_059_03 (computable on BelFirst).
Accessibility
NBB data is confidential and restricted, and use is allowed only to NBB members (or affiliates). NBB data on firms’ balance sheets is the same data provided by Belfirst, and this source is available on payment of a fee.
Bulgaria
Firm-level data can be recovered from three main data sources. The first is the Information System Business Statistics (ISBS) integrated database, containing the annual reports (a set of accounting and statistical questionnaires) of all economically active enterprises in Bulgaria10. The second source is the Statistical Business Register. Last, firm-level trade (custom data on trade with third countries) data is reported in SAD (Single Administrative Document). In addition, trade data is collected by the National Revenue Agency (NRA) of Bulgaria (intra-EU trade), and by the Customs Agency (extra-EU trade). Bulgaria started from 2010 to collect data on foreign/domestic ownership of firms and multinationality status (ie if a firm has affiliates abroad) through a particular ‘Report on enterprise group’11.
The National Statistical Institute of Bulgaria (BNSI) maintains the ISBS and the Statistical Business Register. The BNSI is also responsible for both intra and extra trade in goods statistics. Finally, the presence of a unified identification code (EIK) for each enterprise in Bulgaria allows firm-level data from different sources to be linked. The only exception is the foreign trade database which contains the EIK from 2008, so even if data is available, the trade related indices are not computable at firm level.
The time span starts from 2001 and data was collected using NACE Rev.1 from 2001 to 2003, NACE Rev.1.1 until 2008, and NACE Rev.2 since then. Geographical location is identified with a NUTS3 code.
10. The system provides online collection of annual reports of all the economically-active enterprises, containing a set of accounting and statistical questionnaires, for both large and small (with net receipts from sales of up to 100 thousand BGN) enterprises. The questionnaires for large firms are more detailed.
Labour productivity– Indicators in this group are not all perfectly computable. It is possible to measure only the labour productivity (I_001_04), and unit labour cost (I_013_02) for all firms from 2001 using survey data. In the case of importers (I_001_07) and exporters (I_001_06) the degree of computability is lower (data from 2008). The index can be calculated both at sectoral and regional levels.
TFP– TFP index and its decompositions are computable from 2001 (I_003_03, I_04_01, and I_005_01) with survey data. The degree of computability of TFP by trade status is low (eg, I_003_05 from 2008).
Firms’ dynamics– There is information on firms’ dynamics in Bulgaria from 2005. Furthermore, it is possible to compute indices on firms’ dispersion (I_055_01) and share of gazelles (I_056_01) from 2001. For the existing data, accessibility is limited.
Internationalisation– Concerning internationalisation, Bulgarian databases provide information on external trade from 2008. All the internationalisation indicators are computable from 2008.
R&D and other activities –R&D data has been collected since 2001, as well as data on tangible assets. Information on the unit values of exports has been collected since 2008 (I_62_01), while information on firms’ ownership starts only in 2010.
Accessibility
All the sources mentioned above are restricted, and access is strictly regulated by the Protection of Secrecy (chapter 6, of Statistical Act).
The micro-data from different statistical fields is accessible, if it is possible and does not conflict with existing regulations, and after a decision of the Commission appointed under Art.10 of the ‘Rules for providing of anonymised data on scientific and research purposes’. These rules govern the provision by BNSI of micro-data and the procedure for obtaining them. The rules are based on, and in accordance with, requirements of national and relevant EU legislation. See
https://unstats.un.org/unsd/dnss/docViewer.aspx?docID=2772. See also indicator 15.4 in
Croatia
Firm-level data for Croatia is derived from the Croatian Bureau of Statistics (CBS). The main sources are Structural Business Statistics and Community Innovation Surveys (CIS) compiled for Eurostat, complemented by data on international trade collected by the same office. Firm-level balance sheet information is not available in Croatia, with the exception of for turnover and R&D expenditures, which are collected for the CIS.
Sectoral disaggregation is NACE, 4-digit, while regional disaggregation depends on specific variables/datasets.
Labour productivity –No indicator is computable, because firm-level information on value added and number of employees is not available.
TFP –As above, no indicator is computable, also because firm-level information on value added and number of employees is not available.
Firms’ Dynamics – Entry rate (birth rate) (I_051_03) and exit rate (death rate) (I_052_03) are computable since 2008. However, in 2014 the CBS has started to follow more accurately firms’ survival. Real births are available from 2010 onwards, and only survival for 1-3 years is observable. The other indicators are not computable because of the lack of information on firms’ ages and number of employees12
.
Internationalisation –Average, median and other moments of value of exports per exporting firm, total (I_009_02) and average, median, other moments of export sales as a share of total turnover (intensive margin) (I_047_01) are not computable because the information on value of production sold abroad is not available, while average, median, other moments of imported intermediates as a share of total cost of materials (intensive margin) (I_050_01) is not computable because of the lack of firm-level information on material costs. Percent of exporting firms in total number of firms (extensive margin) (I_046_01) and percent of importing firms in total number of firms (extensive margin) (I_049_01) are computable only since 2008 because the information on total number of firms is only available since that year. All the other indicators are computable since 1991.
R&D and other activities –Asset tangibility (I_059_03) is not computable because information on tangible fixed assets and total assets is not available, while firm-level estimates of quality (I_070_01) is not computable because firm-firm-level data on
value of production sold abroad is not available. R&D expenditure – mean
(I_023_04) and R&D expenditure (% of turnover)–mean (I_023_05) are computable for 2006, 2008 and 2010 through CIS. Share of foreign-owned firms in total firms (by country, sector, region) (I_041_03) is computable from 2008 and share of domestic MNFs in total firms (by country, sector, region) (I_042_03) is only computable for 2013, since information on multinational status of the firm has just started to be collected.
Accessibility
Access to most data is restricted. Data collected for CIS (turnover and R&D expenditure) can be accessed under certain conditions (for scientific purposes according to the Ordinance on the methods of statistical data protection and Ordinance on Conditions and Terms of Using Confidential Data for Scientific Purposes).
Czech Republic
The main databases for the Czech Republic are the Business Register (named RES) and the External Trade Database. Both datasets are collected by the Statistical Office (CZSO), but are also available at the National Central Bank (NCB)13
.
For the period up to 2007, the Business Register includes companies with 20 or more employees. From 2008, the Business Register considers only firms with 50 or more employees (smaller sample). The External Trade Database available at the NCB is a smaller version of the full dataset at CZSO (data on 1,000 biggest exporters and 1,000 biggest importers). According to the reported information, the Business Register starts from 2002, while the External Trade Database is available from 1999.
The NCB also collects firm-level data on FDI inflows (about 5,700 firms). Information on foreign ownership is also available in the Business Register (50 or more percent of equity). In addition, statistics on outward foreign affiliates (about 500-600 Czech firms with significant foreign affiliates) are collected and available at the NCB, and data has
been harmonised since 2007. Indicators can be defined at NACE rev.2 classification (2 digits) from 2005 (or 2007). Regional disaggregation is not reported.
The External Trade Database at NCB can in principle be matched with the Business Register because the national firm identifier ICO is available in both databases. However, the Czech National Bank is not authorised to provide micro-data originating from CZSO. Finally, note that in the External Trade Database, the main identifier is DIC (tax ID), while ICO (national firm ID) is a secondary identifier, and thus some combinations are not feasible.
In conclusion, the main issue for the Czech Republic is not the availability of underlying variables, but the unclear accessibility of Custom Data. Finally, it is worth mentioning that some of the indicators can be retrieved from the CompNet database.
Labour productivity– Labour productivity indicators are computable from 2002 (or 2005 for exporting firms) with a harmonised classification (NACE rev2). Data on multinational status needed for indicators I_001_08 and I_001_09 (domestic and foreign multinationals) is available only from 2007 and only for a restricted sample of firms.
TFP– The same considerations of labour productivity indicators apply to TFP indicators.
Firms’ dynamics– Firm dynamics indicators are computable through the Business Register. However, information on firm deaths is not reported: thus indicators I_052_03 and I_053_01 are not computable.
Internationalisation– All the indicators on internationalisation are computable, through the Business Register and Custom Data. The Business Register allows us to compute directly I_009_02, while for the other indicators it is necessary to merge the two sources.
R&D and other activities –R&D indicators (I_023_04, and I_023_05) are computable using CIS for 2000, 2001, 2004, 2006, 2008, and 2010. The share of foreign-owned firms is computable from 2005 (I_041_03), while the share of multinationals is computable from 2007 (I_042_03). Tangible asset level is computable.
Accessibility