Rochester Institute of Technology
RIT Scholar Works
Theses
Thesis/Dissertation Collections
3-1-1996
Process improvement to the anodize line through
design of experiments
Shantel Gammie
Follow this and additional works at:
http://scholarworks.rit.edu/theses
This Thesis is brought to you for free and open access by the Thesis/Dissertation Collections at RIT Scholar Works. It has been accepted for inclusion
in Theses by an authorized administrator of RIT Scholar Works. For more information, please contact
Recommended Citation
Process Improvement to the Anodize Line
through Design of Experiments
by
Shantel Gammie
A Design Project
ill
Partial Fulfillment
of the
Requirements for the
MASTER OF SCIENCE
ill
Mechanical Engineering
Approved by:
Professor
Names Illegible
Thesis Advisor
Professor
-Professor
-Professor
-Department Head
DEPARTMENT OF MECHANICAL ENGINEERING
COLLEGE OF ENGINEERING
PERMISSION GRANTED:
I, Shantel Gamrnie, hereby grant permission to the Wallace Memorial Library of the
Rochester Institute of Technology to reproduce my design project entitled Process
Improvement to the Anodize Line through Design ofExperiments in whole or in part.
Any reproduction
will
not be for commercial use or profit.
March 20, 1996
Thanks
to the
KEMDMPO
Finishing
Department
and a special
thanks to
ABSTRACT
The
goal ofthisprojectis
to analyzetheanodizeline
and make processimprovements
which
directly
affecttheproduct,
theresultsbeing
reduceddefects,
lower
variability
in
theprocess and
product,
faster
cycletime,
reducedcosts, andhigher
profits.Possible
defect
conditions were
identified,
tracked,
and analyzedin
ordertodetermine
thegreatestproblem.After
recognizing
a primeimprovement
opportunity,
adesign
of experimentswasconductedwiththepurposeof
showing
relationshipsbetween
key
process parameters and productcharacteristics.Finally,
recommendationsweremadetoraisethequality
level
oftheanodizeline,
withtheTABLE
OF CONTENTS
LIST OF TABLES
viiiLIST OF
FIGURES
ix
I.
INTRODUCTION
1
A.
Anodizing
1
1. Definition
1
2. Applications
2
3. The Process
4
4.
Types
ofAnodic
Coatings
5
a.
Barrier
5
b.
Porous
5
5.
Coating
Structure
ofPorous-type
6
6. Mechanism
8
B.
Theory
ofDesign
ofExperiments
9
1. Definition
9
2.
Qualifications
9
3. General Procedure
10
4. JMP
Analysis
14
a.
Summary
ofFit
14
b.
Analysis
ofVariance
(ANOVA)
17
c.
Parameter Estimates
20
d.
Effect Test
22
e.
Lack
ofFit
23
f
Leverage Plots
26
H.
KEYPROCESS PARAMETERS
27
m.
DEFECTS
31
IV.
DESIGN OF EXPERIMENTS
42
A.
Pre-experiment
42
1. Brainstorm
42
a.
Project
Objective
42
b.
Response Variable
(Output)
43
c.
Factors
(Inputs)
44
2.
Revelations
Since
theBrainstorming
46
a.
Material
46
C.
Experiment-Final Design
52
D. The Experiment
53
E. Response Variables
54
F. Post-experiment
56
V
ANALYSIS
57
A. Experimental
Results
57
B.
Scatter Plots
58
C. Residuals
66
D.
t-Test84
E. JMP DOE
Analysis
86
1.
Smut
87
a.
Ordinal
87
b.
Continuous
89
2.
Blue
90
3. Degree
ofSeal
91
4. Darkness
92
F.
Correlations
93
D.
Summary
ofResults
94
1.
Significant
Factors
94
2. Predition Profile
94
VI.
RECOMMENDATIONS
98
VH.
APPENDLX
105
A. Aluminum
Alloy
Compositions
andDesignations
106
1. Wrought Aluminum
106
2.
Cast
Aluminum
107
3.
Special Treatment
107
B.
Types
ofDesigns
110
1. Full Factorial
110
2. Fractional Factorial
113
3.
Screening
118
4. Response
Surface
119
C.
Values
ofto,v
usedfor
the t-Test121
D.
Smut JPM DOE Analysis
122
1. Ordinal Response
122
2.
Analysis
1
126
3.
Analysis
II
130
E. Blue JPM DOE
Analysis
133
1. Analysis 1
133
F.
Degree
ofSeal
JPM DOE
Analysis
140
1.
Analysis
1
140
2.
Analysis
U
144
G.
Darkness
JPM
DOE
Analysis
147
1.
Analysis
1
147
2. Analysis
U
151
H.
Correlations
155
LIST OF TABLES
Table Page
#_
1.
Industrial Applications
ofAnodized
Aluminum
3
2.
Pore Diameter
andCell Wall
Thickness
ofSeveral
Oxide Coatings
7
3.
ANOVA Table
18
4.
Summarization
ofKey
Process
Parameters
30
5.
Customer Complaints
38
6.
Scrap/Rework
40
7.
Possible
Variables That
Cause Smut
(Brainstorm)
44
8.
Experiment Variables
andConstants
(First
Draft)
45
9.
First Design Proposal
47
10.
Revised Table
8
.Final Experiment Variables
andConstants
51
11.
Final
Design
52
12.
Experimental Results
57
13.
Residual Values
67
14.
Residual Values
Excluding
Run
#9
76
15.
t-TestInputs
85
16.
t-TestResults
85
17.
Smut
Results
(As
anOrdinal Response
Variable);
%
Opportunity
ofProducing
Is
and3s
for
Each Factor
at3 Levels
88
18.
Smut
Analysis Results
(As
aContinuous
Variable)
89
19.
Blue
Analysis
Results
90
20.
Degree
ofSeal Analysis Results
91
21.
Darkness
Analysis
Results
92
22.
Significant
Pairwise
Correlations
93
23.
Significant
Main
Effects
94
Al.
Wrought Al
Alloy
Groups
First
Digit
Designation
106
A2.
Cast
Al
Alloy
Groups
First Digit Designation
107
A3.
Alloy
Suffix
Designations
107
Bl.
Full Factorial Design
Ordering
Pattern
112
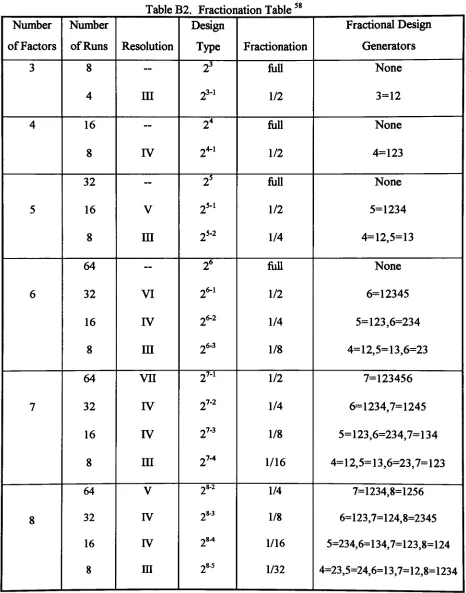
B2.
Fractionation
Table
117
B3.
Design Resolution
118
LIST OF FIGURES
Figure Page
#
1.
Anodize Process
Flow
4
2.
A
Cross-section
of aBarrier-type
Coating
5
3.
A
Cross-section
ofaPorous-type
Coating
6
4.
Causes for Lost Contact
33
5.
Causes for
Overanodizing
33
6.
Causes for Smut
34
7.
Causes for White Spots
34
8.
Causes for
Bleed
Out
35
9.
Causes for
Bent Parts
35
10.
Causes for Crashes
36
11.
Causes for
Burnt Parts
36
12.
Causes
for
Staining
37
13.
Customer
Complaints
(1994)
39
14.
Scrap/Rework
(10/24/94-12/3
1/94)
41
15.
Smut
vs.Free
Sulfuric Acid
59
16.
Smut
vs.SealpH
59
17.
Smut
vs.Seal
Temperature
59
18.
Smut
vs.DI Rinse Temperature
59
19.
Blue
vs.Free
Sulfuric
Acid
60
20.
Blue
vs.SealpH
60
21.
Blue
vs.Seal Temperature
60
22.
Blue
vs.DI Rinse Temperature
60
23.
Weight Loss
vs.Free Sulfuric Acid
61
24.
Weight Loss
vs.SealpH
61
25.
Weight Loss
vs.Seal Temperature
61
26.
Weight
Loss
vs.DI Rinse Temperature
61
27.
Darkness
vs.Free
Sulfuric Acid
62
28.
Darkness
vs.Seal
pH62
29.
Darkness
vs.Seal
Temperature
62
30.
Darkness
vs.DI Rinse Temperature
62
31.
Response
Variables
vs.Seal Temperature
64
32.
Smut
andDegree
ofSeal
vs.Seal Temperature
65
33.
Residual
Smut
vs.Smut
69
34.
Residual Blue
vs.Blue
69
35.
Residual
Degree
ofSeal
vs.Degree
ofSeal
69
36.
Residual
Darkness
vs.Darkness
69
37.
Residual
Smut
vs.Run
70
41.
Residual Smut
Normality
Test
71
42.
Residual Blue:
Normality
Test
72
43.
Residual Degree
ofSeal:
Normality
Test
73
44.
Residual Darkness:
Normality
Test
74
45.
Residual
Smut
vs.Smut
(Excluding
Run
9)
77
46.
Residual
Blue
vs.Blue
(Excluding
Run
9)
77
47.
Residual
Degree
ofSeal
vs.Degree
ofSeal
(Excluding
Run
9)
77
48.
Residual Darkness
vs.Darkness
(Excluding
Run
9)
77
49.
Residual
Smut
vs.Run
(Excluding
Run
9)
78
50.
Residual Blue
vs.Run
(Excluding
Run
9)
78
51.
Residual Degree
ofSeal
vs.Run
(Excluding
Run
9)
78
52.
Residual Darkness
vs.Run
(Excluding
Run
9)
78
53.
Residual
Smut
Normality
Test
(Excluding
Run
9)
79
54.
Residual Blue:
Normality
Test
(Excluding
Run
9)
80
55.
Residual
Degree
ofSeal:
Normality
Test
(Excluding
Run
9)
81
56.
Residual Darkness:
Normality
Test
(Excluding
Run
9)
82
57.
Prediction
Profile;
Minimized
Smut
95
58.
Prediction
Profile;
Most
Desirable
97
59.
Process Window
Example
100
60.
Smut
andDarkness
vs.Free
Sulfuric
102
61.
Smut
andDarkness
vs. pHSeal
102
62.
Smut
andDarkness
vs.Temp. Seal
103
63.
Smut
andDarkness
vs.Temp. DI
103
INTRODUCTION
The
introduction
sectionis
tointroduce
thereaderto theanodizing
process andDesign
ofExperiments.
Anodizing
Definition
Anodizing
oranodic oxidationis
anelectrolytic processfor
oxidizing
aluminumtoproducean
improved
surface quality."Aluminum
withoutsome surfacetreatmentis like
goodwoodwithout varnish.
The
woodis
strong
andmay
make a good structuralmember,
but it does
notlook
as good asit
could,
andit is
susceptibletowearandweather."1
Anodizing
is like
varnishing in
theexample above.It
addsto thequality
ofthealuminum
by
making
it
more resistantto theenvironment.Exposing
aluminumtoair produces athinoxidefilm,
thatis
0. 1-0.4
x10"6
inches
(0.25-1.0
x10'2
u,m)
thick.Anodizing
willproduce athickeroxidecoating
than thefilm
formed
naturally
in
air.With
athicker coating, aluminumhas
improved
physical andchemicalpropertieswhichallows
for
expandedapplications.Some
oftheimproved
properties
include
excellent resistancetomarine and atmosphericcorrosion,
abrasionAnodizing
occurswhenanelectrochemical conversionoccursfrom
metallicaluminumtoaluminum
oxide,
A1203
.This
conversionrequires asource ofdirect
current
passing
througha suitable acid electrolytewhich will produce oxygenions.
The
mostcommonly
used electrolyteis
adilute
sulfuricacidsolution,but
chromicacid, oxalicacid,phosphoric acid plus
additives,
andother specialized electrolytes withlimited
applicationsare also possibilities.
Applications3
Anodic
coatingsarewidely
appliedtoaluminumbecause
ofits
unique responsetoanodizing.
There
aremany
advantagesgainedfrom
anodizing
aluminum.The
following
is
a
list
of principalfunctions for
anodizing.Undercoat
for
organiccoatings,
electroplated metalliccoatings, and solidlubricants
Corrosion
resistantcoating
Coloring
(a
wide range ofcolors,for
example,black, bronze,
purple, orange)
Antimark
applicationsHeat
reflectionand radiantheat
absorptionWear
resistance andlubrication
Electrical
resistanceAbrasion
resistanceThermal
resistanceTo
get an evenbetter idea
oftheapplicationsfor
anodizedaluminum,Table 1
below lists
some ofthemoreimportant
applicationsin
present-day
industrial
practice.Table
1. Industrial
Applications
ofAnodized
Aluminum4
Industry
Application
Building
Decoration,
protection of exteriorbuilding
components,structuralmembers,
storefronts,
entranceways, windowframes,
ceiling panels,
handrails, hardware,
telephonebooths.
Transportation
Auto:
Headlight
bezels,
grills,
windowframes,
garishmoldings,
brake
pistons.Air: Aircraft
instrument
panels,landing
gear, propellers,
fuel
pumps, wing
skins,structuralcomponents,
rivets,instruction
plates, trim.
Consumer Durable
Goods
Refrigerator:
trim,
shelves,
evaporators, appliancetrim,
cooking
utensil
covers,
baking
pans,nameplates,
furniture,
giftware,
costume
jewelry,
firearm/military
components.Lighting
Reflectors
for
highway
and stadiumlights,
indoor
lighting
fixtures.
Electrical
Capacitors,
insulated
wireandstrip
conductors.The Process
Understanding
theanodizing
processis
simplifiedby
looking
attheflow
oftheprocess.
A flow
chartis
shownbelow in
figure
1.
(
Load
J
?Clean
Neutral
Rinse
Etch
Rinse
No
Rinse
*Anodize
Dye
Clear
Rinse
Deox
Rinse
Seal
DIRinse
(inspect
J
HotDI
Rinse
Unload
4Hot
Dry
<Cold
Dry
* '
Types
ofAnodic
Coatings
Anodic
coatings are classified asbarrier
or porousdepending
onthesolvent actionoftheelectrolyteonthe
naturally
occurring
oxidelayer.
Deciding
onthe typeofcoating
is
based
ontheapplication ofthepartbeing
anodized.Barrier-type
Electrolytes
withlittle
ornocapacity
todissolve
theoxideform
barrier-type
coatings.
These
typeofcoatings arethin(less
thanonetenthousandthof aninch),
compact,
nonporous,
andelectrically
resistant.In addition,
withsuitableetching
conditions,
high
capacitanceis
obtainable.Sodium
borate/boric
acid electrolytes areexamplesofthis typeof
film
producer.Electrical
capacitorshave barrier-type layer.
Aluminum
Figure 2. A
cross-section ofabarrier-type
coating
Porous-type
Porous
typeof coatings areformed in
anelectrolytewithhigh
solvent actiononthenatural oxide.
The
formed film
consists ofa porousouterportion and athinbarrier
portionadjacentto themetal.
Porous-type
coatingshave
widerangesofapplicationsPorous Layer
Barrier Layer
Aluminum
Figure 3. A
cross-sectionofa poroustypecoating
Coating
Structure
ofthePorous-type
The
structure oftheanodiccoating
is
agroup
ofhexagonal-shaped
oxide cellseach
having
acentralporethatextendstoathincompactbarrier layer
ofoxide.The
barrier layer
is
continuously
transformedinto
theporousform
during
theanodizing
process.
The
cell size equalstwice thecellwallthicknessplusthe central porediameter.
There
areapproximately
a million cells per squareinch.6The
cell structure oftheoxidelayer formed from
sulfuric, oxalic,
chromic, and phosphoric acids aresimilar,
but
vary
in
Table 2. Pore
Diameter
andCell
Wall Thickness
ofSeveral Oxide
Coatings7
Electrolyte
Pore Diameter
(Angstrom)
Wall Thickness
(Angstrom/volt)
15%
sulfuricacid, 50
F
120
8.0
2%
oxalicacid, 75 F
170
9.7
3%
chromicacid, 100
F
240
10.9
4%
phosphoricacid, 75
F
330
10.0
The
porediameter is completely dependent
onthe typeofelectrolytewhereasthewallthickness
is
highly
dependent
ontheappliedvoltageandslightly
dependent
ontheelectrolyte.
Additionally,
thecoating
thicknessdepends
onthesametwomainfactors:
applied voltage andtheelectrolyte.
For
examplesodiumborate/boric
acid electrolytes and300-500
voltsare conditionsthatproduce athinfilm
withathickness thatis less
than0.0001
inch. A
sulfuric acid solution and12-24
volts are conditionsthatproducethickerfilms
ofup
to0.001
inch.
Other
factors
affecting
the thicknessarethecurrentdensity
andMechanism
The anodizing
processis dissimilar
toelectroplating in
theway
that thecoating
forms.
Porous-type
anodicfilms
startontheoutside surfaceofthemetal anodeandprogress
inward,
sothat thelast-formed
coating
is
nearthemetal-coating
interface
andthefirst-formed
layer
is
onthesurface.By
contrast,
themetalbeing
platedin
theelectroplating
processis
aconducting
substrateacting
asthecathodein
theelectrolyticcell.
A
metalliccoating
is deposited
onthesurfaceofthe substrateandgrowsoutwards.Furthermore,
whenanodizing, additionalmetallicmaterials are notbeing
addedto thealuminum,
instead
aconversion ofthesurfaceis
occurring.The
mechanism offorming
thebarrier
coatingsis ionic.
Aluminum
ions
combinewiththeoxygen
ions
oftheelectrolyte.The barrier
thickness representsthedistance
thoughwhichthe
ions
canpenetratethelayer
ofoxideundertheinfluence
oftheappliedpotential.
Therefore
thevoltageis
thedriving
force behind
theions,
anddetermines
thethicknessofthe
barrier layer.
For
barrier-type
coatings,
alimiting
thicknessis
reached andcurrent
flow
ceases.Porous-type
coatingsdo
not reachalimiting
thicknessdue
to thesolvent action oftheelectrolyte.
However,
abarrier layer
withathickness thatis
equaltofourteen
times theapplied voltagetimesafactor less
thanunity
determined
by
theelectrolyte will stillexist
between
themetal andbase
oftheporesfor
a porousfilm.
9Barrier Layer Thickness
=Theory
ofDesign
ofExperiments
Definition
Design
ofexperiments(DOE)
is
a systematicapproachtoexperimentationthatallows an efficient and effective efforttowards
improving
thequality
andproductivity
of aprocess.
The
goal ofDOE
is
tounderstandtherelationship between
processparametersand product
characteristics,
saveexperimentationtime,
decrease
scrap
rates,decrease
production
times,
decrease
inventory,
and save costs associatedwith each ofthese. 10Qualifications
DOE
is
auseful problemsolving
processin
many
different
situations,
for
example:1)
thereexists apart withhigh
nonconformity
ormany
defects, 2)
thereexistsaprocesswith
high
nonconformity,
3)
anewmachine,processorpartis
being implemented,
or4)
anewmachine
is
being
purchased.11
A nonconformity
is
adeparture from
specification requirements.A
defect is
any
variationof a required characteristicoftheproductor
its
parts,
whichis far
enough removedfrom
its
targetvaluetopreventtheproductfrom
fulfilling
thephysical andfunctional
requirementsofthecustomer. 12
The quality
of a productorprocessincreases
asthenumber of
defects decrease.
A
measure ofthequality
oftheprocessorproductis
adefect
perunit
(DPU).13
The
most commonapplicationof aDOE
in
themanufacturing
areais
thatwhichdeals
with a partbeing
produced atahigh DPU
(case
1).
Other
timesa processis
producing
toomany
defects,
regardless ofthepartbeing
produced(case 2).
In
thissituation a representative part oftheprocess
is
chosenfor
the experiment, andtheresultsoftheexperiment are relatedtoallparts produced
by
theprocess.Case
threeaddressesproblems
before
they
happen.
By
way
ofDOE,
insight into
anew process canbe
gained.Experimentation
willteachhow
thevariablesoftheprocesswillaffectthecriticalparameters oftheparts
being
produced.Lastly,
before
purchasing
a new machine aDOE
is
a goodidea in
orderto test to seeif
themachinedoes
whatit is desired.
By
running
aDOE,
themachinecanbe
testedfor
output, variability, easeofuse,set-up
time,
andoverallmachine performance.
Basic
General
Procedure14There
aretenstepsin
adesigned
experiment.They
are asfollows:
1. Brainstorm
2. Design
theexperiment3. Obtain
materials and clean machine4. Conduct
experiment/collectdata
5. Clean
thedata
6. Analyze
thedata
7. Interpret
theresults8.
Confirmation
run9.
Write
reportThe
first
step
ofany design
of experimentprojectis
brainstorming. A
teamofexpertsshould
be
gatheredfor
abrainstorming
sessionin
ordertodiscuss
theproblemsassociatedwiththeprocess at
hand.
The
teamshould consist ofdifferent
skilllevels
including
operators, maintenance, engineers, managers,
andother experts.Several
key
questionsneedto
be
answeredduring
thebrainstorming
step.These
include:
What
is
theproject goal?What
is
theproject objective?What
aretheoutputs/responsesoftheprocess?What
aretheinputs/factors
oftheprocess?What
arethelevels
oftheinputs?
Which
inputs
areinter-related
toeachother?What
parts/materialaregoing
tobe
usedfor
theexperiment?How many
partscanbe
producedduring
the experiment? 15The
brainstorming
has
resultedin
alist
ofresponses(outputs),
factors
(inputs),
andlevels
for
thefactors
oftheprocess.Having
completedthisfirst
step,
thelist
offactors
andresponses
is
usedtodesign
an efficientexperiment,
and create aDesign
ofExperiment
sheet,
step
2.
There
areseveraldifferent
experimentsthatmay
be
chosen,
but
thegoalis
to selectthemosteconomical
design
thatwill renderthemostinformation
abouttheprocess.See
The
thirdstep
is
toobtainmaterialsand cleanthe machine, whichis
pretty
self-explanatory.
Obtaining
materialssimply
meansordering
andreceiving
thedesired
numberof parts
for
theexperiment.Cleaning
themachine meansdoing
any necessary
maintenanceoradjustmentsto themachine
before
experimentation.After
brainstorming, designing
theexperiment, obtaining
the parts, andpreparing
the
machine,
theexperimentis
runatthelevels indicated
ontheDesign
ofExperimentssheet
(step
4). Parts
needtobe
tagged,
recorded,and measuredfor
theresponse.If
theresponse
is
quantitativedata,
then thisis
aneasy
task.On
the contrary,if
theresponseis
attribute or qualitative
data
and requiresjudgment,
thenmeasuring
theresponseis
difficult
and not arecommended practice.
For
example,it is
simpletoobtainathicknessvaluefor
an anodic
coating using
apermascope.If
therewerenomeasuring
tools,
assigning
athickness toeachtest sample
by
visualmeanswouldbe impossible.
To summarize,
attribute
data is
not recommendedfor
analysis,
and shouldbe
replacedby
quantitativedata
if
possible.Bad
partswillbe
madeduring
theDOE. The
idea
of adesigned
experimentis
tochange process parameters
in
ordertoinduce
changesin
thefinal
part.Both
good andbad
partsareexpectedtobe
madeallowing
onetoseewheretheoptimal settings arelocated.
Step
five
ofthewholedesign
of experiments processis
cleaning
thedata.
Checking
theaccuracy
ofthedata is
important
toensurethatmistakesdid
not occurin
thetransmissionofthe
data. The
result ofthisstep is
alist
ofthefactor
settingsof eachNow
thedata
areready
tobe
analyzed andinterpreted (steps
6
and7)
for
twoitems:
1)
relationshipsbetween factors
and responses and2)
significant versesinsignificant
factors.
An
empiricalequation,
describing
therelationship between
thefactors
andtheresponses,
is
also obtainedfrom
thedata
analysis.This
equation willbe
usedtopredictwhattheprocesswillproduce atvarious
factor levels. The
"true"functional
relationship
between
theresponse andthefactors,
themechanisticmodel,
is
oftentoocomplicatedtoallowparameterestimation,
but it
canbe
approximatedby
anempirical(polynomial)
model.
Step
eightis
toconduct a confirmation run.By
doing
this,
theresults,
theories,
andsuggestedoptimalsettings attained
from
thedesign
of experimentand areverified.Finally,
thepurposeofthe tworemaining
steps, nine andten,
is
toinform
the teamoftheresultssothat theresults
in
awrittenreport and anoralpresentation.A
plantokeep
theJMP
Analysis
JMP
(Statistical Software for
theMacintosh
from SAS
Institute
Inc.)
is
asoftwarepackagecapableof
performing
theDOE
analysis.The
resultstolook
atfrom
theJMP
output arethe
Summary
ofFit,
theAnalysis
ofVariance
(ANOVA),
theParameter
Estimates,
theEffect
Test,
theLack
ofFit,
andtheLeverage Plots.
Summary
ofFit
17
RSquare
RSquare
Adj
Root Mean
Square
Error
Mean
ofResponse
Observations (or
Sum
ofWeights)
RSquare
(R
)
is
thecoefficientofdetermination
and measuresthepercentofthe correctedtotalsum ofthe squaresthatis
explainedby
allofthe termsin
themodel(except
for
theintercept
term).The
equationthat calculatesR2
is
givenby:
B2=
Model
sum
of
squares/Correctedtotalsumof
squaresB?=
SSModel/SS
C Total
The
R2valueis
constrainedbetween 0
and1
.Multiplying
R2
by
100
yieldstheDOE
Equation Prediction Rating. An RSquare
value of0.
95-1
.0
is
desired.
The
higher
theRSquare
valuethemore"adequate"
RSquare
Adj
(R2Adjusted)
adjustsRSquare
tomakeit
morecomparable overmodelswith
different
numbers ofparametersby
using
degree
offreedom in
its
computation.
It
is
acalculation of meansquaresinstead
ofsums of squares andis
calculated
by
B2
Adj
=1
-Error
Mean Square
C
Total Mean
Square
where,
Error
meansquareis found in
theANOVA
tablefound
onpage17-19.
C
Total
meansquare=C Total SS/C Total DF
(C
Total
SS
andC
Total DF
found in
theANOVA
table)
Root Mean
Square
Error
(Root
MSE)
is
an estimate ofthestandarddeviation
oferrors aboutthe
fitted
regression model(random
error).The
calculationfor
thisvalueis:
Boot
Mean
Square
Error
=^
ErrorMeanSquare
A
prediction withtheleast
amountofvariability
is desired.
Therefore
asmallRoot
MSE
The Mean
ofResponse
is simply
themean ofthe responses, calculatedby:
n
Yvi
Mean ofResponse
=r^
n
where,
n=
The
numberofexperimental runsy,=
The
i*response valueThe
number of experimentalruns, n,
equalsthenumberofObservations
(or
sum ofAnalysis of Variance
(ANOVA)
18Degrees
ofFreedom(Model,
Error,
Total)
Sum
ofSquares
(Model,
Error,
Total)
Model Mean
Square
Error Mean
Square
F Ratio
Prob>F
"The
analysis ofvarianceis
a meansfor
partitioning
thetotalvariability
oftheobserved responsevariables
into
variouscomponentswhichcanbe
attributedtoknown
sources."101
The
totalvariability
is broken down into
theexperimental errorvariability
andthemodelvariability.
The
experimental errorvariability
representsthevariability
withinthegroupsofresponse values.
The
modelvariability
is
thevariability
due
tochanging
thefactor levels
andit
representsthevariability
acrossthe threefactor
levels
(high,
medium, andlow).
Notation
for
theANOVA
table:n=
The
number of experimentalruns
p
=The
numberof modelparametersyi=
The
i*responsevaluey
=The
averageofthenresponse values*yj
==
The
summation
from i=l
ton(over
alltheresponses)
Table 3. The ANOVA Table
Source
ofVariability
Degrees
ofFreedom
Sum
ofSquares
Mean
Square
Model
Error
Total
p-1
n-p
2XV
y)2Z(yi-yf
(p-l)+(n-p)
=n-1
Kyi- y)2
OR
KV
y)2/(P-i)
Itory?/(M>)
Source
ofVariability-indicates
the specific componentof variability.Degrees
of Freedom- representsthenumber ofindependent
piecesofinformation
usedtoestimatetheparticularcomponentofvariability.
Sum
ofSquares
(SS)-is
thenumericalestimateofthecomponent ofvariability
(unadjusted for
thedegrees
offreedom). It
is
thesum ofsquares ofthedifference
between
thefitted
response andtheactualresponse.Mean
Square-is
anestimate ofthevariability
contributionfrom
thecorresponding
sourceof
variability
afteradjusting for
thedegrees
offreedom.
In
additiontheANOVA
tablehas
theF
Ratio
andtheProb>F.
FBatio
=Model
Mean Square
Error Mean
Square
It
estimatesthefollowing
quantity:Experimental variability
+Factor variability
Experimental variability
The
larger
theF Ratio
(the further
it deviates
from
onein
thepositivedirection),
themore evidencethere
is
ofsignificantfactor
effects.The F Ratio
is
the"F
Value"for
the test statistic andtheProb>F
value(the
p-value)
is
thesignificance
level
which are usedto test thefollowing
hypotheses:
Ho: No
factors have
aneffect ontheresponse orPi=P2
=33
=Pi
=0
H,: At
least
onefactor has
aneffect ontheresponseor0iort32orp3or...
p\*0wherethe
3s
arethecoefficients ofthemaineffectsin
theequationthatwillresultfrom
theDOE
analysis.See
Appendix B
for
moreinformation.
A
"Prob>F'value <0.05
indicates
sufficient experimentalevidencetorejectthenullParameter
Estimates19Term
Estimate
Std
Error
t
Ratio
Prob>
1
11
Term
is
theparameterin
themodelbeing
estimated.The Estimate
values areestimations ofthecoefficientsof themodelfound
by
least
squares.
For
example,Smut
=p0
(intercept)
+Pi
(free sulfuric)
+p2
(pH)
+p3
(t seal)
+p4
(t
DI)
+ewhere,
Po, Pi, P2, P3,
andP4
aretheparameterestimates, wherePi
estimatesthefree
sulfuric effect,P2
estimatesthepHeffect,
etc.The Std
Error
(the
standard error oftheestimate)
is
thesquare root oftheestimatedvariance oftheparameterestimate and
is
usedtoquantify
theuncertainty
orvariability
in
theparameterestimates.In
otherwords,it is
anestimate ofthestandarddeviation
The
tRatio (t
value)
is
computed asfollows:
t=
Estimate/Std
Error
The
hypothesis
thatis
being
testedby
the teststatistic,
t,
is:
Ho: The
parameter=0
(model
terminsignificant)
Ha:
The
parameter*0
(model
termis
significant)
If
"Prob>1
11"<0.05,
thenrejectthenullhypothesis
andassumethemodeltermis
Effect
TestSource
Sum
ofSquares
F Ratio
Prob>F
The
"Effect
Test"providesthesame
information
asthe'Tarameter Estimates". It
is
atypeDI
statisticmeaning
it
presents apartialpartitioning
ofthemodel sum of squares.The
individual
sumsofsquaresare saidtobe
partialin
thateach sum ofsquares representstheamount of
variability
thecorresponding
modeltermswouldexplainif it
wasthelast
termentered
into
themodel. 21The F
Ratio,
"F
Value",
test statisticis:
F
=Sum
of
Squares (type
IID/DF
Error Mean Square
The
following
hypothesis
testis
constructedtodetermine
modeltermsignificance.Ho: The
variability
explainedby
themodeltermis
insignificant
Ha:
The variability
explainedby
themodeltermis
significant.If
"Prob>F"<
0.05,
thenrejectthenullhypothesis
and assumethemodeltermis
Lack ofFit
22Source
Sums
ofSquares (Lack
ofFit,
Pure
Error,
Total)
Lack
ofFit
Mean
Square
Pure
Error Mean
Square
F Ratio
Prob>F
MaxRSq
The
lack
offit
analysis provides abreakdown
ofthe error sumof squares.The
errorsumsorsquares
is
madeup
oftwocomponentsofvariability,lack
offit
errorandpure error.
To
separatethetotalsum ofsquaresinto
thelack
offit
andpure errorcomponentsthereare
four
steps.1.
For
eachdistinct
factor
combinationwhichis
replicated,
compute a standarddeviation,
s,
orvariance,s2,
from
theresponsevalues.If
therearek
distinct
factor
settingswithreplication, then therewill
be k
variancescomputed.These k
variancesrepresentk
estimatesoftheexperimental
variability
orpure error.2.
A
"total"pureerrorsums of squaresis
computed as:Pure
Error
Sum
of
Squares
=(dfO(s2)
+(df^)(s22)
+(df3)(s32)
+ ... +(df^(sk2)
where, dfk=
degree
offreedom
for
k*factor setting
Sk2 =
estimated variance
for
k*3
.The
lack
offit
sum ofsquaresis
obtainedby
subtracting
thepureerror sumof squaresfrom
the totalerror sum ofsquares.lack
offit
sumof squares=(total
errorsum of
squares)
-(pure
error sum ofsquares)
4.
The
degree
offreedom
associatedwithpureerrorandlack
offit
are obtainedfrom
thedegrees
offreedom
chart.(The
pureerrordegrees
offreedomcanalsobe
computedby
summing
thedegrees
offreedom for
eachindividual
variance estimate).The
pure error andlack
offit
sums of squares aredivided
by
theirrespectivedegrees
offreedom
toobtainthepureerror meansquare and alack
offit
mean square.The
pure error mean squareis
an estimate ofthepure error variance.However,
thelack
of
fit
mean squareis
anestimateofthe sumofthe"pure
error"variance and a "bias"
component.
The
bias
component representsthebias
or errorassociatedwithusing
aninappropriate
modeltodescribe
the truerelationship.Testing
thebias
significance,
whichreflectsthelack
offit,
is done
withthefollowing
hypothesis
test.The
F
ratiotests that thelack
offit
erroris
zero, andis
calculated
by:
F
Ratio
=(Lack
of
fit
mean square)/(Pure error meansquare)
The
hypotheses for
thetestareasfollows:
Ho: The
modelis
adequate, nolack
offit
A
"Prob>F'value <
0.05
implies
rejectionofthenullhypothesis
orlack
offit.
A
lack
offit indicates
thatadditional parameters shouldbe
addedto themodel.The F
ratio estimatesExperimental variability
+Model
bias
Experimental variability
The larger
theF statistic,
themore evidencethereis
ofabias
due
to an under-specifiedmodel.
Max
RSq
is
themaximumR2
that can
be
achievedby
amodelusing
only
the variablesin
themodel.It's
calculationis:
MaxB2
=
1
-SS
(Pure
Error)
Leverage Plots
nLeverage
plotsgraphically
illustrate
thesignificant parameters and atwhichlevel
willproducethemost
favorable
response.Essentially
theleverage
plotis
agraphicaldisplay
oftheEffect
Test.
Dotted
confidence curvesontheplotsindicate
whetherthe testis
significantatthe5%
level
by
showing
a confidence regionfor
theline
offit.
If
theconfidence regionbetween
thecurves containsthehorizontal
line
then theeffectis
not significant.If
theKEY
PROCESS
PARAMETERS
The anodizing
processhas many
parametersthatareimportant
to theproductionof good parts.
One
ofthehardest anodizing
parameterstocontrolis
thealuminumquality
from
suppliers.Because
anodic oxidationinvolves
aconversionof thealuminumsurfaceinto
anoxidecoating,
thealloy
andits
metallurgical structurehave important
effectsonthecharacteristicsofthe
finished
surface.Differences
in
coatingsarisewiththepurity
ofthe aluminum, the typeand
quantity
ofalloying
elements, typeof millproduct,
different
production
lots,
interchanged
manufacturerlots,
typeoffabrication,
ordifferent
temper/aging
treatments.All
ofthesefactors have
significant effects ontheappearanceand
functional
propertiesofthefinished
parts. 24Properties
ofanodic coatingsthat are affectedby
alloy
compositioninclude
appearance
(color,
reflectance, andtransparency),
continuity
(protectiveness),
abrasionresistance,weight
density,
porosity,dielectric
strength,
andcomposition.As
far
asappearance, purealuminum willproducethemosttransparentanodic
coating
ofallits
alloys.
Clear
anodized coatings(not
dyed)
couldlook
opaque, gray, gold,
tan,
orbrown
depending
onthemajoralloying
element. MThe
aluminumalloy
system assigns afour-digit
numericaldesignation
toeachgrade.
The
numericaldesignations for
thealloy
and castalloy
andthesuffixdesignations
are
in
Appendix
A.
Racking
is
anotherimportant
factor in
theproduction of goodanodic coatings.26current
flows
to thepartduring
anodizing.Rack
design
and partplacement ontherackare
important.
A
goodrackdesign
willhold
partssecurely, conduct current adequately,and
carry
afull
load
without shielding.For
themostpart,
racks aremade oftitaniumbut
may
alsobe
made of aluminum.Aluminum
racks requirestripping
after each use.Titanium
rackslast longer but
are more expensive and requirelarger
contact areabecause
oftheir
lower
electricalconductivity.Part
positionmust allowfor
gooddrainage
andavoidance of air pockets.
Having
rackedtheparts, processing
commences and parts aremovedfrom
tank totank.
There
aremany
tanksinvolved
in
theanodizing
process(Figure
1).
Furthermore,
thereare several
factors
of eachtanklike
concentrations,times, temperatures,
etc.thathave
considerable contributionsto thefinal
products.Adequate cleaning
is
thefirst
requiredtankprocessoperation.Because many
organic compoundswillacttoresist
etching
andanodizing
steps,they
needtobe
removed.
Control
of cleanerconcentration,
temperature,
andoilaccumulation areallnecessary.
Following
thecleaning
is
rinsing.Actually,
thoroughrinsing
mustfollow
eachchemical
step
in
thesequence oftanks.The
requirementsfor
therinsetanksareclean,
flowing
waterand an overflowlip.
Rinsing
may
be
singleormultipletankrinses andthey
may be
spray
orimmersion
tanks.Deoxidizing
is
thestep
tofollow cleaning
and rinsing.During
thisstep
anacidsolutionatan elevatedtemperatureremoves nonuniform oxide
films
andcontaminantsEtching
is
astep
thatmay
ormay
notbe
used.Its
purposeis
toremovethenaturalshine and provide a
soft, matte, textured
appearance.On
averageetching
is
a3-5
minuteprocess
in
anominally
five
percent sodiumhydroxide
solutionat90-120
F.
The anodizing
tankshave
many
key
processparameters, thefirst
being
thechemical concentration.
In
theanodizing
tank,
thesulfuric acid solutionis
controlledin
industry
at a nominalfifteen
percent solution.It
is important
that thetemperatures areheld
withina couple ofdegrees in
ordertoproduce consistentcoating
properties.Current
flow is
also recommendedtobe
controlledin
therangefrom
12-16
amperes/ft2.However
many
plants operateatfixed
voltagesinstead.
Agitation
is
anotherfactor
essentialto theprocess
in
ordertoprovide auniformsolutiontemperature throughout the tank.Cathode
location
canhave different
effectsonthethickness'oftheoxidecoatings.
The
closerthesurfacesareto the
cathode,
thethickertheanodiccoating
willbe.
When
desirable,
dying
is
carried out next.The
mostimportant
parametersin
thedye
tankarethedye
concentration,pH,
andtemperature.Agitation
is
neededtokeep
concentrations andtemperaturesuniform.
Also,
timeis
a mentionable variable.Longer
immersion
timeswillpromotedeeper dye
penetrationinto
theporesoftheoxide coating.Contamination
is
onelast
parameter.Impurities
suchasaluminum, sulfates,
andiron
affectabsorptioncharacteristics and
dye life.
The
last important
chemicaltankis
thesealtank.Without sealing
parts,
they
become
subjecttolower
corrosionresistance, staining,
andbleeding.
The
important
Table 4. Summarization
ofKey
Process Parameters
Metal
Quality
Impurities
Alloy
Composition
Processing
Temper/aging
treatmentCleaning
Tank
Cleaner Concentration
Temperature
Oil Accumulation
Time
Anodizing
Sulfuric Acid
Concentration
Aluminum Concentration
Temperature
Current
Agitation
Cathode Location
Time
Sealing
pHNickel Concentration
Fluoride Concentration
Temperature
Agitation
Contaminants
Time
Backing
Electrical
Contact
Rack Design
Part Placement
Rack Material
Binse
Tanks
pHTemperature (for
sometanks)
DEFECTS
Because
ofthecomplexity
oftheanodizing
process, therearemany
possibilitieswhere
defects
can occurontheline. Different defects
thatoccurinclude,
lost
contact,smut,
overanodizing,
whitespots,bleed
out,
bent
parts,
crashedparts,burnt
parts, andstaining.
Causes for
thesedefects may be due
tomaterials, manpower, methods,
machines,
ormeasurements.The
key
process parameters oftheanodizing
processwerediscussed in
theprevious section.
The
possibledefects
thatcan occur whentheseparameters are not attheiroptimumare
discussed
next.Poor racking
or poorcontactdue
toinsufficient
rack-contact areaorloose
contactscan cause
iridescent
appearanceonclearparts,blue
appearanceonblack dyed
parts,
powdery coatings,
burning,
andotherproblems.Operator's
technique and properrack
design play
animportant
rolein
producing
good contact.Cleaning
wasthenextvariableto theprocessthatwas considered.When
thecleaner concentration
is
toolow
white spotsorstaining may
result.A
dried-on foam
pattern
may
resultif
the temperatureofthesolutionin
the tankis
toohigh.
Overly
vigorous agitationproduces excessive
foam
whichstays ontherack and parts.In
thedeoxidizing
tank,
whitespots,
film,
or"smut"result when allthecontaminatesare not removed
from
the surfaceoftheparts.The
samething
canhappen if
solutiontemperature
is
toohigh,
causticburning
results.Caustic
burning
is
anon-uniformetch patternthat
is
a rejectable product condition.Many
factors
areinvolved in
theanodizing
tank.Too
high
ofasulfuricacidconcentration
may
causesmutty,
overanodized partsorburnt
parts,
andtoolow
of asulfuric acid concentration
may
cause white spotted parts.The
concentration ofthealuminum
in
thetankis important for
theconductivity
thatis
necessary in
theoxidefilm
formation.
Too
high
ortoolow
aconcentration can causeoveranodizing
orunderanodizing
respectfully.Extended
timein
the tankmay
resultin
smutontheparts.High anodizing
temperatureswillproduce asoftercoating,
leading
todye bleeding.
Low
current could cause white spots or
dye
bleeding
as well.Air
agitationis necessary
toprevent part
burning.
Generally,
thedye
tankis
alow
maintenancetank,
andtherefore tanklife
canbe
many
years.As
contaminantsincrease
overmany
years, thedye
"spoils"andthiswill
cause
defective
colored parts.Black parts,
for
example,
wouldhave
ablue
tint.Concentrations
and pHplay
a rolein
getting
theright
colortoo.Sealing
thepartsis
a placein
theprocesswherenumerousthingscananddo
gowrong.
Low
nickelconcentrations andlow
pHleads
todye
bleeding.
High pH,
nickelprecipitation, andtoomuchtimeyield
smutty
product.On
thecontrary,
low
temperatures,
pH,
andsealing
timeproduceaninadequate
seal.Figures 4-12 graphically
illustrate
possibleanodizing
defects
andthe explanationRacking
Rack
Design
Operator's
Technique
Rack
Welds
Flight
bar
Contact
Figure 4.
Causes for
Lost
Contact
Temperature
oftheanodizetank toohigh
Sulfuric
acid concentrationtoohigh
Current
density
toohigh
Anodize
Tank
New
seal- tooactive
Machine
quits-parts
in
toolong
DIH2Otoohot
Not
enoughNi
in
thesealant
Not
enoughNi
in
thesealant
pHtoo
high
In
the tank toolong
Temp,
ofblack dye
too
high
In
the tank toolong
Sulfuric
acidconcentration too
high
Figure 6.
Causes for Smut
iMffiflQWffljw^^^,.v...v.,.x.. ... ...w4s#ss^vr*-**XKKga
^ '
' 1 ' r '
Cleaner
Concentration
too
low
Sulfuric Acid
Concentration
too
low
Current
toolow
Lost
Contact
Black
die;
rectifier not
turnedon
Dead
holes
not pluggedornot
facing
down
'r
'r 1'
Sulfuric Acid
getsin
the
dead
holes
Salt
dries in
thedead holes
Figure
8. Causes for
Bleed
Out
'
'' ^r
Operators
Cleaner Low
Computer
Lack
ofMaintenance
Airline
pushed out
Hoist
missesthe
flight bar
Figure 10.
Causes for Crashes
I
1
liKpurnt
Parts
'7-.
~.
??
^%<<CW-:MIIIIIIMMMMtlllllllllMIIIIIIIIIIIIIMIIItlMIIIIM MMIIIIlT:
Sulfuric Acid
Concentration
toohigh
^SS^w^^^^^^^^a^^gg^&^g^fi&iw^^^
Air Agitation
Air
notturnedon
Current
toohigh
Airline
loose
Parts
in
theairtoo
long
Cleaner Low
A
paretochart analysiswasusedtodetermine
thetop
defects
oftheanodizeprocess.
A
pareto analysisis
atechniquefor
prioritizing
typesor sources of problems.It
"separates
the 'vitalfew'from
the'trivial
many'and provides
help
in
selecting
directions
for
improvement."28These
data
werecollected over atimespan of oneyearbased
oncustomer complaints.
Table 5. Customer Complaints
Defect
#of
occurrences
Percentage
ofoccurrences
Percentage
ofdefective
partsOver
anodized(film)
2
12.5
%
31.4%
Scratches
3
18.8
%
21.6%
Smut
6
37.5
%
20.7
%
White
Spots
2
12.5
%
15.2
%
Masking
1
6.25
%
4.5
%
Bleed
Out
1
6.25 %
4%
Rack
Marks
1
6.25
%
2.6
%
See figure
13
for
thegraphshowing
thepareto analysis.Based
onthenumber ofoccurrences, smut
is
thebiggest
problemand accountedfor
sixout ofthesixteen reporteddefects
thatreachedthecustomer.In
additionit
wasin
thetop
threefor
thenumber ofc
Q.
E
o
o
E
o
Another
setofdata
wascollected onthescrap/reworkfor
ten weeks, andthisdata
is
representedbelow in
table6
andfigure
14.
Table
6. Scrap/Rework
Defect
#
of occurrencesPercentage
ofoccurrences
Percentage
ofdefective
partsLost Contact
25
73.5
%
43%
Color
1
2.9
%
20%
Crash
1
2.9
%
17%
White
Spots
1
2.9
%
11%
Bent
3
8.8
%
5%
Dirty
Parts
2
5.9 %
2%
Racking
1
2.9
%
1%
From
thisscrap/reworkdata for
tenweeksit is
apparentthatlost
contact parts arethenumberoneproblem with
both
thegreatestnumberofdefective
parts andoccurrences.This
data
wasdetermined
tobe incomplete because
everything
wasnotbeing
recorded,
especially
thereworkedparts.For
exampletherewerelarge
lots
ofsmutty
partsmany
of8
i t
o
t-xt) I
03
m
w 3 n
O
c o
O 55
o
o Q.
CO
o o
S
o o
w to o> ;_ *
to
i i Mr
0
G>
CM
O
0)
o
ii
Q O
5 "5
01
i
op
DESIGN
OF
EXPERIMENTS
Pre-experiment
Reduction
ofdefective
partsis
thegoal oftheproject.The
questionof whichdefect
to tackleneededtobe
resolvedby
brainstorming.
Brainstorm
The
first
step
oftheDOE
processis brainstorming.
For
thebrainstorming
sessiona
group
of expertsconsisting
oftwoproductionsupervisors, themost experiencedline
operator, maintenance, the
department's
quality
coordinator, a chemicalengineer, andtwoother
anodizing
experts attended.Project Objective
Many
objectivesweretobe
accomplishedduring
theteammeeting.The primary
goal ofthe
meeting
wastoagreeona projectobjective,
andthisgoal was met.The
project objective
is
to test thehypothesis
that smutis
afunction
of sixfactors:
anodizetemperature,
sealtemperature,
hot
DI
rinsetemperature, free
sulfuric acid concentrationin
Besponse Variable
(Output)
A
combination offactors
wasinvolved in
deciding
ontheprojectobjective, thecustomer complaint
data,
scrap/reworkdata,
operatorinteraction,
andteammembersconsensus.
Before
the team meeting,lost
contactappearedtobe
theobvious choicetobase
theexperiment onbecause
ofthescrap/reworkdata
and pareto analysisthat showed25
occurrencesduring
the tenweekinterval
ofdata
collection.However,
therewereseveralreasons
why
thiswas not selectedby
the team.First
ofall,
lost
contactis
aproblemthat
is
well understood.Basically
it is
aracking
problemdue
to theracksthemselves,
the operators, orthecontacts as shownin
previous section(Figure
4).
Secondly,
therewerenolost
contact partsthatslippedthrough to thecustomerin
1994.
The
problemselected wassmut,
the secondlargest
problem.Because
smutformation
depends
uponmany
factors
suchas, chemistries,times,
andtemperatures,
thelearning
potential wasimmense.
With
thecomplexity
ofthesmut problemcomesmany
conflicting
opinions, that need resolution.Furthermore,
it
wastheproblem withthemostoccurrences of
dissatisfied
customers.Six
of sixteen(37.5%)
complaints were receiveddue
tosmutin
1994,
meaning
therewere six occasionswherecustomers receivedsmutty
parts.
Also,
operators admittedthatthey
werehaving
alarge
smutting
problem,
thatwasnot recordedonthe
data
log
sheets.For
these reasons, smutwas chosenastheresponseFactors
(inputs)
In
thebrainstorming
session,
thekey
parameters oftheanodize process whichmay
be
involved
in
producing
smutweredetermined
asfollows:
Table 7. Possible Variables
thatCause Smut
(Brainstorm)
Seal
Time
Temperature
Concentration
offluoride
Concentration
of nickelContamination
. pH
Age/activity
Anodize
Time
Temperature
Sulfuric
acid concentrationAluminum
concentrationCurrent
density
Black
Dye
Time
Temperature
Material
Alloy
Composition
Table
7
wasthenarrangedinto
constants and variablesfor
theexperiment andis
shown
below in
table8.
Table
8.
Experiment Variables
andConstants
(First
Draft)
Variables
Constants
Seal
temperatureMaterial
Anodize
temperatureAll
timesHot DI
rinsetemperatureBlack
dye
tankconditionsSulfuric
acid concentrationCurrent
density
Fluoride
concentration pHhot
DI
rinsepH of theseal
Contamination
Age/activity
ofthe sealAluminum
concentrationin
the anodizetankConcluding
theresults ofthemeeting,
afull
project objective wasdeveloped.
The
hypothesis
tobe
testedis
thatsmutis
afunction
of sixfactors:
anodizetemperature,
free
sulfuric acid concentration
in
theanodizetank,
sealtemperature,
sealpH,
fluoride
concentration
in
thesealtank,
andthe temperaturein
thedistilled
water rinse aftertheseal.
The material,
thenumber ofparts,
andthelevels
ofinput
weregoing
tobe
Revelations Since
theBrainstorming:
Material
Four
questionspertaining
to thematerial/partsselectionneededtobe
addressed sothatmaterial could
be
orderedin
time toruntheexperiment.They
were:1)
whichaluminum
alloy,
2)
whatform:
couponsor actual productionparts,3)
how
many
pieces,and
4)
how
fast
canthepartsbe
obtained.A 6000
seriesaluminum,
6061,
was chosenasthematerialbecause
it is
the"purest"
aluminumanodized atthecompany.
An
actual production part was chosen overcoupons
because
of unknowntempersthatareunrepresentative of production parts.A
windowpart was selected
because
1)
it is
madeof6061
aluminum,2)
smut problemsareoccurring
withthese parts,3)
high
productionlots
are run oftheseparts,
4)
thereexists1000
partsavailablefree
ofcharge.Furthermore,
thetheory
wasthat thechosenpartswere sensitiveto theprocess
indicating
whentheprocess wasoutofcontrol.Therefore,
if
the smutproblemcould
be
solvedfor
theseparts,
thenit
couldbe
resolvedfor
any
otherparts aswell.
Number of
Parts
Calculations
showedthatatleast
onerack ofseventy
twoparts neededtobe
produced per runto
be
successful.The
calculation wasbased
ontheminimum a